Aug 1, 2017 - [4] S. Sachdev, Quantum Phase Transitions, 2nd ed. (Cambridge ... Wang, G. Bianconi, A. Brinkman, H. Hilgenkamp, A. A. Gol- ubov, V.M. ...
Scaling Universality at the Dynamic Vortex Mott Transition Martijn Lankhorst,1 Nicola Poccia,2 Martin P. Stehno,1 Alexey Galda,3, 4 Himadri Barman,5 Francesco Coneri,1 Hans Hilgenkamp,1 Alexander Brinkman,1 Alexander A. Golubov,1, 6 Vikram Tripathi,3, 5 Tatyana I. Baturina,3, 7, 8, 9 and Valerii M. Vinokur3
arXiv:1708.00273v1 [cond-mat.supr-con] 1 Aug 2017
1
MESA+ Institute for Nanotechnology, University of Twente, 7500 AE Enschede, The Netherlands 2 Department of Physics, Harvard University, Cambridge, MA 02138, USA 3 Materials Science Division, Argonne National Laboratory, 9700 S. Cass Ave, Argonne, IL 60439, USA 4 The James Franck Institute and Department of Physics, The University of Chicago, Chicago, IL 60637, USA 5 Department of Theoretical Physics, Tata Institute of Fundamental Research, Homi Bhabha Road, Navy Nagar, Mumbai 400005, India 6 Moscow Institute of Physics and Technology, Institutskii per. 9, Dolgoprudny, 141700, Moscow District, Russia 7 A. V. Rzhanov Institute of Semiconductor Physics SB RAS, 13 Lavrentjev Avenue, Novosibirsk 630090, Russia 8 Novosibirsk State University, Pirogova str. 2, Novosibirsk 630090, Russia 9 Departamento de F´ısica de la Materia Condensada, Instituto de Ciencia de Materiales Nicol´as Cabrera and Condensed Matter Physics Center (IFIMAC), Universidad Aut´onoma de Madrid, 28049 Madrid, Spain The dynamic Mott insulator-to-metal transition (DMT) is key to many intriguing phenomena in condensed matter physics yet it remains nearly unexplored. The cleanest way to observe DMT without the interference from disorder and other effects inherent to electronic and atomic systems, is to employ the vortex Mott states formed by superconducting vortices in a regular array of pinning sites. The applied electric current delocalizes vortices and drives the dynamic vortex Mott transition. Here we report the critical behavior of the vortex system as it crosses the DMT line, driven by either current or temperature. We find universal scaling with respect to both, expressed by the same scaling function and characterized by a single critical exponent coinciding with the exponent for the thermodynamic Mott transition. We develop a theory for the DMT based on the parity reflection-time reversal (PT ) symmetry breaking formalism and find that the nonequilibrium-induced Mott transition has the same critical behavior as thermal Mott transition. Our findings demonstrate the existence of physical systems in which the effect of nonequilibrium drive is to generate effective temperature and hence the transition belonging in the thermal universality class. We establish PT symmetry-breaking as a universal mechanism for out-of-equilibrium phase transitions.
INTRODUCTION
A Mott insulator [1–3] is a material that should be a conductor according to the standard band theory of electrical conductivity, but acts as an insulator nonetheless. The Mott insulating state arises because of the concurrent action of electronelectron strong correlations and periodic atomic potential has been always viewed as an exemplary manifestation of manybody quantum physics [4]. However, the correspondence between the quantum mechanics of a D-dimensional system and the classical statistical mechanics of a D + 1-dimensional system [5], lead to a conjecture that a vortex Mott insulator forms in a type II superconductor if the density of superconducting vortices matches the density of the pinning sites [6]. The vortex Mott insulator, albeit purely classical formation, harbors all essential features of its 2D quantum electronic parent: it is incompressible and vortices remain localized at low temperatures. The existence of the vortex Mott insulator was conclusively evidenced in [7] by measurements of the compressibility of the vortex system localized by the periodic surface holes. Importantly, the observed Mott insulator is actually a 2D classical formation, which therefore can be viewed as the commensurate vortex state that was extensively discussed in the vortex community in terms of the enhanced pinning at matching magnetic fields, see, for example, [8] and references therein. The implications of the exis-
tence of the vortex Mott state are far reaching and two-fold. First, it teaches us that Mott physics embraces more than believed before and includes classical systems. Second, it offers an opportunity of studying quantum many-body strongly correlated physics by experiments on more easily accessible classical systems. Recent numerical simulations of the 2D system of Coulomb-interacting classical particles [9] that demonstrated critical scaling at the dynamic Mott transition are in a perfect concert with this conclusion. Indeed, Mott insulating state can be destroyed not only by varying temperature or pressure, but also by applied driving field delocalizing particles [4, 10–13]. The observation of the current-driven vortex Mott insulator-to-metal transition in a proximity array [14], where the vortex Mott insulator state forms [6, 15], was an enabling discovery in experimental Mott physics. It provided the first tangible example of a dynamic Mott transition having settled the vortex quantum mechanical mapping on a firm experimental basis. That the revealed nonequilibrium critical behavior with respect to the nonequilibrium drive is the same as that of conventional thermal Mott transition with respect to temperature, raises a largely open class of questions. Among these is a central issue in condensed matter physics: the generalization of a thermodynamic phase transition to nonequilibrium conditions. There have been tantalizing reports that in systems where tuning parameters like temperature, pressure, or magnetic field alter the
2 symmetry, the nonequilibrium drive generates the effective temperature and the corresponding transition appears in the conventional thermal universality class [16, 17]. The finding of [14] paves the way for further generalizing this conclusion to a wider nontrivial class of phase transitions, which, like the Mott transition, are not accompanied by a change of symmetry, and calls for intensifying experimental study of the DMT and the interchangeability of external drive and temperature when crossing the transition line. The hallmark of an electronic Mott insulator-to-metal transition derived from the Hubbard model[18], which encompasses the essential physics of the Mott insulator and Mott transition, is a change in the electronic density of states (DOS) from gapped (insulator) to peaked (metal) shape[10, 19, 20] near the Fermi level. Experimentally, the Mott transition can be detected by measuring the tunneling differential conductance as a function of the particle density and observing the change from a sharp dip, which reflects depletion of the electronic states at the Fermi level, to a peak, which signals that a Mott metal has formed. We build on the fact that a vortex system trapped in a regular array of pinning sites is a much purer realization of the Hubbard model than standard electronic Mott materials. In the dual vortex system, the quantum particles – vortex correspondence maps the tunneling differential conductance of particles onto the thermally activated differential resistance, dV/dI. Hence dip-to-peak reversal of the latter measured as a function of the magnetic field heralds the vortex Mott transition [14].
RESULTS
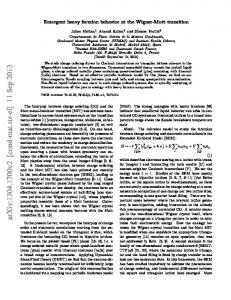
We focus on the vortex Mott insulator that forms as the vortex matches the density of the regular potential minima, i.e. at the applied magnetic field corresponding to a single flux quantum Φ0 = π~/e per pinning site. We create an eggcrate periodic pinning potential patterning a square array of 270 × 270 Nb islands with the lattice constant a = 250 nm on a 40 nm-thick base layer of Au on Si/SiO2 as shown in Fig. 1. The islands are 45 nm in height and 142 ± 5 nm in diameter. Additionally we placed Nb bars on either sided of the array structure to ensure uniform current injection. The superconducting transition temperature of the array, T c = 2.8 K, is determined as the midpoint of the transition in temperatureresistance curve. For our square array, the magnetic field at which the number of vortices matches the traps is B0 = Φ0 /a2 . It is convenient to introduce the vortex filling fraction f = B/B0 , so that f = 1 corresponds to one vortex per lattice cell. We measure current-voltage characteristics with small steps in magnetic field and temperature and obtain dV( f )/dI curves by numerical differentiation. From these data, the phase boundary was determined by tracking the position of the dip-to-peak reversal as a function of current (I) and temperature (T ). The details of measurement technique are given in Supplementary Materials (SM). Figure 2(a) presents the phase diagram of the Mott states in the T -I coordinates summarizing the experimental results of our work. Representative sets of dV/dI curves are shown in Fig. 2(b,c). These data were taken using a standard lock-in technique near the transition with very small steps of 5 µT in magnetic field, 0.5 µA in current (Fig. 2(b)), and 5 mK in temperature (Fig. 2(c)). The isothermal plots of panel (b) display the expected dip-to-peak reversal upon increasing the current. The separatrix current I0 divides between the insulating I < I0 and metallic I > I0 phases. Note the asymmetry in the dV/dI behaviors at f < 1 and at f > 1. The loci of I0 (T ) yield phase transition lines in Fig. 2(a) for f < 1 and f > 1. Fixing the current I . I0 and then varying temperature yield the similar dip-to-peak reversal behavior, see Fig. 2(c). Subtracting the separatrices from the dV/dI data, yields the fanlike set of curves displayed in Fig. 2(d,e), indicating a transition from insulating (bent down towards f = 1) to metallic (bent up) behaviours.
CRITICAL SCALING
FIG. 1. Experimental realization of charge-vortex duality for Mott insulator. (a) A sketch of the device. The device consists of a square array of 270 × 270 superconducting Nb islands on a conducting Au layer. On both sides of the array, a Nb bar is placed to ensure the current passes through the array homogeneously. The potential difference between the bars is measured as a function of the external current and an external magnetic field perpendicular to the plane of the array. (b) Scanning electron microscopy image of the sample.
We start our analysis with the following question: is the observed current-driven dip-to-peak flip indeed a purely dynamic effect, or rather a mere result of the heating due to current-induced vortex motion? To answer it, let us consider the quantity N(T, B) = dV/dI − V/I that measures the degree of nonlinearity. Figures 3(a) and 3(b) show the color plots of N(T, B) in coordinates f -I and f -T , respectively. The bright red regions (‘red flames’) indicate domains of strong nonlinearity that arise around f = 1. Apart from the critical re-
3
FIG. 2. Vortex dynamic Mott insulator-to-metal transition. (a) The temperature-current phase diagram of the vortex Mott states. The left and right panels present the transition line between the insulating and metallic states at f < 1 and f > 1, respectively. In the former the elementary excitations are vortex holes, i.e. some of the traps lack vortices. In the latter the elementary excitations are the excess vortices i.e. some traps contain more than one vortex. (b) The set of differential resistance vs. filling factor curves taken at different currents in the critical region at temperature T = 1.0 K. The set corresponds to current-wise crossing of the phase boundary. The currents increase from the bottom to the top, the range of currents is shown in the color legend. The black dotted line is the separatrix dV/dI|I=I0 , I0 = 51.0 µA for f > 1. The separatrix divides current ranges corresponding to the vortex Mott insulator (at I < I0 , dV/dI bend down as f → 1) and vortex Mott metal (at I > I0 , dV/dI turning up as f → 1). (c) The similar set of differential resistances vs. filling factor curves, but taken at different temperatures and fixed current I = 50.5 µA. The temperature increases from the bottom to the top and corresponds to the temperature-wise crossing of the phase boundary line. The black dotted line is the separatrix dV/dI|T =T0 , T 0 = 1.0 K for f > 1. (d,e) The differential magnetoresistances dV/dI after subtracting the separatrices dV/dI|I=I0 and dV/dI|T =T0 , respectively. The fan-like sets of curves near f = 1 visualize the dynamic Mott transition.
gion near the transition the plots are predominantly blue in color. This shows that the response of the system is almost linear, dV/dI ≈ V/I. Since dissipation is proportional to I · V and the experiment is carried out at constant I, the dissipation
FIG. 3. The critical region of the vortex dynamic Mott transition. The color plots of the measure of degree of nonlinearity N = dV/dI − V/I as function of the filling factor f and current at T = 1.0 K (a) and as function of f and temperature at I = 90 µA (b). The color legend is the same for both plots.
is higher where R is larger. Within the experimental range of currents and temperatures across the transition, the resistance grows linearly R ∝ |b| ≡ |1 − f | upon the deviation from f = 1. This reflects the linear increase of the density of vortex “holes” or the excess vortices that mediate the motion of the vortex system upon deviation from f = 1, see Fig. 6(c,d) in SM, and implies that the mobility of vortices remains nearly unchanged in our experiment. Therefore, had the nonlinearity originated from heating, it could have only increased with increasing |b|. The observed effect is the opposite: the nonlinearity associated with the dip-to-peak reversal exists only in the nearest vicinity of f = 1. Hence the contribution of heating effects from vortex motion is negligible and cannot be the origin of the observed dip-to-peak flip in the differential resistance. At first glance, the fact that temperature can delocalize vortices as well as current comes as no surprise. However, closer inspection reveals that while the applied current decreases the activation barrier for vortex motion via a mere tilt of the eggcrate potential, the effect of temperature, is by far more complex. It manifests via an interplay of thermal suppression of the Josephson coupling and the smoothing of the egg-crate potential due to thermal fluctuations in vortex positions. One
4
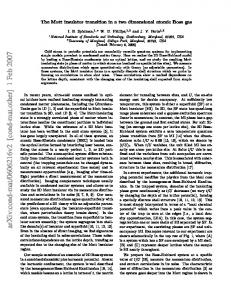
FIG. 4. Scaling analysis of the dynamic Mott transition. (a,b) The log-log plots of [∂(dV/dI)/∂I]I0 and of [∂(dV/dI)/∂T ]T0 vs. b, both shown by symbols. The solid lines show the linear fits. (c) The semi-log plot of the differential magnetoresistances dV/dI after subtracting the separatrix dV/dI|I=I0 presents the same data as Fig. 2(d) as function of the scaling variable |I − I0 |/b2/3 . The perfect collapse onto two generic scaling curves for I < I0 and I > I0 at �I = 2/3 evidences the critical behaviour of the current-driven vortex Mott transition. (d) The semi-log plot of the differential magnetoresistances dV/dI after subtracting the separatrix dV/dI|T =T0 presents the same data as Fig. 2(e) as function of the scaling variable |T − T 0 |/b2/3 . This illustrates the critical behaviour of the temperature-driven crossing of the DMT transition line. (e) The plots from panels (c) (blue symbols) and (d) (red symbols) perfectly collapse on top of each other upon rescaling the abscissa of the panel (d) by factor 1/r with r = 1.5 · 104 K/A, evidencing the identity of the FI and FT scaling functions defined by Eqs.(1),(2). The inset shows the segment of the phase transition line. The blue and red arrows stand for current-driven and temperature-driven crossings of the transition line, respectively.
might thus expect quite disparate behaviors with respect the temperature and the current. Yet the detailed examination of hundreds of recorded dV/dI curves versus temperature and magnetic field uncovers striking and far reaching affinity between current and temperature manifestations in the DMT critical behaviour. The scaling analysis of the DMT using the representative set of dV/dI curves from Fig. 2(b,c) is shown in Fig. 4. The benchmarks of Mott transition are the scaling relations governing the behaviour of dV/dI in the critical region [4, 10–12, 14]: ! dV |I − I0 | dV (b, I, T ) − (b, I, T )|I=I0 ∝ FI , (1) dI dI b�I ! dV dV |T − T 0 | (b, I, T ) − (b, I, T )|T =T0 ∝ FT , (2) dI dI b �T where �I and �T are exponents describing the current- and temperature-driven critical behaviours near DMT, respectively, and b ≡ | f − 1|. The formal procedure introduced in Ref. [21] for determin-
ing these critical exponents is to evaluate the derivative of the dynamic resistance with respect to I (or T ) at its critical value I0 (T 0 ). Taking into account that FI,0T (0) are constants, we arrive at [∂(dV/dI)/∂I]I0 ∝ b−�I , [∂(dV/dI)/∂T ]T0 ∝ b−�T .
(3)
Plotting [∂(dV/dI)/∂I]I0 and [∂(dV/dI)/∂T ]T0 as functions of b on a log-log scale should yield straight lines with slopes equal to −�I and −�T , respectively. The results of this procedure are displayed in Fig. 4(a,b). The data are indeed the straight lines for both, current and temperature derivatives, and the linear fit yields exponent values �I = 0.64 ± 0.02 and �T = 0.63 ± 0.03. Note, that the employed approach to determining scaling exponents uses only the values of the derivatives of the dynamic resistance at the critical point as given by Eq. (3). This gives us a good starting point for the scaling analysis of the entire set of data following Eqs.(1), (2). In the Figs. 4(c,d) we plot the data of Figs. 2(b,c) as functions of the scaling variables |I − I0 |/b�I and |T − T 0 |/b�T , respectively.
5 The collapse of the data on the single curves is excellent over two orders of magnitude of scaled abscissas for identical values of exponents �I = 2/3 and �T = 2/3. The same �I for the current-driven transition was reported previously [14] for the similar proximity system, but with the distinctly different parameters. Namely, the critical temperature was significantly higher, 7.3 K, and the island separation was smaller by factor two compared to the present case. More results of the scaling analysis supporting the universality of the critical exponents are given in Fig. 7 of the SM. As a next step we superimpose the scaling curves from panels (c) and (d) by dividing the temperature abscissa by the factor r = 1.5·104 K/A, which on a log scale corresponds to a mere shift of the curves, see Fig. 4(e). The striking collapse of the isocurrent and isothermal scaling curves heralds universality of the critical scaling at the DMT. The identity of the scaling functions FI and FT from Eqs. (1) and (2) together with the equality �I = �T , establishes the interchangeability of temperature and current effects in the critical region. Finally, the collapse evidences the linear relation between the current- and temperature-induced effects and thus completely rules out the heating origin of the current-driven transition.
DISCUSSION AND THEORY
We begin our theory discussion by noting that the experimental value �T = 2/3 coincides with the similar exponent for the thermodynamic Mott transition in an electronic system [22]. This implies that the thermodynamic Mott critical behavior extends onto far-from-equilibrium DMT. We conjecture that the nonequilibrium extension of the GinzburgLandau theory [17] applies to thermodynamic Mott transition and that the derivation of Landau functional in Ref. [19] can be generalized onto the DMT by including the driving current on the same footing as temperature. In the presence of the current the linear form eliminating the quadratic term in the Landau functional for the order parameter generalizes to L(| f − 1|, T − T 0 , I − I0 ) ≡ const f ( f − 1) + constT (T − T 0 ) + constI (I − I0 ). Accordingly, the condition that L = 0 near the transition [19] implies that constT (T −T 0 )+constI (I − I0 ) = 0 if we put f = 1. This gives rise to (T 0 − T )/(I0 − I) = −const ' (dT 0 /dI0 ). Making use of the phase diagram in Fig. 2(a), one finds at T 0 = 1.0 K, (dT 0 /dI0 ) = 1.7 · 104 K/A in a fair agreement with the experimental rescaling factor 1.5·104 K/A. To gain insight into the meaning of this parameter, let us recall that the energy that sets the depth of the potential well localizing vortices is estimated for a square sinusoidal egg-crate potential as 0.2E J [23], where the Josephson coupling of a single junction E J = (~/2e)ic , ic = Ic /(N − 1) is the critical current for a single junction, Ic is the critical current of the array, and N is the number of rows in the array. In this case we find that the fundamental temperature-to-current conversion ratio for a Josephson junction array [T/I] ≡ 0.2E J /[(N − 1)kB ic ] = 1.77 · 104 K/A – which nicely compares with the experimental r = 1.5 · 104 K/A. That [T/I] & r – indicates that the dielectric
breakdown of the Mott insulator occurs under the condition that vortices are still pinned, which accords with our direct observation. Identical scaling functions and resulting interchangeability of current and temperature have far reaching consequences, most notably, that dynamic critical behaviour of the Mott transition would teach us about thermodynamic criticality as well. To construct a theory of the DMT, we first find whether vortices behave like 3D or 2D objects with respect to vortex line wiggling induced by thermal fluctuations, in the conditions of our experiment. The proximity length in gold films induced by the Nb islands is expected to be & 100 nm (see, for example [24]), which exceeds the thickness, 40 nm of the gold substrate. Therefore, one expects that Nb islands induce superconductivity throughout the gold substrate. Therefore, the system can be viewed as a superconducting film with periodically modulated thickness, the thinnest volleys corresponding to inter-island areas. To check whether a vortex can be viewed as a flexible 3D string, one has to verify that the longitudinal size of the thermal vortex fluctuation, `T , fits within the gold film thickness. One estimates `T ∼ u2T ε/kB T [6], where uT is the average lateral thermal fluctuation of the vortex line and ε is its linear tension. The maximal possible umax , such that T the energy of the thermal fluctuations would not exceed the elastic interactions with other vortices localizing the test vortex within the potential well (i.e. that thermal fluctuations do ' cL a, [25, 26] where not melt vortex lattice), is given by umax T a ≈ 200 nm at f = 1 is the equilibrium vortex spacing. Making use of the relation εa ' 6T m ≈ 6T 0 , T m being the vortex lattice melting temperature, and recalling that for the vortex lattice cL = 0.16 [25], one finds that under the conditions of the experiment the longitudinal fluctuations do not exceed `T ' 30 nm. This means that vortices can bend exercising 3D thermal fluctuations and hence the 3D → 2D quantum mechanical mapping applies. In this mapping, the thermally activated motion of a 3D vortex over the energy barrier corresponds to the quantum tunneling of a 2D quantum particle across the same barrier. This enables us to describe the decay of the vortex Mott insulator as the electric field-driven Landau-Zener-Schwinger (LZS) tunneling of a charged quantum particle across the Mott gap, ∆, [27, 28] and construct a quantitative non-Hermitean LZS theory of the critical behaviour of the DMT [29]. We find that in the presence of dissipation the applied electric field F generates an imaginary field χ(F). The Hamiltonian becomes non-Hermitean while retaining its invariance under the combined parity reflection and time reversal (PT ) transformation. The Mott gap is defined as ∆ ≡ E1 − E0 , where E0 and E1 are the energies of the ground, |0i, and the first excited, |1i, eigenstates. Remarkably, within a framework of non-Hermitean LZS, the very definition of ∆ that prohibits the introduction of the standard order parameter for Mott insulator, ceases to be a stumbling block for a theory, but becomes a stepping stone enabling a description of the Mott insulator’s decay as the probability of the LZS tunneling, P = |h0|1i|2 , across the gap. The DMT occurs at the field where P becomes unity. At the critical value χ0 = χ(F0 ),
6 where F0 is the field of the dielectric breakdown, the eigenvalues E0 and E1 merge and the Mott gap collapses to zero (see Appendix for the details of calculation). Simultaneously, at this bifurcation point the ground state loses its PT symmetry. We thus identify DMT as the PT symmetry-breaking phase transition. Analyzing the spectrum behavior near the bifurcation point, we find the critical collapse of the Mott gap as ∆ ∝ (F0 − F)1/2 leading to P ∼ exp(−2γ) with the effective action γ ∝ (F0 − F)3/2 /F. Upon returning to the vortex system via the reversed quantum mapping, i.e. substituting ~ by temperature T and the field F by the current I, the probability of the decay of the vortex Mott insulating state assumes the thermally activated form P ∝ exp[−A(I0 − I)3/2 /T ] (A is the constant to ensure the correct dimensionality) with the activation barrier that scales as (I0 − I)3/2 near the DMT. This leads directly to the critical exponent �I = 2/3 (see Methods) and is exactly what our experiment shows. In the opposite limit of very thin superconducting system such that `T exceeded the thickness of the proximityinduced superconducting film, the vortices are effectively twodimensional and quantum mapping would not apply. However, as we now show, the non-Hermitian description of the DMT, leading to the (I0 − I)3/2 scaling, holds even in this case. To see that, note that in the vicinity of the commensurability point, f = 1, the transport properties of a near-commensurate vortex system are governed by the density of the excess/deficit excitations over its commensurate value. We thus introduce a classical field Ψ(x, t) describing the excess vortices (or vortex holes). The fluctuating part of the vortex system free energy is then given by the 2D Ginzburg-Landau functional Z h i F = d2 x D|∇Ψ|2 + m2 |Ψ|2 + u|Ψ|4 , (4) where D is the stiffness of the excess vortices system, and m and u are respectively the mass and interaction parameters that govern the mean-field transition. Although the vortex fields are not intrinsically dynamic, they are subject to temporal fluctuations due to coupling to the Ohmic environment of the metallic vortex cores. This results in the overdamped equation of motion, δF ∂Ψ + ρ ∗ = 0, ∂t δΨ
(5)
where ρ represents viscous damping of the vortex motion and is phenomenologically proportional to the (charge) resistivity. Performing gauge transformation to turn the vector potential into the scalar one, we can recast Eq. (13) into the form ∂Ψ − i(I/ρ)xΨ = D∇2 Ψ − m2 Ψ − 2u|Ψ|2 Ψ , ∂t
(6)
where I is the applied imaginary current driving vortices. This equation is formally identical to a nonlinear Schr¨odinger equation in Euclidean time for 2D interacting particles subject to an imaginary electric field. In the vicinity of the transition one can neglect the nonlinear term, and again exercise the
machinery of the LZS tunneling of a charged quantum particle across the Mott gap described above and find (I0 − I)3/2 scaling near the DMT. Note finally that our PT symmetry-based description of the DMT rests on the general properties of non-Hermitian quantum mechanics rather than on specifics characteristic to Mott systems. Therefore, our approach applies to a broad class of phenomena well beyond the immediate context of the Mott physics and provides a universal tool for analytical description of out-of-equilibrium phase transitions and instabilities in open quantum dissipative systems. The general principle is that if at small drives the system’s non-Hermitian Hamiltonian is endowed with the PT symmetry, the out-of-equilibrium phase transition manifests as a PT symmetry-breaking at the corresponding threshold value of the driving field.
APPENDIX A: DERIVATION OF THE MOTT GAP COLLAPSE
The vortices frozen into the minima of the egg-crate potential near f = 1 are described by the Hubbard model [27, 28]. The Mott gap, ∆(Ψ(t)) = E1 − E0 , is defined as the difference of energies of the first excited state E1 and the ground state E0 of the Hubbard Hamiltonian, with Ψ(t) being the time-dependent gauge field describing the combined effects of the applied field F and dissipation. The rate of the decay of the Mott insulating state is given by the LSZ probability of the |0i → |1i transitions, P ≡ |h0|1i|2 ∼ exp(−2γ). The reduced actionR is given by the Landau-Dykhne formula [30], γ = (1/~) Im dt [E1 (Ψ(t)) − E0 (Ψ(t))], with Ψ = Ft + iχ. The imaginary part of the field, χ, which arises as a result of combined action of driving field and dissipation, increases monotonously with the applied field F and renormalizes the Mott gap ∆ to zero at the Mott transition. The dissipation, i.e. energy relaxation, makes the quantum amplitudes along and opposite to the applied field unequal, the difference being quantified by the factor e2χ , see Ref. [15]. One can show analogously to [17] that integrating out the thermal bath degrees of freedom generates the imaginary potential χ ∼ iF near the critical point. The Mott gap closes at the critical field F = F0 which maps onto the critical point Ψc in the complex Ψ-plane. In terms of the non-Hermitian Hamiltonian, merging of E0 and E1 and closing the corresponding spectral gap marks the PT symmetry breaking transition. At this point the eigenstate |0i loses its PT symmetry and E0 simultaneously acquires the imaginary part, i.e. the energy spectrum ceases to be real [31]. The DMT is then identified with the PT symmetry-breaking phase transition. The Mott insulating state corresponds to the regime of unbroken PT symmetry with the real energy spectrum [29]. The exact field-dependence of the imaginary part of the gauge field, χ(F), depends on microscopic details, but for analysis of the critical behaviour it suffices to know that χ(F) is a well-behaved function of F near the critical field F0 . Expanding around the critical R χ0 value χ0 ≡ χ(F0 ), where ∆(F0 ) = 0, yields γ ≈ (1/~) χ dχ0 ∆(χ0 )/|dΨ/dt| =
7 R χ0 (1/F~) χ dχ0 ∆(χ0 ) ≡ (Fth /F) ∝ (F0 − F)3/2 /F (see SI). Far below the transition γ reduces to the standard Landau-Zener formula [27, 28], where the threshold field Fth is related to the Mott gap ∆ ∼ |U − Uc | as Fth ∼ ∆2 . Here U is interaction strength, and Uc is the critical interaction at which the Mott transition takes place. To relate the critical exponent for the collapse of the Mott gap with �I , we recall that in the system of superconducting vortices, their interaction strength is controlled by the vortex density, which is proportional to the external magnetic field, hence |U − Uc | ∼ |b|. Replacing the field F by the current I according to the quantum mapping recipe, the energy gap collapses non-analytically as ∆ ∼ |χ0 − χ|1/2 , upon approaching to the Mott transition, I → I0 , see Ref. [32]. Accordingly, the threshold current Ith (γ = Ith /I) scales as |I0 − I|3/2 since ∆ ∼ |χ0 − χ|1/2 . Since near the DMT, the kinetic energy gained by a vortex in nearest-neighbour hopping down an effective field Ith scales as E J (corresponding to the strength of the Coulomb repulsion in quantum particle representation), the universal scaling function is a homogeneous function of |I − I0 |3/2 /b, i.e., �I = 2/3. In the SM, we provide details of the scaling analysis and discuss the relation between �I and the standard critical exponents z and ν.
Acknowledgments
We thank Frank Roesthuis and Dick Veldhuis for help and support during the experiments and I. Aleiner, B. Altshuler, G. Kotliar, and A. Millis for illuminating discussions. Work was supported by the Dutch FOM and NWO foundations, the Italian Ministry for Education and Research, the Russian Science Foundation (project No 14-22-00143), the Ministry of Education and Science of the Russian Federation, and by the U.S. Department of Energy, Office of Science, Materials Sciences and Engineering Division (A.G. and V.M.V.); V.T. was supported through Materials Theory Institute at ANL, the University of Chicago Center in Delhi and a DST (India) Swarnajayanti grant (no. DST/SJF/PSA-0212012-13). T.I.B. acknowledges financial support from the Alexander von Humboldt Foundation and from the Consejera de Educacin, Cultura y Deporte (Comunidad de Madrid) through the talent attraction program, Ref. 2016-T3/IND-1839.
[1] N. F. Mott and R. Peierls, Discussion of the paper by de Boer and Verwey, Proc. Phys. Soc. 49 (4S), 72 (1937). [2] N. F. Mott, The Basis of the Electron Theory of Metals with Special Reference to the Transition Metals, Proc. Phys. Soc. A 62, 416 (1949). [3] N. F. Mott, Metal-Insulator Transitions. (Taylor and Francis, London, 1990). [4] S. Sachdev, Quantum Phase Transitions, 2nd ed. (Cambridge University Press, 2011). [5] A. M. Polyakov, Gauge fields and strings, (Hardwood Academic Publishers, Chur, 1987)
[6] D. R. Nelson and V. M. Vinokur, Boson localization and correlated pinning of superconducting vortex arrays, Phys. Rev. B 48, 13060 (1993). [7] S. Goldberg, Y. Segev, Y. Myasoedov, I. Gutman, N. Avraham, M. Rappaport, E. Zeldov, T. Tamegai, C. W. Hicks, and K. A. Moler, Mott insulator phases and first-order melting in Bi2 Sr2 CaCu2 O8+δ crystals with periodic surface holes, Phys. Rev. B 79, 064523 (2009). [8] V. V. Moshchalkov, M. Baert, V. V. Metlushko, E. Rosseel, M. J. van Bael,K. Temst, Y. Bruynseraede, R. Jonckheere, Pinning by an antidot lattice: The problem of the optimum antidot size, Phys. Rev. B 57, 3615 (1998). [9] L. Rademaker, V. M. Vinokur, and A. Galda, Universality and critical behavior of the dynamical Mott transition in a system with long-range interactions, Sci. Rep. 7, 44044 (2017). [10] M. Imada, A. Fujimori, and Y. Tokura, Metal-insulator transitions, Rev. Mod. Phys. 70, 1039-1263 (1998). [11] V. Dobrosavljevic, N. Trivedi, and J. M. Valles, Jr., Ed. Conductor-Insulator Quantum Phase Transitions, (Oxford University Press, Oxford, UK, 2012). [12] L. Balents, L. Bartosch, A. Burkov, S. Sachdev, and K. Sengupta, Competing Orders and Non-Landau-Ginzburg-Wilson Criticality in (Bose) Mott Transitions, Prog. Theor. Phys. Suppl. 160, 314 (2005). [13] P. A. Lee, N. Nagaosa, and X.-G. Wen, Doping a Mott insulator: physics of hightemperature superconductivity, Rev. Mod. Phys. 78, 17 (2006). [14] N. Poccia, T. I. Baturina, F. Coneri, C. G. Molenaar, X. R. Wang, G. Bianconi, A. Brinkman, H. Hilgenkamp, A. A. Golubov, V. M. Vinokur, Critical behavior at the dynamic vortex insulator to metal transition, Science 349, 1202 (2015). [15] R. A. Lehrer and D. R. Nelson, Vortex pinning and the nonHermitian Mott transition, Phys. Rev. B 58, 12385 (1998). [16] A. Mitra, S. Takei, Y.-B. Kim, and A. J. Millis, Nonequilibrium Quantum Criticality in Open Electronic Systems, Phys. Rev. Lett. 97, 236808 (2006). [17] N. M. Chtchelkatchev and V. M. Vinokur, Nonequilibrium mesoscopic superconductors in a fluctuational regime, Europhys. Lett. 88, 407 (2009). [18] J. Hubbard, Electron correlations in narrow energy bands, Proc. R. Soc. Lond. A 276, 238 (1963). [19] G. Kotliar, E. Lange, and M. J. Rozenberg, Landau Theory of the Finite Temperature Mott Transition, Phys. Rev. Lett. 84, 5180 (2000). [20] M. J. Rozenberg, R. Chitra, and G. Kotliar, Finite temperature Mott transition in the Hubbard model in infinite dimensions, Phys. Rev. Lett. 83, 3498 (1999). [21] A. Hebard and M. A. Paalanen, Magnetic-field-tuned superconductor-insulator transition in two-dimensional films, Phys. Rev. Lett. 65, 927 (1990). [22] P. Limelette, A. Georges, D. J´erome, P. Wzietek, P. Metcalf, and J. M. Honig, Universality and Critical Behavior at the Mott Transition, Science 302, 89 (2003). [23] C. J. Lobb, D. W. Abraham, and M. Tinkham, Theoretical interpretation of resistive transition data from arrays of superconducting weak links, Phys. Rev. B 27, 150 (1983). [24] F. B. M¨uller-Allinger and A. C. Mota, Reentrance of the induced diamagnetism in gold-niobium proximity cylinders, Phys. Rev. B 62, R6120 (2000). [25] V. M. Vinokur, B. Khaykovich, E. Zeldov, M. Konczykowski, R. A. Doyle, P. H. Kes, Lindemann criterion and vortex-matter phase transitions in high-temperature superconductors, Physica C 295, 209 (1998).
8 [26] G. Blatter, M. V. Feigel’man, V. B. Geshkenbein, A. I. Larkin, and V. M. Vinokur, Vortices in high-temperature superconductors, Rev. Mod. Phys. 66, 1125 (1994). [27] T. Oka, R. Arita, and H. Aoki, Breakdown of a Mott insulator: a nonadiabatic tunneling mechanism, Phys. Rev. Lett. 91, 066406 (2003). [28] M. Eckstein, T. Oka, and P. Werner, Dielectric breakdown of Mott insulators in dynamical mean-field theory, Phys. Rev. Lett. 105, 146404 (2010). [29] V. Tripathi, A. Galda, H. Barman, and V. M. Vinokur, Paritytime symmetry-breaking mechanism of dynamic Mott transitions in dissipative systems, Phys. Rev. B 94, 041104 (R) (2016). [30] A. M. Dykhne, Adiabatic perturbation of discrete spectrum states JETP 14, 941 (1962). [31] C. M. Bender and S. Boettcher, Real Spectra in Non-Hermitian Hamiltonians Having PT Symmetry, Phys. Rev. Lett. 80, 5243 (1998). [32] N. M. Chtchelkatchev, A. A. Golubov, T. I. Baturina, and V. M. Vinokur, Stimulation of the Fluctuation Superconductivity by PT Symmetry, Phys. Rev. Lett. 109, 150405 (2012).
SUPPLEMENTARY MATERIALS Experimental methods
The device was fabricated on a SiO2 -covered Si substrate. The 40 nm thick gold square was patterned using photolithography and sputter deposition. On top of the Au film the square array of 270-by-270 Nb dots was deposited using standard e-beam lithography and DC sputtering. The Nb layer has a thickness of 45 nm. The dots have diameters of 142±5 nm, the center-to-center distance between two adjacent dots is 250 nm. On either side of the array a Nb crossbar was patterned to ensure that the current is injected homogeneously into the array. Figure S1 shows the temperature dependence of the resistance near the superconducting transition T c . Transport measurements were performed in a 3He/4He dilution refrigerator. Two sets of measurements were performed in the configuration where the magnetic field was perpendicular to the plane of the array. In the first set of measurements the V(I) curves were taken at a constant temperature and at a constant magnetic field. This was done for multiple values of the magnetic field (between 0 mT and 38 mT in 0.1 mT steps) and the temperature (between 70 mK and 1.27 K in 25 mK steps). This results in the data V(I, B, T ), from which the differential resistance was obtained by taking a numerical derivative with respect to the current. To carry out the detailed scaling analysis, the highresolution data were taken using the standard lock-in measurement technique with the AC excitation current 1 µA. The data presented in Fig. 2(b,d) and Fig. 6 a,c are taken at fixed temperature T = 1.0 K. The current and magnetic field were swept over the ranges from 43 µA to 57 µA (with 0.5 µA steps) and from 32.8 mT to 33.6 mT (with 5 µT steps), respectively. The data shown in Fig. 2(c,e) and Fig. 6(b,d) were collected at the fixed current I = 50.5 µA while the magnetic field was
FIG. 5. Superconducting transition. The superconducting transition temperature of the array, determined as the midpoint of the temperature resistance curve, is T c = 2.7 K, which is 6.6 K lower than that of bulk Nb (T c0 = 9.3 K)
swept from 32.8 mT to 33.6 mT with the step 5 µT and the temperature increased from 0.900 K to 1.095 K with the 5 mK steps. Differential resistance dV/dI and resistance R = V/I
Figure 6 juxtaposes the differential resistance dV/dI and resistance R = V/I as functions of filling factor f inferred from the same set of the current-voltage characteristics. Plots in the panels a and b reproduce Fig. 2(b,c) displaying the evolution of dV/dI upon increasing I (at constant T ) and T (at constant I), respectively. The dip to peak reversal at f = 1 signals the crossing of the dynamic Mott transition line. Panels c and d show that the corresponding resistances maintain pronounced dips at f = 1. As the measurements are carried out under constant currents, the plots for the resistances coincide up to the numerical factor, I 2 , with the plots for the dissipated power. Therefore, the dissipated power is minimal at f = 1. Scaling analysis at T = 0.75 K and I = 68.5 µA
Figure 7 shows scaling analysis around T = 0.75 K. The scaling exponents �I = 0.63 and �T = 0.67 are found, from which we conclude that � = 2/3. The measured data has the same stepsizes and resolution as the data around T = 1.0 K described above. This data supports the finding shown in Fig.4 of the main text.
9
FIG. 6. Vortex Mott insulator-to-metal transition. a,c Differential magnetoresistance dV/dI and resistance respectively, taken at different currents increasing from bottom to top as a function of the filling factor f in the vicinity of the commensurate value f = 1 at T = 1.0 K. b,d Differential resistance dV/dI and resistance R = V/I, respectively, taken at different temperatures increasing from bottom to top as a function of the filling factor f in the vicinity of the commensurate value f = 1 at I = 50.5 µA.
FIG. 7. Scaling analysis of the dynamic Mott transition around T = 0.75 K. a,b The log-log plots of [∂(dV/dI)/∂I]I0 and of [∂(dV/dI)/∂T ]T0 vs. b, both shown by symbols. The current driven data (a,c) is taken at T = 0.75 K with I0 = 67 µA. The thermally driven data (b,d) is taken at I = 68.5 µA with T 0 = 0.73 K. c, The semi-log plot of the differential magnetoresistances dV/dI after subtracting the separatrix dV/dI|I=I0 as function of the scaling variable |I − I0 |/b2/3 . The perfect collapse onto two generic scaling curves for I < I0 and I > I0 at �I = 2/3 evidences the critical behaviour of the current-driven vortex Mott transition. d, The semi-log plot of the differential magnetoresistances dV/dI after subtracting the separatrix dV/dI|T =T0 as function of the scaling variable |T − T 0 |/b2/3 . This illustrates the critical behaviour of the temperaturedriven crossing of the DMT transition line. e, The plots from panels c (blue symbols) and d (red symbols) perfectly collapse on top of each other upon rescaling the abscissa of the panel d by factor 1/r with r = 1.42 · 104 K/A. This value of r is close to the value of r = 1.5 · 104 K/A found around T = 1 K.
Mott transitions in a vortex lattice system
A vortex system in the presence of a finite current is equivalent to a 2D bosonic Coulomb gas in the presence of an
electric field. Vortices have a bare mass proportional to the
10 electrostatic charging energy Ec and the Coulomb interaction scale is determined by the Josephson energy E J . In the presence of a periodic potential generated by the proximity array (analogous to lattice matrix for charged bosons), the bare vortex mass transforms into the band mass, which, at commensurate fillings, can become considerably larger than the bare mass. The latter promotes vortex localization and the formation of a vortex Mott insulator. Careful numerical studies [1] of a 2D bosonic Coulomb gas (not on a lattice) show that the Mott transition takes place at r s ≈ 12, where r s is the ratio of intervortex separation and the vortex Bohr radius. To the best of our knowledge, there is no comparable study of the 2D bosonic Coulomb gas on the lattice. What has been studied in detail is a variety of bosonic Hubbard models on 2D lattices that exhibit Mottinsulator/superfluid transitions as a function of vortex chemical potential µ and hopping energy t measured in terms of the local repulsion U. Thus to be able to utilize a rich lore of the Hubbard model machinery and yet preserve the important features of the long-range vortex-vortex interaction, we adopt a Bose-Hubbard model with hard-core repulsion and finite nearest and next-nearest neighbour repulsive interactions (we call these V1 and V2 , respectively): X X X (b†i b j + h.c.) + V1 ni n j + V2 ni n j , (7) H = −t hi ji
hi ji
hhi jii
where ni = 0, 1. Here creates a boson at site i, ni = b†i bi is the boson number at site i. Such long-range interactions open the further possibility of spatial order of the bosons with or without underlying superfluidity. Tuning the magnetic field changes the vortex chemical potential as well as the intervortex interaction strength. This corresponds to the trajectory in the µ/V1 vs t/V1 phase diagram. The hard-core constraint makes the model equivalent to an XXZ antiferromagnet where t maps to J x /2 and V1 maps to Jz etc. Half-filling corresponds to the zero magnetization sector. The chemical potential is equivalent to the applied magnetic field B = (µ − zV1 /2). Detailed numerical studies are available for such a V1 − V2 hard core boson model on a square lattice [2]. Near fc = 1, the Mott insulating phase consists of one vortex per site, and the vortex Mott insulator - superfluid quantum phase transition is mean-field like (except perhaps at the tip of the Mott lobe). In this work, we have focused on this regime. Alongside with the magnetic field that acts as a chemical potential for vortices and, therefore, controls the vortex Mott transition by varying the relative strength of vortex kinetic and potential energies, another parameter that tunes the quantum vortex Mott transition, is the current I. The current for vortices plays therole of the electric field which induces the dynamic Mott transitions in electronic Mott insulators. b†i
Scaling analysis
Near the quantum critical point ( fc , I0 ) corresponding to the vortex Mott transition, the dynamic resistance dV/dI is ex-
pected to show the scaling behavior, ! T |I − I0 | dV p , = |δ| Φ . dI |δ|zν |b|�I
(8)
Here Φ is the universal scaling function depending on the universality class of the phase transition and not on the microscopic details of the model. The parameter δ = g−gc measures the distance from the quantum critical point gc in the parameter space and is itself a function of the parameters fc , I0 , ν is the scaling exponent for the length, and z is the dynamical scaling exponent. The exponent �I describes the relative scaling with respect to the current and the filling fraction respectively, p is the scaling exponent for the dynamic resistance, and b = f − fc . Before turning to estimates for �I , we discuss the effect of temperature on the Mott transition. For certain universality classes of quantum phase transitions, the scaling function Φ shows a singular behavior at finite temperatures T 0 ( fc , I), which corresponds to a classical phase transition. The transition temperature T 0 is a function of f and I and its scaling with these parameters is governed by the underlying quantum critical theory. Within a small range of temperature, current and filling such that |T − T 0 ( fc , I)|/T c � 1, the dynamic resistance will have a scaling form ! |T − T 0 | |T − T 0 | dV , . . . , ∼F , dI |b|�T |I − I0 |∆I
(9)
where �T and ∆I are scaling exponents corresponding to the finite temperature transition. Away from the quantum critical point where the relative scaling of the temperature and I − I0 may be nonanalytic, we use the Taylor expansion of the critical temperature T c ( fc , I) ≈ T c ( fc , I0 ) + (I − I0 )T c0 ( fc , I0 ) + . . . . Then, together with Eq. (9), we get the scaling function F (|I − I0 |/|b|�T ), and ∆I = 1. The exponent �T may be estimated as follows. In [4] the critical behaviour of the classical Mott transition in a half-filled Hubbard model has been studied in terms of the order parameter that corresponds to the fraction of doubly-occupied sites. The Coulomb correlation U can then be naturally regarded as a conjugate field that couples linearly to the order parameter. As a result, the order parameter scales as O ∼ (U − Uc )1/δT , where δT is the critical exponent associated with scaling of the order parameter with the conjugate field. On the other hand, as a function of temperature (or current), the order parameter behaves as O ∼ (T 0 − T )βT . Since |b| tunes the distance from fc and therefore the relative strength of the Mott repulsion, we posit that |b| ↔ |U − Uc |. It then follows that �T = 1/βT δT for the vortex Mott transition. Near fc = 1, the Mott transition is of the mean-field type, so we use δT = 3 and βT = 1/2 to arrive at �T = 2/3. This is remarkably consistent with our finite temperature and finite current data.
11 Dielectric breakdown in dissipative Mott insulators
The driving field promotes conduction in a dissipative gapped system in two ways: (i) through generation of free particle-hole pairs by the Landau-Zener mechanism while keeping the gap magnitude fixed, and (ii) by renormalization of the energy gap (mass) which affects the Landau-Zener tunneling probability. Consider an interacting quantum system in its ground state |0i separated from the lowest excited state |1i by the spectral gap ∆. If the driving field is applied adiabatically, the probability P = |h0|1i|2 ∼ e−2γ for the system to transit to the excited state is given by the Landau-Dykhne formula Z ∞ γ = Im dt [E1 (Ψ(t)) − E0 (Ψ(t))], (10) −∞
where Ψ denotes a time-dependent phase factor related to the driving field F, E0 is the ground state energy (parametrically dependent on Ψ) and E1 − E0 ≡ ∆. For an electron hopping along a constant electric field, we choose the gauge where the driving field is the time derivative of the vector potential, hence Ψ = Ft is the Aharanov-Bohm phase acquired for a nearest-neighbour hop. Then changing variables we replace the integral over time with the integral over complex Ψ = Ft ± iχ and deform contour in the complex Ψ-plane. The imaginary part of the integral over Ψ comes from the degeneracy point iχc in the complex Ψ-plane where the gap closes. Assuming no other singularities, we deform the Ψ contour to the imaginary axis and obtain Z χc 1 dχ0 [E1 (χ0 ) − E0 (χ0 )], (11) γ = Re F χ for the Landau-Zener tunnelling factor. In non-dissipative models, including in strongly-correlated models such as the half-filled Hubbard chain [5], Eq. (10) reduces to the wellknown Landau-Zener result γ ∼ ∆2 /vF ≡ Fth /F, where v = |d∆/dt|/F denotes the “velocity” of the mutual approach of the two levels as Ψ is varied, and is assumed to be a constant (i.e. independent of ∆) in the usual Landau-Zener analysis, and Fth is to be regarded as the threshold field for the LandauZener tunnelling. In the presence of dissipation, Fth = ∆2 /v is no longer valid and we need to directly look at Eq. (11). Note that the imaginary component of the vector potential, χ, vanishes in equilibrium conditions and also in the absence of dissipation. We assume χ to be a well-behaved function of the driving field F near the field-driven transition at Fc : χ(Fc ) = χc . It is evident from Eq. (11) that for the calculation of the Landau-Zener tunneling factor γ, it suffices to obtain the energy gap for a simpler auxiliary problem with a purely imaginary vector potential since the expression for Fth is entirely determined by an integral in the ImΨ direction. The resulting model is non-Hermitian and invariant under simultaneous parity (P) and time reversal (T ) operations [10]. For small values of the drive, the eigenvalues of the PT -symmetric models are real and the corresponding eigen-
functions are invariant under PT transformation. For driving fields exceeding the critical value, the spectral gap closes, the eigenvalues acquire finite imaginary parts, and the corresponding eigenfunctions break PT symmetry. More details on the connection between the dynamic Mott transition in dissipative systems and the loss of the PT symmetry are given in [10]. Dynamic vortex Mott transition near fc = 1 and PT symmetry breaking
We consider now the dynamic vortex Mott transition near the integer filling fc = 1, where the vortex Mott transition is described by an analysis of the nonrelativistic LandauGinzburg-Wilson effective action in Euclidean time, # " Z ∂ S = d2 x dτ Ψ† Ψ + D|∇Ψ|2 + m2 |Ψ|2 + u|Ψ|4 . (12) ∂τ Here Ψ is the vortex field, D the vortex stiffness, m and u are respectively the mass and interaction parameters that govern the mean-field transition. In mean-field theory, the “superfluid” phase of the vortices corresponds to m2 < 0. In the presence of the finite electric current, the magnus force on the vortices can be modeled by incorporating an external vector potential A x = It, Ay = 0. Approaching from the “normal” or Mott-insulating side of the vortex superfluid-Mott insulator transition, we consider the motion of a vortex in an isolated cell consisting of an Ohmic region bounded by a large superconducting region, which enables us to impose the simple boundary condition Ψ = 0 outside the Ohmic region. If motion in the Ohmic environment is overdamped, we may assume the time evolution is entirely governed by Brownian processes and neglect Berry phase effects (first term in Eq. (12)). We thus get an equation of motion (in real time) as ∂Ψ δH + ρ ∗ = 0, ∂t δΨ
(13)
h i R where H = d2 x D|∇Ψ|2 + m2 |Ψ|2 + u|Ψ|4 is the Hamiltonian corresponding to Eq. (12), and ρ represents viscous damping of the vortex motion and is phenomenologically proportional to the (charge) resistivity. Performing gauge transformation to turn the vector potential into the scalar one, we can recast Eq. (13) into the form ∂Ψ − i(I/ρ)xΨ = D∇2 Ψ − m2 Ψ − 2u|Ψ|2 Ψ . ∂t
(14)
For simplicity we ignore the nonlinear term and consider solutions of the form Ψ(x, y, t) = eiky y−λt u(x) with the boundary conditions Ψ = 0 in the square superconducting region surrounding an Au pad which leads us to consider the eigenvalue equation Du xx + i(I/ρ)xu = −(λ − m2 − ky2 )u.
(15)
12 We can associate a “Hamiltonian” H = − Du xx − i(I/ρ)xu with Eq. (15) which is evidently PT −symmetric. It is easy to see that tuning the current takes us through a PT symmetry breaking phase transition. When I → 0, the eigenvalues λ are evidently real, and as I → ∞, the eigenvalues λ ∼ ±iIa/ρ. The latter limit corresponds to merging of discrete energy levels since the real part of the eigenvalues has vanished. We rewrite Eq. (15) in terms of dimensionless variables ξ = x/a and E = (λ − m2 − ky2 )/ET , where ET = D/a2 is the Thouless energy: uξξ + i(Ia/ET ρ)u = −Eu.
(16)
The critical current I0 at which the eigenvalues of equations of the above form merge has been calculated earlier in the literature [8, 9]. Near this bifurcation point, the eigenvalues merge in the following manner: s r I 2 I0 − I , (17) E1 − E0 ≈ ET η 1 − 2 ∼ ET I0 I0 √ where η ≈ (π2 / 2)(I0 a/ET ρ). Equation (17) leads to the following scaling of the Landau-Zener tunneling factor: γ ∼ (I0 − I)3/2 .
(18)
It remains to relate the critical scaling of the Landau-Zener factor γ with the exponent �I in the universal scaling function F . In Eq. (11), from the form of the Landau-Zener factor, γ = Ith /I, we identify Ith as a barrier to the generation of free particle-hole pairs. Near the dynamic Mott transition, we propose that one should relate the potential energy loss associated with a nearest neighbour hop, Ith a ∼ (I0 − I)3/2 , with the Coulomb repulsion |h| ∼ |Uc − U| associated with the local correlation. We thus expect the scaling function to be homogeneous in |I0 − I|/|h|2/3 near fc = 1, and thus �I = 2/3. Relation of �I with critical exponents z and ν
vortex “charges”. The current-driven vortex Mott transition is associated with PT symmetry breaking. The idea of PT symmetry breaking is also relevant for dynamic Mott transitions in dissipative fermionic systems. We consider now a one-dimensional fermionic Hubbard model in the presence of a background current. As explained in the section about the dielectric-breakdown, in order to obtain the finite-field renormalization of the spectral gap, one should consider an auxiliary problem with the purely imaginary vector potential. This is equivalent to perturbing the equilibrium Hamiltonian H with the current operator J through the Lagrange multiplier [14, 15], H 0 = H − iλJ,
where λ is real. The model H 0 , while non-Hermitian, has PT −symmetry if H also has this symmetry, implying a real spectrum in some parameter range where the eigenstates do not breat PT −symmetry. In models with the charge conservation, for example the Hubbard model, the current operator also commutes with H and one can simultaneously diagonalize H and J. It is easy to see that the nonequilibrium transition is brought about by tuning λ. For small λ the presence of the spectral gap means that the expectation value of J (in the model H 0 ) vanishes. On the other hand, for very large values of λ, the eigenfunctions of H 0 are essentially those of J, and a gapless phase with carrying the finite steady current I becomes possible. The phase transition from the zero current carrying to the finite current carrying state thus takes place at the critical value λ = λc . Let us consider the following model for a half-filled fermionic Hubbard chain subjected to an imaginary gauge field χ: X X H 0 = −t [eχ c†iσ c jσ + e−χ c†jσ ciσ ] + U ni↑ ni↓ . (20) i
hi ji,σ
Rewriting the above Hamiltonian as X X ni↑ ni↓ H 0 = − t(cosh χ) [c†iσ c jσ + c†jσ ciσ ] + U hi ji,σ
From dimensional analysis, the threshold field for the dynamic Mott transition scales as Ith ∼ |δ|ν(z+1) ≡ |I0 − I|ν(z+1) , where ν and z refer to the quantum critical theory. Near the Mott transition, we compare as usual the potential energy change Ith a associated with a nearest-neighbour hop with the local correlation |h| and arrive at the scaling |I0 − I|/|h|1/ν(z+1) . For the non-relativistic mean-field case, we use ν = 1/2 and z = 2 and confirm �I = 1/ν(z + 1) = 2/3. PT −symmetry mechanism of the electric field-driven Mott transition in a dissipative fermionic Hubbard chain
In the discussion above for driven vortex systems, we argued that a “non-Hermitian” imaginary electric field term appears naturally in the presence of dissipation. The driving current in this case appears as an electric field acting on the
(19)
− i sinh(χ)J,
i
(21)
we can identify tanh(χ) with the Lagrange multiplier λ in Eq. (19) which describes a dissipative model with the current constraint. To solve Eq. (20), we utilize the coupled Bethe ansatz solutions presented in Ref. [16] for the charge and spin distribution functions ρ(k) and σ(λ): Z cos k ∞ 1 − dλ θ0 (sin k − λ)σ(λ), (22) ρ(k) = 2π 2π −∞ Z 1 σ(λ) = − dk θ0 (sin k − λ)ρ(k)+ 2π C ! Z ∞ 0 1 0 0 λ−λ dλ θ σ(λ0 ), (23) 4π −∞ 2 Z ∞ χ(b) = b − i dλ θ(λ + i sinh b)σ(λ). (24) −∞
13 Here θ(x) = −2 arctan(x/u), with u = U/4t, and for b < bcr = arcsinh(u), the contour C is chosen as a pathway in the complex k–plane consisting of the three line segments [16], −π + ib → −π → π → π + ib. At half-filling, the charge and R spin distributions satisfy the constraints C dk ρ(k) = 1 and R dλ σ(λ) = 1/2. To solve the coupled integral equations for ρ and λ, we take R the Fourier transform of Eqs. (22), (23) and obtain σ(λ) = dω/2π[J0 (ω)/2 cosh(ωu)]eiλω . The solution for σ(λ) is then used in Eq. (24) to find the relation between the imaginary gauge field χ and the imaginary part of the charge rapidity, b. We are particularly interested in the solution for b near the threshold value bcr . Let χcr be the imaginary gauge field corresponding to bcr in Eq. (24). Using our solution for σ(λ), and taking the derivative with respect to b in Eq. (24) we have dχ = 1 − π cosh(b) db
Z
∞ −∞
dω J0 (ω) −ω sinh(b)−|ω|u e . 2π cosh(ωu)
(25)
At bcr , it is easy to see that dχ/db = 0. Expanding the solution around b = bcr , we have dχ/db = 2C(b−bcr ), (C is a constant) which gives upon integrating, χcr − χ = C(b − bcr )2 .
(26)
The Mott gap is given by[17] ∆ = U − 2µ, where µ = E(N ↓, N ↑) − E(N ↓ −1, N ↑) .
(27)
At finite b, the Mott gap can be expressed as [16] " Z ∆(b) = 4t u − cosh(b) +
∞
−∞
# dω J1 (ω)eω sinh(b) . 2π ω(1 + 22u|ω| )
(28)
It is easily checked that ∆(bcr ) = 0, and near the threshold, ∆(b) = C 0 (bcr − b), where C 0 is a constant. Combining this
with the relation between χ and b we obtained in Eq. (26), we have finally √ ∆(χ) = A χcr − χ. (29) The above χ-dependent Mott gap can be further re-expressed in terms of the electric field by using the relation I = σF = tr(ρJ). For well-behaved I(χ), the same square root singular√ ity ∆(F) ∼ Fc − F is expected for the field dependence of the Mott gap. This leads to the exponent γ vanishing of the threshold field Fth as γ ∼ (Fc − F)3/2 near the field-induced transition. For stronger driving fields such that χ > χcr , the spectrum of the model becomes complex.
[1] W. R. Magro and D. M. Ceperley, Phys. Rev. Lett. 73, 826 (1994). [2] F. H`ebert, G. G. Batrouni, R. T. Scalettar, G. Schmid, M. Troyer, and A. Dorneich, Phys. Rev. B 65, 014513 (2001). [3] See for example S. Teitel and C. Jayaprakash, Phys. Rev. B 27, 598 (1983) for fully-frustrated 2D Josephson arrays at finite temperature. [4] G. Kotliar, E. Lange, and M. J. Rozenberg, Phys. Rev. Lett. 84, 5180 (2002). [5] Takashi Oka and Hideo Aoki, Phys. Rev. B 81, 033103 (2010). [6] N. Hatano and D. R. Nelson, Phys. Rev. Lett. 77, 570 (1996); N. Hatano and D. R. Nelson, Phys. Rev. B 56, 8651 (1997). [7] Giuseppe Albertini, Silvio Renato Dahmen and Birgit Wehefritz, J. Phys. A: Math. Gen. 29, L369 (1996). [8] J. Rubinstein, P. Sternberg, and Q. Ma, Phys. Rev. Lett. 99, 167003 (2007). [9] N. M. Chtchelkatchev, A. A. Golubov, T. I. Baturina, and V. M. Vinokur, Phys. Rev. Lett. 109, 150405 (2012). [10] V. Tripathi, A. Galda, H. Barman, V. M. Vinokur, Phys. Rev. B 94, 041104(R) (2016). [11] E. Br´ezin and D. J. Wallace, Phys. Rev. B 7, 1967 (1973). [12] A. Pelissetto and E. Vicari, Phys. Rep. 368, 549 (2002). [13] K. G. Klimenko, Z. Phys. C 54, 323-329 (1992). [14] T. Antal, Z. R´acz, and L. Sasv´ari, Phys. Rev. Lett. 78, 167 (1997). [15] John Cardy and Peter Suranyi, Nucl. Phys. B 565, 487 (2000). [16] T. Fukui and N. Kawakami, Phys. Rev. B 58, 16051 (1998). [17] E. H. Lieb and F. Y. Wu, Phys. Rev. Lett. 20, 1445 (1968).