Scaling Up an End-User Dependability Framework for Spreadsheets Tyler Creelan Marc Fisher II
[email protected] August 17, 2004
A technical report submitted to the School of Electrical Engineering and Computer Science Oregon State University
Technical Report# 04-60-09
Presented: August 17, 2004
Copyright (c) 2004 Tyler F. Creelan Permission is hereby granted, free of charge, to any person obtaining a copy of this document, to deal in the document without restriction, including the rights to copy, modify, publish, distribute, and/or sell copies, provided the above copyright notice is included in all copies.
2
Abstract The WYSIWYT (What You See is What You Test) methodology applies formal analysis and testing techniques to the spreadsheet paradigm. So far the methodology has been applied to a research spreadsheet prototype, Forms/3. However, this prototype lacks the mathematical libraries, referential functions, ranges, and macros of commercial spreadsheets like Excel and Lotus 1-2-3. Study subjects are also accustomed to the grid-like interface of commercial spreadsheet packages and many spreadsheets of interest are available in the Excel file format. This project addresses these areas by implementing WYSIWYT in Microsoft Excel and Gnumeric.
Contents 1 Introduction 1.1 Approaches to Improving Dependability 1.2 Problems of Scale . . . . . . . . . . . . . 1.2.1 Complexity . . . . . . . . . . . . 1.2.2 Correctness Decisions . . . . . . 1.2.3 Motivating Different Users . . . . 1.3 Solution . . . . . . . . . . . . . . . . . . 1.4 Organization of this Report . . . . . . . 2 Background and Related Work 2.1 Forms/3 . . . . . . . . . . . . . . . . . 2.2 WYSIWYT . . . . . . . . . . . . . . . 2.3 Regions . . . . . . . . . . . . . . . . . 2.4 Assertions . . . . . . . . . . . . . . . . 2.5 Microsoft Excel and Gnumeric . . . . 2.6 Definitions, Acronyms, Abbreviations
. . . . . . .
. . . . . . .
. . . . . . .
. . . . . . .
. . . . . . .
. . . . . . .
. . . . . . .
. . . . . . .
. . . . . . .
. . . . . . .
. . . . . . .
. . . . . . .
. . . . . . .
. . . . . . .
. . . . . . .
. . . . . . .
. . . . . . .
. . . . . . .
. . . . . . .
. . . . . . .
. . . . . . .
. . . . . . .
. . . . . . .
. . . . . . .
. . . . . . .
6 6 6 7 7 7 7 7
. . . . . .
. . . . . .
. . . . . .
. . . . . .
. . . . . .
. . . . . .
. . . . . .
. . . . . .
. . . . . .
. . . . . .
. . . . . .
. . . . . .
. . . . . .
. . . . . .
. . . . . .
. . . . . .
. . . . . .
. . . . . .
. . . . . .
. . . . . .
. . . . . .
. . . . . .
. . . . . .
. . . . . .
. . . . . .
8 8 8 9 9 10 10
3 System Requirements 3.1 Introduction . . . . . . . . . . . . . . . . . 3.1.1 Scope of the System . . . . . . . . 3.2 General Description . . . . . . . . . . . . 3.2.1 System Perspective . . . . . . . . . 3.2.2 System Environment . . . . . . . . 3.2.3 User Characteristics . . . . . . . . 3.2.4 General Constraints . . . . . . . . 3.2.5 Assumptions and Dependencies . . 3.3 Specific Requirements . . . . . . . . . . . 3.3.1 Environment . . . . . . . . . . . . 3.3.2 Features and Constraints by Layer 3.3.3 Performance . . . . . . . . . . . . 3.3.4 Extensibility/Maintenance . . . . . 3.3.5 Architecture . . . . . . . . . . . . 3.3.6 External Interfaces . . . . . . . . . 3.3.7 Internal Interfaces . . . . . . . . . 3.3.8 Development . . . . . . . . . . . . 3.3.9 Support . . . . . . . . . . . . . . .
. . . . . . . . . . . . . . . . . .
. . . . . . . . . . . . . . . . . .
. . . . . . . . . . . . . . . . . .
. . . . . . . . . . . . . . . . . .
. . . . . . . . . . . . . . . . . .
. . . . . . . . . . . . . . . . . .
. . . . . . . . . . . . . . . . . .
. . . . . . . . . . . . . . . . . .
. . . . . . . . . . . . . . . . . .
. . . . . . . . . . . . . . . . . .
. . . . . . . . . . . . . . . . . .
. . . . . . . . . . . . . . . . . .
. . . . . . . . . . . . . . . . . .
. . . . . . . . . . . . . . . . . .
. . . . . . . . . . . . . . . . . .
. . . . . . . . . . . . . . . . . .
. . . . . . . . . . . . . . . . . .
. . . . . . . . . . . . . . . . . .
. . . . . . . . . . . . . . . . . .
. . . . . . . . . . . . . . . . . .
. . . . . . . . . . . . . . . . . .
. . . . . . . . . . . . . . . . . .
. . . . . . . . . . . . . . . . . .
. . . . . . . . . . . . . . . . . .
12 12 12 12 12 12 12 13 13 13 13 14 16 16 17 17 17 17 18
. . . . . .
4 Plan of the Work 19 4.1 Initial Plan . . . . . . . . . . . . . . . . . . . . . . . . . . . . . . . . . . . . . . . . . 19 4.2 Revised Plan . . . . . . . . . . . . . . . . . . . . . . . . . . . . . . . . . . . . . . . . 19 5 Design 5.1 Overall Architecture 5.2 Frontend Design . . 5.3 Backend Design . . . 5.4 Communications . .
. . . .
. . . .
. . . .
. . . .
. . . .
. . . .
. . . .
. . . .
. . . .
. . . .
. . . . 2
. . . .
. . . .
. . . .
. . . .
. . . .
. . . .
. . . .
. . . .
. . . .
. . . .
. . . .
. . . .
. . . .
. . . .
. . . .
. . . .
. . . .
. . . .
. . . .
. . . .
. . . .
. . . .
. . . .
. . . .
. . . .
22 22 23 24 24
5.4.1 5.4.2 5.4.3 5.4.4
Communications Format Specification . . . . . . Excel-Specific Messages Validation . . . . . . . .
. . . .
. . . .
. . . .
. . . .
. . . .
. . . .
. . . .
. . . .
. . . .
. . . .
. . . .
. . . .
. . . .
. . . .
. . . .
. . . .
. . . .
. . . .
. . . .
. . . .
. . . .
. . . .
. . . .
. . . .
. . . .
. . . .
27 27 27 28
6 User Interface Design 6.1 Guidelines . . . . . . . . . . . . . . . . . . . 6.2 WYSIWYT User Interface . . . . . . . . . . 6.3 Regions User Interface . . . . . . . . . . . . 6.3.1 Region Borders . . . . . . . . . . . . 6.3.2 Discontiguous Regions . . . . . . . . 6.3.3 Modifying Regions . . . . . . . . . . 6.4 Progress Bar User Interface . . . . . . . . . 6.5 Fault Likelihood User Interface . . . . . . . 6.6 Test Case Generation (HMT) User Interface 6.7 Assertions User Interface . . . . . . . . . . . 6.8 Arrows User Interface . . . . . . . . . . . . 6.9 Explanations User Interface . . . . . . . . .
. . . . . . . . . . . .
. . . . . . . . . . . .
. . . . . . . . . . . .
. . . . . . . . . . . .
. . . . . . . . . . . .
. . . . . . . . . . . .
. . . . . . . . . . . .
. . . . . . . . . . . .
. . . . . . . . . . . .
. . . . . . . . . . . .
. . . . . . . . . . . .
. . . . . . . . . . . .
. . . . . . . . . . . .
. . . . . . . . . . . .
. . . . . . . . . . . .
. . . . . . . . . . . .
. . . . . . . . . . . .
. . . . . . . . . . . .
. . . . . . . . . . . .
. . . . . . . . . . . .
. . . . . . . . . . . .
. . . . . . . . . . . .
. . . . . . . . . . . .
29 29 30 31 31 32 32 33 33 33 35 36 38
. . . . . . . . . . . . . . . . . . . . . . .
39 39 39 39 40 40 40 42 43 43 43 43 44 45 46 46 46 47 47 48 48 49 49 49
7 Implementation 7.1 Communications . . . . . . . . . . 7.1.1 General Sockets . . . . . . . 7.1.2 Windows Sockets . . . . . . 7.1.3 MacOS X Sockets . . . . . 7.1.4 Message Processing . . . . . 7.2 Excel Formula Analysis . . . . . . 7.2.1 Lexical Analysis . . . . . . 7.2.2 Parsing . . . . . . . . . . . 7.2.3 Reference Conversions . . . 7.2.4 Evaluation Conversions . . 7.3 Testboxes . . . . . . . . . . . . . . 7.4 Request Evaluation . . . . . . . . . 7.5 Fault Localization . . . . . . . . . 7.6 Form-Level Indicators . . . . . . . 7.6.1 Testedness Overview . . . . 7.6.2 Fault Localization Overview 7.7 Arrows . . . . . . . . . . . . . . . . 7.8 Explanations . . . . . . . . . . . . 7.9 Transcripts . . . . . . . . . . . . . 7.10 Clean Up . . . . . . . . . . . . . . 7.11 Test Case Generation (HMT) . . . 7.12 Optimizations . . . . . . . . . . . . 7.13 Redesign Issues . . . . . . . . . . .
. . . .
. . . . . . . . . . . . . . . . . . . . . . .
. . . .
. . . . . . . . . . . . . . . . . . . . . . .
. . . .
. . . . . . . . . . . . . . . . . . . . . . .
3
. . . .
. . . . . . . . . . . . . . . . . . . . . . .
. . . . . . . . . . . . . . . . . . . . . . .
. . . . . . . . . . . . . . . . . . . . . . .
. . . . . . . . . . . . . . . . . . . . . . .
. . . . . . . . . . . . . . . . . . . . . . .
. . . . . . . . . . . . . . . . . . . . . . .
. . . . . . . . . . . . . . . . . . . . . . .
. . . . . . . . . . . . . . . . . . . . . . .
. . . . . . . . . . . . . . . . . . . . . . .
. . . . . . . . . . . . . . . . . . . . . . .
. . . . . . . . . . . . . . . . . . . . . . .
. . . . . . . . . . . . . . . . . . . . . . .
. . . . . . . . . . . . . . . . . . . . . . .
. . . . . . . . . . . . . . . . . . . . . . .
. . . . . . . . . . . . . . . . . . . . . . .
. . . . . . . . . . . . . . . . . . . . . . .
. . . . . . . . . . . . . . . . . . . . . . .
. . . . . . . . . . . . . . . . . . . . . . .
. . . . . . . . . . . . . . . . . . . . . . .
. . . . . . . . . . . . . . . . . . . . . . .
. . . . . . . . . . . . . . . . . . . . . . .
. . . . . . . . . . . . . . . . . . . . . . .
. . . . . . . . . . . . . . . . . . . . . . .
. . . . . . . . . . . . . . . . . . . . . . .
8 System Execution and Development 8.1 Execution and Installation . . . . . . 8.2 Version Control . . . . . . . . . . . . 8.3 Style Requirements . . . . . . . . . . 8.3.1 General . . . . . . . . . . . . 8.3.2 Visual Basic for Applications 8.3.3 Common Lisp and CLOS . .
. . . . . .
. . . . . .
. . . . . .
. . . . . .
. . . . . .
. . . . . .
. . . . . .
. . . . . .
. . . . . .
. . . . . .
. . . . . .
. . . . . .
. . . . . .
. . . . . .
. . . . . .
. . . . . .
. . . . . .
. . . . . .
. . . . . .
. . . . . .
. . . . . .
. . . . . .
. . . . . .
. . . . . .
. . . . . .
. . . . . .
. . . . . .
51 51 51 52 53 53 55
9 Gnumeric 9.1 Excel Shortcomings . . . . . . . . 9.1.1 Inflexible User Interface . 9.1.2 Difficult Native Language 9.1.3 Design Holes . . . . . . . 9.1.4 Testmeric . . . . . . . . . 9.2 Architecture . . . . . . . . . . . . 9.3 Implementation . . . . . . . . . . 9.3.1 Build System . . . . . . . 9.3.2 Library Communications 9.3.3 Execution . . . . . . . . . 9.4 Results . . . . . . . . . . . . . . .
. . . . . . . . . . .
. . . . . . . . . . .
. . . . . . . . . . .
. . . . . . . . . . .
. . . . . . . . . . .
. . . . . . . . . . .
. . . . . . . . . . .
. . . . . . . . . . .
. . . . . . . . . . .
. . . . . . . . . . .
. . . . . . . . . . .
. . . . . . . . . . .
. . . . . . . . . . .
. . . . . . . . . . .
. . . . . . . . . . .
. . . . . . . . . . .
. . . . . . . . . . .
. . . . . . . . . . .
. . . . . . . . . . .
. . . . . . . . . . .
. . . . . . . . . . .
. . . . . . . . . . .
. . . . . . . . . . .
. . . . . . . . . . .
. . . . . . . . . . .
. . . . . . . . . . .
. . . . . . . . . . .
57 57 57 57 57 58 58 59 59 59 59 60
. . . . . . . . . . .
. . . . . . . . . . .
10 Conclusions and Future Work
61
11 Appendix A: Excel Formula Grammars 11.1 An Excel Formula Grammar . . . . . . . . . . . . . . . . . . . . . . . . . . . . . . . . 11.2 Original Precedence Grammar . . . . . . . . . . . . . . . . . . . . . . . . . . . . . . . 11.3 Formula Lexemes as Regular Expressions . . . . . . . . . . . . . . . . . . . . . . . .
64 64 65 65
12 Appendix B: Communications Format 67 12.1 From Frontend to Backend Specification . . . . . . . . . . . . . . . . . . . . . . . . . 67 12.2 From Backend to Frontend Specification . . . . . . . . . . . . . . . . . . . . . . . . . 68
List of Figures 1 2 3 4 5 6 7 8 9 10 11 12 13
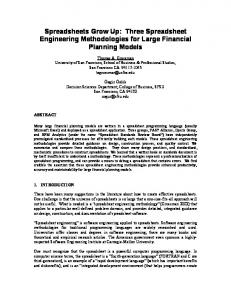
A cell relation graph. . . . . . . . . . . . . . . . . . . . . . . . . A diagram of interoperability requirements for the system. . . . The initial project plan. . . . . . . . . . . . . . . . . . . . . . . The revised project plan. . . . . . . . . . . . . . . . . . . . . . The overall Excel architecture. . . . . . . . . . . . . . . . . . . The Application hierarchy under ExcelForms. . . . . . . . . . . The Collection and OLEObject hierarchies under ExcelForms. . The displayable hierarchy under LispForms. . . . . . . . . . . . The GSearchable hierarchy under LispForms. . . . . . . . . . . A mockup of primary and paired testboxes. . . . . . . . . . . . A mockup of the user interface for Regions. . . . . . . . . . . . The testedness indicator originally used in Forms/3. . . . . . . A case of Fault Localization masking testedness. . . . . . . . .
4
. . . . . . . . . . . . .
. . . . . . . . . . . . .
. . . . . . . . . . . . .
. . . . . . . . . . . . .
. . . . . . . . . . . . .
. . . . . . . . . . . . .
. . . . . . . . . . . . .
. . . . . . . . . . . . .
. . . . . . . . . . . . .
. . . . . . . . . . . . .
. . . . . . . . . . . . .
. . . . . . . . . . . . .
8 17 20 21 22 23 24 25 26 31 32 33 33
14 15 16 17 18 19 20 21 22 23 24 25 26 27 28
A mockup of the Regions user interface with Fault Localization. . . . . . . . . A mockup of the Help Me Test (HMT) user interface. . . . . . . . . . . . . . . An example spreadsheet with all cells having assertions. . . . . . . . . . . . . . An example of the floating assertions toolbar. . . . . . . . . . . . . . . . . . . . A mockup of the curved inter-row arrows. . . . . . . . . . . . . . . . . . . . . . A mockup of arrows between subexpressions under formula view. . . . . . . . . An example of arrows between cells under non-formula view. . . . . . . . . . . An example of arrows sharing endpoints, with the reddest arrows on top. . . . Evaluation of predicates under Excel for tracing. . . . . . . . . . . . . . . . . . Use of toolbar buttons to implement a progress bar on the Windows platform. The Fault Localization overview bar. . . . . . . . . . . . . . . . . . . . . . . . . Arrows under WYSIWYT-XL. . . . . . . . . . . . . . . . . . . . . . . . . . . . The tooltip-based explanation system. . . . . . . . . . . . . . . . . . . . . . . . A diagram of the overall Testmeric architecture. . . . . . . . . . . . . . . . . . A screenshot of Testmeric. . . . . . . . . . . . . . . . . . . . . . . . . . . . . . .
. . . . . . . . . . . . . . .
. . . . . . . . . . . . . . .
. . . . . . . . . . . . . . .
34 34 36 36 37 37 37 38 45 46 47 47 48 58 60
. . . . . . .
. . . . . . .
. . . . . . .
10 14 30 42 42 44 58
List of Tables 1 2 3 4 5 6 7
Spreadsheet Package Candidates . . . . . . . . . . . . . . . . . . . . . The platform requirements for WYSIWYT-XL. . . . . . . . . . . . . . Formula and Value View . . . . . . . . . . . . . . . . . . . . . . . . . . Excel Formula Lexemes and Tokens . . . . . . . . . . . . . . . . . . . References Across Workbooks and Worksheets Are Scanned Specially . Excel Formula Conversions . . . . . . . . . . . . . . . . . . . . . . . . Use of VarType with Variant Function . . . . . . . . . . . . . . . . . .
. . . . . . .
. . . . . . .
. . . . . . .
. . . . . . .
. . . . . . .
List of Algorithms 1 2
Message Processing Algorithm . . . . . . . . . . . . . . . . . . . . . . . . . . . . . . 41 Importing and Exporting CodePanes . . . . . . . . . . . . . . . . . . . . . . . . . . . 52
5
1
Introduction
Traditionally, software has been created for users by professional programmers, using languages like C++, Fortran, or Java. End users, however, are increasingly creating some of their own software. Often this software is created using special frameworks, such as spreadsheet systems, email filtering rules, and sensor collection systems. The number of such end-user programmers within the US is expected to reach 55 million by 2005, dwarfing an expected 2.75 million professional programmers [8]. The programs these users create are used for such critical tasks as managing retirement funds, updating credit histories, and processing small business sales. Yet how dependable is the software created using such systems? One of the most popular systems is the spreadsheet, and although it is perceived as simple, spreadsheet-based programs frequently have faults. (Following standard terminology [4], a failure is an incorrect computational result, and a fault is the portion of a program causing a failure.) For example, of 54 field-audited spreadsheets, over 91% contained faults; in eleven trials of users creating spreadsheets, 60.8% contained faults; and in four experiments where participants inspected spreadsheets for faults, 55.8% of the faults were missed [24, 25]. End users also have unwarranted confidence in the correctness of their spreadsheets [23, 24]. The failures caused by faulty spreadsheets have consequences at both the household and national level. For example, an erroneous spreadsheet formula inflated the University of Toledo’s projected annual revenue by $2.4 million, requiring sudden budget cuts [33]. Another spreadsheet formula error caused the stocks of Shurgard Inc. to be devalued after two employees were overpaid by $700,000 [31]. And a cut-and-paste error in a bidding spreadsheet cost Transalta Corp. $24 million [13] through overbidding. As recommended by two NSF workshops [7], the dependability of spreadsheet programs is in need of serious improvement.
1.1
Approaches to Improving Dependability
In professional software engineering, approaches have been developed to ensure dependable, highquality software, such as Slicing [2] and Test-First Development [6]. These techniques must be applied carefully to spreadsheet programming, however. For example, spreadsheet users may be less interested in learning formal theory than professional programmers because it is not directly applicable to their everyday job. End users also rarely begin working with the well-defined specification that many methodologies may require, and many conventional validation tools are designed for running in batch over a completed program, rather than over incremental versions of a spreadsheet. Previous research shows it is possible for end users to use formalized approaches successfully under certain conditions. For example, Rothermel et al. [26] define a WYSIWYT (What You See is What You Test) methodology for testing spreadsheet-like languages, which is incremental, validation-driven, and distills testing theory into intuitive visual devices. Others have built upon this approach to provide spreadsheet assertions [10], automated generation of spreadsheet test cases [15], test reuse and regression [16], and fault localization [28]. All these approaches promise to bring the rigorous techniques of professional software engineering to spreadsheets.
1.2
Problems of Scale
WYSIWYT and associated approaches have only been investigated in academic settings, in the context of the research programming language Forms/3 [9]. It has not been shown whether their results will scale up to real-world problems and commercial spreadsheets. Doing so involves ad-
6
dressing three problems related to scale: complexity of feature space, correctness decisions, and motivation of different users. 1.2.1
Complexity
Previous efforts to improve spreadsheet correctness address only core features of the language paradigm, such as arithmetic operators. Commercial spreadsheet systems like Microsoft Excel, however, involve macros, external data sources, non-numeric data types, recursive formulas, and complex conditionals like SUMIF. Their condensed, massive, and grid-like interface are also wholly unlike the Forms/3 interface. A testing approach like WYSIWYT may not scale to such a larger feature space without loss of performance or user-centered characteristics. 1.2.2
Correctness Decisions
Decisions about a spreadsheet value’s correctness must be linked to which formula or spreadsheet action created the value. This must be decided even when the only model of how the system should work is carried mentally by the user. This linkage could be better adapted after observing users over time in a real-world setting. 1.2.3
Motivating Different Users
In practice, real-world spreadsheets attract users of different cultures and with vastly different motivations. For example, people may use spreadsheets to perform relatively trivial non-conditional programming, store data without any computation at all, or even solely to diagram or plot values. Each of these users may have different motivations or needs regarding the dependability of their programs.
1.3
Solution
To address these three problems of scale, in this project, WYSIWYT and underlying techniques have been embedded inside two commercial spreadsheet packages, Microsoft Excel and Gnumeric. This adaptation has advantages for spreadsheet users, who can perform tasks of maintenance and development on their own software, and researchers, who can study how to improve their algorithms within a user’s natural environment. Also, by working inside the framework of commercial spreadsheet packages, the researcher is freed from having to implement the spreadsheet system and associated computation engine. This makes WYSIWYT simpler, since low-level calculations can be performed outside the analysis engine, ensuring encapsulation. By reusing existing spreadsheet functionality, this approach also provides the system user a wider array of calculations than could be feasibly implemented by the researcher.
1.4
Organization of this Report
The remainder of this report provides background material (Section 2), a requirements document for the system (Section 3), a plan of the work (Section 4), design decisions in general and for the user interface (Sections 5, 6), implementation details (Section 7), directions on execution and development (Section 8), details on the implementation under Gnumeric (Section 9), and concluding remarks (Section 10). Grammars and other specifications are included as appendices (Sections 11,12).
7
16:E
19:E
17:constant
20: Mon + Tues + Wed + Thurs + Fri
18:X
21:X
PayRate
TotalHours
22:E 23: if TotalHours CellCRGNode MatrixPlainCell -> EltCRGNode XLCell -> xlEltCRGNode Region -> RgnCRGNode xlRegion -> xlRgnCRGNode
5.4
Communications
To promote modularity and reuse of existing code, the system requirements stipulate abstraction of the system’s analytical engine from the spreadsheet system itself. This requirement arises from the desire to reuse the same analytical functions used in the Lisp-based Forms/3 system. To fulfill this requirement, the system is physically and conceptually decomposed into a frontend and backend, tied together using a special communications format.
24
Figure 8: The displayable hierarchy under LispForms.
25
Figure 9: The GSearchable hierarchy under LispForms.
26
5.4.1
Communications Format
The communication scheme employed between JavaForms and the Lisp-based Forms/3 engine consists of evaluable S-expressions. This format is used again for Excel because it is easily analyzed under the Lisp engine. XML was also considered as a format, since it could enable simple translation of messages, has free parsers available, and would make transcripts externally portable. It was not clear however if XML would be useful in a small locally-coupled system where the communications format was well known in advance, and it might introduce additional network overhead. Furthermore, adapting Forms/3 to send XML might be difficult since the logic to format messages is not entirely centralized. 5.4.2
Specification
The communications format used between the engine and Frontend of the system is described below. The format syntax is useful when constructing a lexical analyzer, and the list of symbols describes the syntax of the communications language. A complete specification of message syntax is listed in Section 12. MESSAGE -> (DIRECTIVE ARGUMENTS) | (DIRECTIVE) ARGUMENTS -> ATOM ARGUMENTS | ATOM ATOM -> NUMBER | STRING | SYMBOL | LIST LIST -> ’(ARGUMENTS) STRING -> ".*" SYMBOL -> [A-Za-z][A-Za-z0-9_\-\?]* NUMBER -> [\+\-]?[0-9]*\.?[0-9]+ 5.4.3
Excel-Specific Messages
To support Excel, the following messages were added to the system, listed below by keyword. See Section 12 for a description of other messages. Make-Workbook-From-List This is the message used first by the system when a workbook is loaded by the user. It contains the name of the workbook, followed by each worksheet, and for each worksheet the used range of the worksheet and the row, column, formula, and value of each cell. Gui-Update-Workbook This message is sent when the user initiates a change on the workbook. Under Excel this is caused by the Worksheet Change event. For convenience, both the formulas of cells which changed and the values of their dependents are sent. NameRegion This message identifies to the frontend how cells are grouped into regions. Request-Evaluation This message gives an arbitrary expression to the frontend for evaluation, as described in Section 7.4. Return-Evaluation This message returns the result of a request-evaluation call.
27
5.4.4
Validation
Implementation of a Gnumeric-based frontend (Section 9) and a Java-based backend [14] afforded an opportunity to check the communications design for implementation-specific features. Under Gnumeric, the only changes needed to message formats was to introduce additional functionality for parsing and sending A1-formatted messages, since Gnumeric did not support R1C1 format. Under the Java-based system, messages related to the authentication subsystem were discarded, but other specifications were implemented without incident. Although rooted in message calls to Lisp, the scheme has been successfully extended to new languages and spreadsheet systems.
28
6
User Interface Design
This section outlines overall user interface guidelines (Section 6.1) and the user interface for WYSIWYT (Section 6.2), Regions (Section 6.3), Explanations (Section 6.9), and Arrows (Section 6.8). Where practical, this section focuses on behavior and appearance rather than implementation, although known programmability shortcomings of Excel are addressed.
6.1
Guidelines
A set of overall goals for the design of the user interface were put together for designers and implementors. The general goal is to design the project UI using established empirical results [26]. 1. Generally, interfaces must conform to these guidelines: (a) The viability of the interface for empirical studies must be preserved. (b) System interfaces should not interfere with a user’s expectation of Excel’s behavior. (c) The UI system shall not perform reasoning about testedness; this should be done in the Engine instead. (d) The UI system shall be frugal in its use of screen space. 2. UI devices must be careful about how they solicit the attention of the user, as follows: (a) UI devices should use a negotiated rather than an immediate style of interruptions. (b) UI devices should avoid modal interaction. (c) Generally devices should not make high demands on the user’s attention. (d) UI elements must avoid putting “water in the beer”, that is, diluting features of interest with trivia. (e) The cost of a UI device must not exceed its benefit. For example, activating a feature should not require the user to dig through multiple ancillary dialog boxes. 3. UI elements are expected to maintain specific response characteristics: (a) The system shall be fast; actions must result in immediate response. (b) The system shall be live, with displays being updated immediately. With respect to spreadsheets, live refers to Tanimoto’s third level of liveness, when incremental semantic feedback is automatically provided whenever the user performs an incremental program edit, and all affected on-screen values are automatically redisplayed [36]. (c) The system shall “tell no lies”; out of date information must not be retained. (d) UI elements shall be displayed statically when possible. (e) Dynamic displays must have high benefit to justify their use in the system. Conflicts between these high-level goals will probably arise during system design and implementation. The recommendation in this case is to discuss conflicts with the UI design group, to ensure a consistent UI policy. Resolving conflicts in an ad hoc manner should be avoided, to prevent the UI from becoming fragmentary and inconsistent.
29
Value View 3 5.14
Excel Formula View = A1 * 6.02 = PI() + 2
WYSIWYT Formula View 3 = A1 * 6.02 3.14 = PI() + 2
Table 3: Formula and Value View
6.2
WYSIWYT User Interface
Features related directly to WYSIWYT’s visual feedback are testboxes, cell border colors, and the testedness progress bar. The design of the testedness toolbar is summarized in Section 7.6.1 along with the Fault Likelihood Overview Bar. The overall WYSIWYT system will be triggered by a toolbar button, added to the auditing, review, or validation toolbars as appropriate. The system may also include a facility for more easily changing the name of a cell, for example via a drop-down menu, or textbox tag. Testedness cell-border colors are displayed using the bottom and rightmost borders of each cell, as shown in Figure 10. Only two of the borders are engaged because borders of cells under Excel are shared and using all four would overwrite the borders of other cells. Although complete borders are still desirable, this half-border approach is cogent, especially when supplemented with coloring of testboxes. Testbox color is depicted in Figure 10 (gray or black in a printed copy). Testboxes shall be placed at the leftmost side of each cell, to complement the default rightalignment of cell numbers and formulas. Testboxes shall be faded 50% to remain “demure” and avoid overwhelming the user, and share the color of the border, adding impact to the “testedness” UI element as well and compensating for the missing two borders. Ideally the testboxes should adjust themselves upon left-alignment of the cell contents. Care must be taken for question marks, minus signs, plus signs, and circles to appear correctly in the testbox. Under various fonts and configurations, these can be misaligned, whereas others may be too “busy” or visually heavy. If necessary, a custom checkbox character may be created from scratch. Other possibilities include a grayed-out checkbox, an angular, simplified question mark, and shading of the checkbox. Note the latter seems to have a special nuance already under Windows. To promote equality of testedness and fault likelihood while minimizing extra UI devices, a paired approach is used for testboxes. Under this approach, each referential cell in the spreadsheet contains a single, primary testbox by default. Clicking on the primary testbox causes two paired testboxes to appear, shown in cell D10 of Figure 10. These paired testboxes display an X and check mark respectively. After clicking on one of these boxes, the paired testbox reverts to a primary, single box, shown in cell D8. The paired testbox approach differs from Forms/3, where fault likelihood and testedness interaction is distinguished by left and right clicking on the testboxes. The change was made for the following reasons: 1. The distinction between left and right clicking can be confusing. 2. Right-clicking is often used for contextual popups under Excel. 3. For AutoShape objects, right-clicking selects the object and cannot be captured, prohibiting the design of testboxes and causing inconsistencies if other objects are implemented as AutoShapes. 4. Standard Apple mice do not have a right-click button, limiting portability or causing changes to directions to control-click. 30
Figure 10: A mockup of primary and paired testboxes. Finally, formulas under WYSIWYT should be shown as equations instead of partial computations. For example, an Excel formula is conventionally shown as = bX + cX, but should appear as a = bX + cX under WYSIWYT. This could be supported via a Value view and Formula view, shown in Table 3. This way users can observe both the formula and value at the same time, rather than toggling between them. This view also makes experiments under the system more comparable to those under Forms/3.
6.3
Regions User Interface
As described in Section 2.3, Regions are the grouping of cells into clusters to aid in both algorithmic efficiency and in ease of testing [11]. This section describes how interfaces relating to regions must appear and behave. Contiguous regions are assumed in most cases. 6.3.1
Region Borders
For contiguous regions, there will be a single testedness border encompassing the entire region, as in JavaForms. The border must be a bit thicker than the regular testedness border. The individual cells in the region will not have their own testedness borders. A sample region border is shown at the bottom of cells B4 to D4 in Figure 11. Region borders will be subject to the following properties as well: 1. Regions will not be identified by name, because names do not seem useful and may be inconsistent with other names. 2. The system will support the user’s ability to break up a region from the inferred region when a region inference mechanism is wrong. A method for the user to indicate regions to be modified must be provided. 3. Editing order does not matter: if the user adds a neighboring cell that would have been part of the region if it had been there before, it becomes part of the region now.
31
Figure 11: A mockup of the user interface for Regions. 6.3.2
Discontiguous Regions
The system shall be flexible enough to support discontiguous regions, but need not actually implement them, because it is not clear whether discontiguous regions will actually be used. Discontiguous regions will have the following properties as well: 1. The discontiguous pieces of the same region theoretically have a shared boundary. For example, they all share the same color. 2. The pieces are connected with a black line with a dot on either end, from the bottom right of one piece to the top left corner of another, as shown in column B of Figure 11. The direction of the line is determined either spatially or from reading order. 3. The connector line should be more transparent if the region is not one that has a cell in it selected. If we cannot support the same transparency for arrows in unselected cells, however, connector lines must not be transparent. 4. It should be possible for connector lines to be enabled or disabled in the same way as arrows are enabled or disabled. The default setting must be on if WYSIWYT is enabled. 6.3.3
Modifying Regions
Modification of regions would be targeted towards region-experienced users; hence, it does not have to be comfortable for first-time users. Both splitting and recombination must be supported if modification is supported. Furthermore, modifications must not be so easy that it is likely to be done accidentally. Modification may be done by selecting a region connector, then selecting a separate “Modify” button from the toolbar. Within a contiguous region, the user would have to select the desired break-off piece and go to the toolbar to find the button. 32
Figure 12: The testedness indicator originally used in Forms/3.
Figure 13: A case of Fault Localization masking testedness.
6.4
Progress Bar User Interface
The percent testedness indicator has been shown to exert a strong motivational influence on study subjects and is important to preserve in WYSIWYT-XL. Under JavaForms it is implemented as a bar of changing color, as shown in Figure 12. However it is difficult to implement this in a less programmable environment like Excel. One approach is to chain together individual toolbar buttons to form the indicator. Unfortunately this toolbar lacks a continuous bar-like appearance (see Figure 23 on page 46). Design tradeoffs in the implementation of the indicator are described in Section 7.6.1.
6.5
Fault Likelihood User Interface
Fault Localization isolates spreadsheet faults to certain cells [28], and requires interfaces to indicate suspect cells, and denote cells as wrong. Additionally, fault localization over regions (Section 2.3) may require a special interface. To trigger fault localization, users will enable the paired testbox over a cell as described in Section 6.2. The user will then mark the cell’s value as incorrect by selecting the right mark of the paired testbox. To unmark the cell, the user clicks once upon the primary testbox, just as a cell is unchecked. The fault localization technique shall shade the interiors of suspect cells, but not change the cell borders. Care should be taken so testedness colors are not inundated by interior colors, as shown in Figure 13. When used with regions, the fault localization can be used conventionally, or optionally distilled into touched cells and untouched cells (Figure 14). The fault localization convention of coloring the background of each cell has the drawback of overwhelming users with too many changes (“too much red”). Additionally, using red to signal a high fault likelihood conflicts with the use of red to indicate testedness. Also, by necessity, the shading method may overwrite a user’s custom cell shading, or interiors shaded by Excel. The system should be flexible enough to permit addressing these drawbacks in the future.
6.6
Test Case Generation (HMT) User Interface
Automated generation of spreadsheet test cases is called Help Me Test (HMT) under Forms/3. It requires interface devices for activation, selecting an area of interest, highlighting changed in-
33
Figure 14: A mockup of the Regions user interface with Fault Localization.
Figure 15: A mockup of the Help Me Test (HMT) user interface. puts, and highlighting generated cases. Additionally, at certain timepoints user interaction on the spreadsheet must be frozen. HMT will be activated through a toolbar button, and support indicating an “area of interest” as follows: if nothing is selected, the entire active spreadsheet is considered the area of interest and a test case will be generated that increases the testedness of the spreadsheet. Alternatively, if some combination of arrows or cells are selected, then these are considered the area of interest, and a test case will be generated that increases the testedness of one of these arrows or cells. These two tasks must be implemented via separate buttons under Excel, since in Excel there is no easy way to not have at least one cell selected. Selection of arrows (Section 6.8) for HMT need not be implemented, since it may be difficult to limit user interactions with arrows if users are allowed to select them at all. Under JavaForms, changed input cells are indicated by thickening their borders. This is a problem in Excel because the system already uses different thicknesses of borders to indicate various regions to the user (Section 6.3) and input cells do not have borders. Instead the font of the changed inputs should be emboldened or changed to a different color, as shown in Figure 15. Green would be a possible color as it has no special meaning elsewhere in the system. After HMT has been performed, cells containing fresh question marks must be signaled specially. Under JavaForms this was done using thicker borders, but this device is already in use for regions. An alternate approach could be to use the font value of the cell or decrease the checkbox
34
transparency. Alternately, the decision box border could be thickened. Thickening also draws the user’s attention to the decision box itself, encouraging them to test the fresh value. HMT also requires freezing interaction with the spreadsheet during updates. In Excel (and Windows and MacOS in general) there are two ways that are generally used to prevent the user from interacting with an application. One is the use of the busy mouse cursor, depicted as an hourglass on Windows, a watch on MacOS 9 and earlier, and a pinwheel on MacOS X. This device may be unsuitable however, because it indicates there are no actions the user can perform, yet users are able to optionally cancel HMT and resume work. The second convention is to display a modal dialog box, which could have a cancel button. The dialog box approach in JavaForms was discarded primarily because it could get lost, since X Windows does not support modality. This is not a problem with Excel, because Windows and MacOS will enforce the ordering of the dialog box over the spreadsheet. The display for all of the cells shall be updated continuously as new values are tried. This updating should only be limited for performance reasons. In that case, current updates could be described in a status bar or in an interactive dialog box.
6.7
Assertions User Interface
To help the user create specifications and guards for a spreadsheet, the system supports creation of static and dynamic assertions on each spreadsheet cell (Section 2.4). Supporting this system under Excel would require introducing the following required and optional user interface devices: 1. Value violations must be displayed, for example with red ovals over a value. 2. Assertion sources must be displayed and sometimes made editable by the user. 3. Assertion conflicts must be displayed, for example with a triangle in the top left of the cell, a red circle, or an icon on an assertion toolbar. 4. Placing assertions on input and formula cells must be supported. 5. Cells and other assertion interfaces should be spatially tied. 6. Assertion editing should be closely tied to formula editing. 7. Assertion interfaces should be easy to show or hide, through a button on the WYSIWYT toolbar. 8. Assertions should be visible alongside values and formulas. 9. Assertion conflicts should be signaled to the user even when the assertions themselves are not visible. 10. The user should be able to view and edit multiple assertions at once on various cells. Assertions will be placed on cells by clicking on a global assertions toolbar. Assertion conflicts may be signaled with a triangle in the top left of the cell (Figure 16). Once a cell contains assertions, it will contain a semi-transparent gray shield icon “embedded” in its middle (Figure 17). This approach is similar to the floating shield icon under Forms/3, and visually indicates which cells contain assertions.
35
Figure 16: An example spreadsheet with all cells having assertions.
Figure 17: An example of the floating assertions toolbar. Ideally, if a cell has assertions placed on it, then selecting the cell would pop up a floating assertions toolbar. This toolbar may be implemented using a VBA form or a comment box. If a floating toolbar proves too difficult to implement, then the assertions can be listed in a global assertions toolbar. The latter is less desirable however because it has no spatial tie to the cell.
6.8
Arrows User Interface
The system must display arrows to draw attention to untested portions of the spreadsheet and indicate which du-associations are validated. This association should be shown at both the granularity of cells (arrows between cells) and sub-expressions. Arrows must have certain properties, require interface devices for local and global triggering, and must be displayed specially under certain circumstances. Described below are the specific properties arrows must have: 1. An arrow must be drawn from source cells to destination cells. 2. If formulas are displayed, the arrow must be clearly drawn from affecting subexpression to affected subexpression. 3. Arrows must reflect du-associations at both the cell and sub-expression levels. 4. The user must be able to hide individual arrows. 5. The user must be able to show and hide all arrows for a spreadsheet. 6. The device to trigger arrows for a particular cell should be tied to that cell, and likewise of individual arrows. 7. Arrows should not obstruct values of source or destination cells.
36
Figure 18: A mockup of the curved inter-row arrows.
Figure 19: A mockup of arrows between subexpressions under formula view. Arrows shall be displayed starting and ending at the leftmost end of each cell. If the arrow points to cells in the same row or column, then the arrow shall be curved so the tip of the curve is at the arrow’s midpoint and halfway up the preceding row, as shown in Figure 18. This approach avoids obstructing values of source and destination cells. If formulas are displayed, the arrow should be clearly drawn from the affecting subexpression to the affected subexpression, as shown in Figure 19, unless the cell is an input cell (Figure 20). Additionally, a bracketed box must appear above individual subexpressions, outlining the subexpressions to which arrows point. Again, arrows are curved if source and destination cells are in the same row. The top of arrows from one cell to another may share the same pixels where necessary. Also arrows may share the same “bus” or connection point from another cell. The reddest arrows must be topmost in any clustering of arrows, as shown in Figure 21. Under JavaForms, arrows were hidden or shown by middle-clicking the mouse button, but this was an action some users seemed unused to. Also, there is no middle-click on a standard Macintosh or PC mouse. Instead, arrow activation will be done via a hotkey or menubar button. There does not seem to be a mechanism for getting a “click and hold” under Excel, though this might be ideal in other environments. Regions pose a special problem for arrows, since arrows can be drawn to indicate a many-tomany relationship. For contiguous regions, a single or bunched “wiry” arrow may be employed. In general, however, the simple approach of continuing to draw arrows between cells is sufficient.
Figure 20: An example of arrows between cells under non-formula view.
37
Figure 21: An example of arrows sharing endpoints, with the reddest arrows on top.
6.9
Explanations User Interface
Explanations shall be performed under WYSIWYT-XL via tooltips. These tooltips will appear when the user hovers his or her mouse over a cell for a certain number of seconds, and disappear when the mouse is moved away. The tooltip should resemble standard Windows tooltips if possible. Due to practical limitations under Excel, the tooltip may be removed if the mouse moves at all. Multi-level tooltips should be employed for longer explanations.
38
7
Implementation
This section describes how the system was implemented, based on requirements and design. Drawbacks of the implementation and workarounds are presented. When the design could not be implemented as initially designed, alternate approaches are described.
7.1
Communications
Since the system is designed as a client-server architecture (Section 3.3.7), implementation of the communications subsystem was requisite to begin. Correctness at this lowest layer of the system was also important for robustness and to ensure flexibility when deploying the system across multiple platforms. 7.1.1
General Sockets
As the target system is client-server and network-based, a major task of the project was to find a reliable means by which to write and read sockets under Excel VBA, a language designed for relatively simple spreadsheet manipulation. This socket functionality is necessarily platform-specific, although the system uses the same events and scheduling independent of the underlying socket. This is achieved via a Socket module, which provides basic socket-related client functionality such as sending messages and connecting to the remote host. This Socket module contains a CSocket or MacOS library, depending on which platform the system is built on. The implementation of each networking subsystem is described below. 7.1.2
Windows Sockets
One option for networking under Windows was Winsock, a socket library distributed with the Visual Basic 6 runtime. Using this library, however, required installing and registering the ActiveX control mswinsck.ocx on each machine where the system would be run. Since registering the control requires super-user privileges, this requirement proved burdensome when installing the prototype on systems where obtaining super-user privileges is difficult, such as university computer labs. Linking the system to the Winsock control also required a Visual Basic 6.0 license on the machine where the linking occurred. This requirement conflicted with the design of the version control system since to accommodate multiple developers, VBA modules had to be combined into an Excel VBA Addin dynamically from version control (Section 8.2). If the system required linking to Winsock on the fly, then the bundling could only be performed by developers on machines with VB6 installed. This problem was worked around by retaining a base spreadsheet with Winsock linked, and adding modules to it dynamically to create a second working spreadsheet. This editing requirement caused confusion, however, because sometimes developers were uncertain which copy of the Socket module should be edited. Developers were prone to directly editing the secondary copy and losing their modifications when the secondary copy was recreated from the base copy. A second option for networking under Windows was the IP*Works! control, available from /N software [34]. This control runs as a separate thread on Windows, precluding the problems with Winsock involving interference from MsgBox and other procedures that halted Visual Basic. Although reasonably priced, the license for this product did not seem suitable for the system since it prohibited multiple developers. Socket access was achieved under Windows with the freeware CSocket library [18]. This library uses the Declare keyword of VBA to create C to VBA wrappers on the ws2_32.dll networking
39
library. CSocket is conveniently designed to resemble Winsock, so few changes were necessary to adapt the system from Winsock to CSocket. Several changes were made to CSocket to make it function under VBA, such as setting the running application to Office instead of a Visual Basic application. Although CSocket avoids the memory leaks and inflexibility of the built-in Winsock, it has other robustness issues. Unlike Winsock, the CSocket wrapper generates events by retaining a pointer to the window used by the running application. This triggering is tricky and requires accessing Excel at a very low level, promoting instability. For example, clicking the “Stop Macro” button under Excel with CSocket enabled causes Excel to crash with a general protection fault. This problem can also cause developers to lose their changes if the changes cause the socket to be terminated unexpectedly. Similarly, users of the system could potentially lose their spreadsheet work if they press the stop macro button. Since Excel VBA is a single-threaded application, both CSocket and Winsock are incompatible with methods which could cause Excel to stall or sleep. For example, MsgBox, a function commonly used to pop up a dialog box, causes Excel to block until the box is dismissed. While Excel is blocking, messages transmitted to Excel are ignored, causing inconsistencies in the system. 7.1.3
MacOS X Sockets
Under MacOS X, socket communications were implemented using AppleScript and a separate Java application, ExcelSocket, which used the Cocoa framework. ExcelSocket used standard TCP/IP sockets to connect to the backend, and AppleScript to communicate between the ExcelSocket application and VBA under Excel. 7.1.4
Message Processing
According to the Communications Specification of Section 5.4.2, each incoming message is delimited by two parentheses in a format resembling a Lisp S-expression. Under ExcelForms, a special module MesgParser was created to process and unpack these messages. The messages can contain nested lists, strings, and numbers, as shown in Figure 5.4.2. Therefore before delegation of messages inside the system, the incoming data stream is broken up into messages, each of which is composed of tokens of four types: string, list, value and symbol. Because the data stream may terminate before a complete message has been entered, the parsing system needs to retain any previous incomplete messages and append these to the current input string. The method used for the parser is listed in Algorithm 1. VBA does not provide a built-in regular expression scanner, but it does provide a basic glob2 like pattern matching mechanism, called Like. This was used to identify tokens of type value, and numbers in ratio format. Because VBA does not have a built-in ratio format, these values were approximated by the parser using basic division. Special care was taken to detect nested strings.
7.2
Excel Formula Analysis
Since we do not have access to the interior data structures Excel uses to store cell formulas, the formulas must be scanned and parsed by the system. For efficiency, compatibility, and ease of implementation, this is performed on the Lisp-based backend, by sending each cell’s formula to the backend as a simple string. The chief goal of this conversion is to recognize references and 2
Globbing is the expansion of wildcards such as * and ?, usually to match filenames.
40
Algorithm 1 Message Processing Algorithm Require: length(msg) > 1 msg ← input(socket) for i = 1 to length(msg) do nextChar ← msg[i] if nextChar = “doublequote” then 5: if isString and not msg[i - 1] = “backslash” then isString ← F ALSE else isString ← T RU E end if 10: end if if isString then continue end if if nextChar = “leftparen” then 15: parenSum ← parenSum − 1 if parenSum = 0 then token ← msg[tokStart, i] queue ← queue + token else if parenSum = 1 then 20: isList ← F ALSE end if else if nextChar = “rightparen” then isList ← T RU E parenSum ← parenSum + 1 25: else if nextChar = ’ ’ and not isList then token ← msg[tokStart, i] queue ← queue + token tokStart ← i + 1 end if 30: end for
41
Token id string sstring addr addr colrow dec flt
Sample Lexemes grades01 “Jane Doe” ’My Grades’ R[-1]C R1C2 R1 -343 -343.43E-04
Extended Regular Expression [[:alnum:]] "(\"|[^"])+" ’[\^’]+’ R(\[(-)?[1-9]+\])?C(\[(-)?[1-9]+\])? R[0-9]+C[0-9]+ (R|C)[(-)?[1-9]+] [+-]?[0-9]+([.][0-9]+)? [+-]+[0-9]+([.][0-9]+)?(E[+-][0-9])?
Informal Description Alphanumeric Double-quoted string Single-quoted string Relative ref Absolute ref Column or row ref Decimal or Integer Exponential
Table 4: Excel Formula Lexemes and Tokens Sample Input Sheet1!R1C1 ’She et1’!R1C1 [Book1.xls]Sheet1!R1C1 ’[Book 1.xls]Sheet1’!R1C1 Book1.xls!TESTT ’Book 1.xls’!TESTT
Scanned Output (id Sheet1) ! (addr..) (sstring "She et1") ! (addr..) [ (id Book1.xls) ] (id Sheet1) ! (addr..) [ (sstring "Book 1.xls") ] (sstring "Sheet1") ! (addr..) (id Book1.xls) ! (id TESTT) (sstring "Book 1.xls") ! (id TESTT)
Table 5: References Across Workbooks and Worksheets Are Scanned Specially conditional expressions inside the formula, although the system supports limited evaluation of the formulas if necessary. Unlike in a conventional scanner or parser, little error-checking needed to be done on the formulas because the editor under Excel only accepts certain inputs. Therefore syntax errors in the formula do not raise an error visible to the user. 7.2.1
Lexical Analysis
For simplicity in the parser, the formulas are first split into lexemes identified by tokens, using lexical analysis [3]. Lexical analysis of the formulas is done manually, per the specification in Section 11.3. Several lexemes and tokens used by the scanner are listed in Table 4. The scanner was implemented by constructing functions for each token which returned the scanned lexeme and an index into the string where the lexeme ended. Returning multiple values from a function was accomplished using Lisp’s multiple-value-setq function, and was patterned on the built-in parse-integer function. Cross-workbook cell and name references are handled specially, to minimize the amount of work needed in the scanner and leave the tougher work for the parser generator. Specifically, under Excel, workbook and worksheet names are grouped together inside the same singly quoted string if one of them contains spaces, and workbook names are singly quoted normally when containing spaces, shown in the first column of Table 5. A literal scanning of the tokens would lead to worksheet and workbook names being occasionally included in the same string lexeme. This inclusion would prohibit identification of the reference within the parser, and require adding extra logic to the scanner to specially recognize cross-workbook and worksheet references. Instead, singly quoted strings containing spaces are treated specially by the scanner, as shown in Table 5.
42
7.2.2
Parsing
Parsing is done using a LALR(1) parser generator [20] which accepts a grammar as a list of tokens and lambda functions to be applied against their corresponding lexemes. The parser generator outputs a closure which acts as a parser. Upon compilation, the system writes this closure to a temporary file to be read upon system load. System statistics, dates, and other information is written to the header of the generated file to preclude manual modification. Scanned formulas are parsed according to the grammar listed in Section 11.1 of the Appendix. One goal while analyzing formulas was to convert the formula to an expression easily usable by Lisp, since during WYSIWYT, portions of formulas must sometimes be analyzed. Therefore the actual productions used by the grammar are broken down so operators are ordered with the correct precedence. Parsing is performed according to the grammar listed in Section 11.2 of the Appendix. During parsing Excel operators are substituted for Lisp operators and references recognized. Ranged references involving the “:” operator, named references, cross-workbook and cross-worksheet references, and ranged referential functions are tagged with special identifiers like excel-name, excel-range, and excel-func. The if conditional is tagged with excel-func rather than being treated specially. 7.2.3
Reference Conversions
Following parsing, the references in each Excel formula are converted to CellRef structures for compatibility with the Forms/3 system. The actual conversion is performed by recursively traversing the formula list and substituting elements of type excel-ref with CellRef objects. This step is problematic, however, because CellRef does not support ranged or named references, and since a structure of type defstruct is not subclassable under CLOS. For ranges this is worked around by giving the CellRef structure a special cellid which identifies the reference as a range. A second version of the formula is created next, wherein relative references are converted to absolute ones. This is required because some portions of the analysis system require an easily evaluable, absolute formula (displayable-formula), whereas other portions, such as the region inference engine, prefer reasoning about relative references (displayable-general-formula). 7.2.4
Evaluation Conversions
The request evaluation system (described in Section 7.4) requires certain sections of the parsed formulas to be evaluated by the spreadsheet package itself outside of Lisp, for the reasons described in Section 7.4. This means these formula segments must be translated back from a Lisp list into a format evaluable by Excel. The conversion must generally replace prefix operators with infix ones. Additionally, all references must be made absolute and prefixed with their correct workbook and worksheet because the evaluation is performed within the Excel Addin to avoid interfering with the target workbook itself. An example of the conversion is shown in Table 6.
7.3
Testboxes
Implementation of testboxes requires displaying a box on certain cells of the spreadsheet, fielding clicks on them, and updating the X or checkmark displayed on them, as described in Section 6.2. Under Windows, testboxes are implemented as OLEObject Labels, because these objects also support mouse motion events. The programmability of OLEObjects under VBA is roughly the same as the Label, Checkbox, and other objects commonly used under Visual Basic 6.0, except VBA does not support control arrays. Since VBA lacks control arrays, the objects cannot be 43
Stage Original Scanned Parsed Relative Absolute Evaluable
Formula =if(R[-1]C1 > 75, 0, 1) eq_op (id if) ’(’ (addr (rel -1) (abs 1)) gt (dec 75) ’,’ 0 ’,’ 1 ’)’ (excel-func if (> (addr (rel -1) (abs 1)) 75) 0 1) (excel-func if (> # 75) 0 1) (excel-func if (> # 75) 0 1) =(([Book1.xls]Sheet1!R4C1 > 75)) Table 6: Excel Formula Conversions
assigned event handlers dynamically, so while testboxes can be created dynamically, clicks on them are not readily detectable. This problem is worked around by having the VBA addin program textually insert event handlers into the user’s spreadsheet, and letting each event handler call back to the cell’s associated system data structure (XLCell). Textual insertion of event handlers has several drawbacks however. For example, the code which inserts the macros may trigger false positives in some virus scanning programs. Also, the technique does not scale well to larger spreadsheets, which could exceed 1,000 cells, as an event handler must be inserted for each referential cell. If the system terminates prematurely, the user’s spreadsheet can also be left riddled with unwanted macros. Finally, the program insertion can crash Excel when the event handler indirectly creates new buttons and modifies its own code pane. The use of OLEObject thus adds additional functionality to the system at the cost of complexity and instability. Keeping testboxes aligned to their respective cells is done by iterating over all testboxes in the spreadsheet and realigning them every time a cell is added. This was previously done using a special property of the testbox object type, OLEObject, which linked the object to the cell, so when the cell was moved, so was the associated testbox. This property also caused clones of the testbox to be created when the cell was copied and pasted, however, so the complete realignment approach was taken instead. Under MacOS and earlier implementations for Windows, testboxes are implemented as AutoShape objects (OLEObjects are not functional under MacOS). With AutoShapes, event handling is performed by assigning each testbox a name corresponding to it’s associated XLCell and assigning it’s OnAction property to a special clickhandler macro. This macro uses Application.Caller to execute a method in the cell’s associated XLCell. Both mechanisms are encapsulated within the XLBox class. The paired testbox defined in Section 6.2 is implemented using two objects of type XLBox. For efficiency and simplicity, the paired boxes are properties of the worksheet, so only one is created per worksheet.
7.4
Request Evaluation
To gauge the testedness of a conditional cell’s precedents, the system needs to determine which branch of the condition has been executed, as described in Section 2.2. Although the system can determine the cell’s value and formula, it cannot necessarily infer which branch of the condition is taken without evaluation. Specifically, the system must evaluate either the predicate or both of the branches and get the predicate’s value through inference. Given the distributed nature of the system, however, evaluation is non-trivial because a predicate written under Excel could contain expressions which are not evaluable by the Lisp engine. For example, the expression might contain
44
Figure 22: Evaluation of predicates under Excel for tracing. a function such as BESSELJ, the Bessel function, which has no built-in equivalent under Lisp. Furthermore, Lisp might evaluate even simple expressions differently than Excel, given differences in how floating point and integer length are handled, leading to incorrect identification of tested branches within CFGs. Rather than evaluating expressions itself, therefore, the engine sends predicates back to Excel to be evaluated. The predicate snippets must be converted back to a format evaluable by Excel, as described in Section 7.2.4. This operation is tricky, however, because backend/frontend communication is asynchronous (Section 3.3.7) and the system must wait until the predicate is evaluated to continue gauging testedness, or “tracing” (Section 2.2). In a multi-threaded system, the tracer for that particular cell might be put to sleep and wake up again when the evaluation was returned, but the tracing system in use was not designed to run as a single thread. Instead a different method is adopted whereby the evaluated message contains an identifier that calls back to continue tracing on the original cell. The callback method is performed by keeping a global table containing callbacks to each trace waiting upon an evaluation. The identifier for the trace is unique to each request, as shown in Figure 22. When the evaluation is complete, tracing resumes for the given cell.
7.5
Fault Localization
At the visual interface level, Fault Localization is implemented by simply converting the desired fault likelihood RGB (Red Green Blue) value to Excel’s format and setting the background of the desired cell to that color. Unlike in JavaForms, if an RGB color of white is specified, shading of the cell is disabled, since when shaded white the cell’s gridlines are not visible. This more closely follows the semantics of normal shading under Excel.
45
Figure 23: Use of toolbar buttons to implement a progress bar on the Windows platform.
7.6 7.6.1
Form-Level Indicators Testedness Overview
As specified in Section 6.4, the testedness of the entire workbook must be displayed in a constant, uniform place, to indicate progress as the user tests the spreadsheet. This is done under Excel by creating a CommandBar object of type CommandBarButton and filling it with 20 buttons of red and blue colors. The percent testedness of the spreadsheet is reflected in the proportion of red to blue (Figure 23). This differs from the JavaForms progress bar, but still serves to show the information visually. Updating the progress meter requires pasting Shape objects from the Excel Addin’s internal workbook to the clipboard, and then pasting them to the toolbar. After this operation the clipboard is cleared to prevent the user from inadvertently pasting a Shape object into a workbook. However, because progress bar updating can occur anytime after a user has marked a cell as tested, this clearing of the clipboard can interfere with normal copy and paste operations. For example, a user may cut a tract of cells, then mark a cell as tested, causing the progress meters to update and clear the clipboard of the cut cells. The user then cannot paste the cut cells, possibly losing work. An alternative implementation of the progress bar could involve creating a VBA Form displaying the progress bar. Only Win32 Excel supports non-modal forms, however, so it could prove difficult to include a non-modal progress bar in a platform-independent implementation. Such a bar would also float around over the spreadsheet and could be lost from the user’s field of view, or conversely obscure important cells of the spreadsheet. The file loading indicator is also programmable under Win32 Excel, but in practice this indicator is too inconspicuous and inflexible. In the first user study of the system, the button-based progress bar was not apparent to the user as a progress bar. Instead the user seemed to view the indicator only as a series of buttons. Work is still needed to make this progress bar apparent to the user while working inside the framework of Excel. 7.6.2
Fault Localization Overview
To give fault localization equal status with WYSIWYT, a second progress bar was designed to distill relative fault likelihood over a given workbook [29]. This overview bar displays the relative proportion of cells with very low, low, medium, high, and very high fault likelihood. Each classification appears as a different color in a progress bar (Figure 24). Like the testedness toolbar, the progress bar is implemented as a sequence of twenty (20) toolbar buttons, and each button represents 5% of the entire spreadsheet. In large spreadsheets however, the number of cells with a given fault likelihood may well comprise less than 5% of the total cells. Under a straightforward interpretation of the fault likelihood, therefore, most of the information is lost. The approach used instead is to represent each fault likelihood level less than 5% with one button, and reduce the number of buttons of the most well represented fault likelihood level as necessary. 46
Figure 24: The Fault Localization overview bar.
Figure 25: Arrows under WYSIWYT-XL.
7.7
Arrows
Arrows are displayed by drawing a line from the source to sink cell, using constant offsets to create the curves when drawn between cells on the same row. Arrows are displayed for the actively selected cell by clicking a button on the WYSIWYT toolbar, as shown in Figure 25. The testedness of each cell’s du associations is reflected in these arrows (Section 2.2).
7.8
Explanations
The system is a testbed for studying our group’s Surprise-Explain-Reward strategy [37]. This strategy leverages the user’s curiosity (triggered by a surprise) to educate and entice him or her to use the system through an unintrusive negotiated explanation system. The explanation system hinges on tooltips available over each of the major interface devices. The system displays a tooltip when the user hovers the mouse over either the primary or paired testbox for 3 seconds, as shown in Figure 26. Equivalent tooltips are not available on borders, shaded cells and arrows, since the objects used to create them have no mouse-related events. The OLEObject objects used to create testboxes under Excel do have mouse-related events, but they are not directly helpful to detect the hovering required for tooltips. Rather these events, such as MouseMove, only trigger when the user moves his or her mouse over the testbox. More adaptation was required to generate tooltips with this facility. Specifically, the system records every MouseMove event and secondly records the position of the mouse using the operating system level GetCursorPos library in user32.dll. Next, the system sets an OnTime event to occur in a given number of seconds. Because OnTime only accepts 47
Figure 26: The tooltip-based explanation system. macros as event handlers, the Testbox object must delegate itself through a module-level macro for this timer. When the timer expires the position of the mouse is checked again, assuming no other timers have intervened, and if the position is the same, then a tooltip is displayed. If the mouse is moved again away from the testbox, the tooltip is hidden and the process begins again. Because of limitations in the MouseMove event, these hand-made tooltips do not disappear as readily as they should. Specifically, if the mouse is moved away from the testbox very quickly, no MouseMove event is generated. This means tooltips may be left on the testbox after the user moves the mouse away. Tooltips may also not appear if the user moves the mouse to the center of the testbox very quickly and waits, although this situation is very uncommon: usually the user moves the mouse at least twice over the object before hovering. The former situation is not necessarily troublesome either, since a lingering tooltip will be dismissed when the user move the mouse over any testbox. The text of the tooltips is updated dynamically from the testedness information in the analysis engine. Because of the paired testbox approach used with WYSIWYT-XL, the tooltip content for the system is different than in JavaForms. The tooltip text label itself is implemented using an object of type XLTooltipable (Figure 7), so the label itself can generate tooltips, permitting multi-level tooltips. Because MacOS does not support OLEObjects, tooltips are not available on that platform.
7.9
Transcripts
Event-based transcripts are captured under the Excel Frontend and written to a file on the fly as the user sessions occurs. This permits study of every possibly relevant user action, such as hovering over a testbox to elicit a tooltip, or switching between worksheets. Additionally, hooks were added to the system to record roughly how long a tooltip was displayed. Data transcripts were implemented using the existing transcripting system, which operates purely on the Lisp backend.
7.10
Clean Up
When the user saves a workbook or stops the WYSIWYT session, the system must remove WYSIWYT, Arrows, and Fault Localization formatting to prevent the formatting from being saved along with the workbook. This is done by simply clearing the workbook of all borders, shading, and shape objects. A more sophisticated approach would cache previous shapes, borders and shading, then selectively restore the formatting when the workbook is saved, to avoid losing user-generated formatting.
48
Additionally, the event handlers inserted into the user’s spreadsheet for testboxes (Section 7.3) must be removed upon saves, to avoid leaving the spreadsheet riddled with macros, potentially triggering security warnings under Excel when the workbook is opened later. The system therefore clears the worksheet code panes of all macros upon saves. While this approach could also remove user-created macros from the workbook, recorded macros are stored in modules rather than worksheet code panes, and these would be preserved by the system. Other user written macros would also probably be preserved, since it is more conventional to store macros in modules than worksheet code panes.
7.11
Test Case Generation (HMT)
The test case generation engine used with Forms/3 is also employed under the partial Excel implementation, with minor modifications. HMT involves changing the input cells of the spreadsheet, evaluating their result, and checking to see if the changed input selects a new test available for the user. Under the system’s distributed evaluation architecture however, evaluation can only be done within the spreadsheet system itself (Section 7.4). This means that test case generation must issue a request to evaluate cells for a particular input cell, and wait for the result before continuing. Fortunately, HMT is implemented as a separate thread under Forms/3, so after issuing the request to evaluate a cell, HMT blocks itself until the desired evaluation returns. As in Forms/3, the spreadsheet is updated automatically as HMT seeks values that select tests. Currently only a random test case generation approach has been tested with the system, on single cells. One side effect of the decision to test over whole workbooks rather than worksheets is that HMT operates on a whole workbook, potentially requiring the user to give attention to multiple worksheets at once.
7.12
Optimizations
The majority of execution time for the system is spent processing and unpacking messages in the frontend. Since the message format is delimited by opposing parentheses, the processor must scan the input stream character by character. Since reasonably sized spreadsheets may exceed 1 million characters of messages when loading, this takes time. This bottleneck is optimized slightly by using InStr$, Mid$, and Left$. Unlike other functions, these operate exclusively on fixed-length strings instead of Variants, and so run slightly faster. Since no testboxes are required on input cells under WYSIWYT, another minor optimization used is to check the text of each cell prior to creating a primary testbox for it and not create one if the text is not a formula cell. This check is effective because a cell must contain a formula to contain a cell reference.
7.13
Redesign Issues
Originally the MesgHandler (Section 6) was designed as a class, however it was changed to be a simple module. The change was made because the VBE debugger apparently cannot break into code executed by classes, rather, it simply highlights the last statement executed by a non-class module. Therefore if the MesgHandler were implemented as a class, system developers confronting an error could not isolate which class their message was dispatched to, and hence which class was generating the error. Since the MesgHandler is only instantiated once, it was trivial to convert to a simple module. This has helped developers to find faults in the system sooner. During insertion of event handlers under Excel, an optional check can be made whether the event handler already exists. Although this is expensive, Excel can cause crashes when an event 49
handler with the same name already exists in the given CodePane, so this check can be valuable when debugging. Excel may also crash when an event handler directly or indirectly inserts code into its own CodePane, although checking for this condition is not feasible.
50
8
System Execution and Development
This section describes how the WYSIWYT-XL system is run, installed, and modified. Details on how the system is modified to work within version control are described (Section 8.2), and style templates are provided. The section is targeted towards technical users and developers.
8.1
Execution and Installation
To run the system, the user must run a lispserver or equivalent backend. They then open Framework.xla under Excel, and specify the host and port number in the toolbar, click the “WYSIWYT” toolbar button, and open an existing workbook to trigger the system. Like JavaForms, the system will try higher port numbers if the first port is closed. This process is slower under this system, because as some connection attempts fail non-deterministically the system will retry upon failure. If no ports are available an error is eventually thrown. For debugging output, developers may set the Global defVerbosity variable to higher value. This output is available in the Immediate Window of the Excel VBA editor. While the system supports use of Remote Desktop Protocol (RDP) clients, rdesktop version 1.3 has a clipboard redirection feature which interferes with the testing toolbar. To run rdesktop or another RDP-based client with the system, developers must disable this feature, for example by calling rdesktop with the -4 flag.
8.2
Version Control
Under the Lisp backend, developers edit, run, and optionally compile each file in plaintext format. These files are committed into a CVS (Concurrent Versions System) repository. Under Excel, however, code must be edited using the Excel VBA Editor (VBE) inside of a binary Excel Add-in (.xla) file. Although the binary spreadsheet may be entered into version control, all of the class modules and general modules comprising the system would be stored in the same file under version control. Versioning all the modules in the same file means concurrent changes made by developers to different modules of the system would always produce conflicts. Furthermore, the conflicts would be difficult to resolve, since CVS could not even indicate which modules conflicted, let alone the lines of conflicting code. Instead of entering the entire .xla file into version control, the XLA is exported into separate modules. For example, to compile the system, developers open a spreadsheet ImportExport.xls and click Build. This creates a Framework.xla file, by importing files from a modules directory, and a base spreadsheet containing static Shape objects called Framework.xls. Some of the modules are platform-specific. The Import script detects the current operating system and selects the directory from which to import platform-specific modules. For example under Windows the CSocket and MSocketSupport modules are imported, whereas on MacOS X, MacLib is imported. After importing files, developers make changes with the VBA Editor and run the system using the XLA. Then to update or commit changes, developers open the ImportExport.xls file and click “Prepare for CVS”. This exports the new or changed modules and removes the .xla file. The developer then performs the update or commit, and clicks Build to re-create the spreadsheet and begin working again. In the original windows version, the Socket file could only be edited by opening Framework.xls separately and saving it, because the Winsock control could not be dynamically generated on machines without a VB6 development license. Module and class module (*.bas and *.cls) filetypes are treated as nonmergeable text files under CVS, using the cvswrappers setting. This means CVS prompts the developer for a manual merge 51
upon updates when intra-module conflicts occur. Line ending conversion is enabled under CVS because it is coupled with keyword expansion, which is needed to identify each file with the correct version number and last author. The line ending conversion is only problematic if a developer breaks Forms/3 development rules and checks in new files using a Windows CVS client such as WinCVS, and others check out the file under Unix. Files with *.xls or *.xla are treated as binary, to avoid keyword expansion and line conversions interfering with the files. While keyword expansion is enabled, the $Log$ keyword is not used inside the VBA source files because the appended log information will trick CVS into thinking the file was modified after it has been committed, making it difficult for developers to discern which files they’ve actually modified. This is not problematic for normal (e.g. C) source files because CVS usually determines file modification status based on the file’s modification time or mtime rather than directly checksumming it. However, this system continually exports each code module to a new file, so the mtime consistently changes betweens updates and commits. Algorithm 2 Importing and Exporting CodePanes procedure Update Export cvs update or commit Import 5: end procedure procedure Import if Addin exists then Terminate end if 10: Create Addin from Base for all file such that file is *.bas or *.cls do Addin ← Addin + f ile end for Restart Excel 15: end procedure procedure Export if Addin exists then Remove all files for all codepane such that codepane is ext module or vb module do 20: f ile ← codepane end for Close Excel else Terminate 25: end if end procedure
8.3
Style Requirements
This section describes requirements on development style, coding format, and programming conventions for the system developer. It lists examples of cases and preferred programming constructs, in
52
general (Section 8.3.1), for Visual Basic for Applications programs (Section 8.3.2), and for Common Lisp (Section 8.3.3). 8.3.1
General
Unreachable or inactive code must be removed from the project. For example, old code cannot be included in comments, or in unreferenced files. If code is needed for reference or insurance purposes it may be entered into version control prior to removal. Editing history shall be contained in version control and at the end of each source file. Initials, dates on when code was added, and other modification-related commentary may not be included elsewhere in the code itself. Inclusion of history may done automatically via the cvs $Log$ keyword or with the rcs2log utility, which generates a ChangeLog file. If done manually, care should be taken to ensure the comments are identical, and the history in source is changed before committing the file, to reduce trivial changes. Commit only one file at a time, unless a functionally similar change is made across many files. Each commit must be accompanied by a unique descriptive, complete, and correctly spelled log entry. 8.3.2
Visual Basic for Applications
1. Pascal Case (“PascalCase”) must be used for functions, subs, properties, and classes. Camel Case (“camelCase”) must be used for variables. Variables shall not be annotated with their type, as in Hungarian Notation. For example, the code below is correct: Public Sub StartSystem(boxEnabled As Boolean) Set system = New XLApplication(boxEnabled) End Sub If a developer chooses local variable names which match existing variable names, ensure the case matches the existing names; otherwise VBA may change the existing variable name. For example, if a variable with name “value” is introduced, the following line of code may change inadvertently: cell.Value 2. Within each function, variables must be declared at the top, C-style. Within each module, code will be structured in the following order: (a) (file comment header) (b) public module-level variables, objects first (c) private module-level variables, objects first (d) constructors/destructors (e) regular procedures (f) mutator procedures (g) accessor procedures
53
(h) (file comment footer) 3. For consistency, follow these recommendations on procedure calls: (a) Do not use the Call keyword when calling Subs – for example, do not use them with parentheses. (b) Specify the module when calling module-level subs, functions, and variables, but not class module-level procedures. (c) Use the With keyword to reduce use of temporary variables. For example: With XLWorkbook .New(.row, .col) End With instead of: Set tmp = XLWorkbook tmp.New(tmp.row, tmp.col) 4. Use the custom SafeCollection class instead of Collection. This prevents runtime errors. 5. Follow these recommendations on defining variables and procedures. (a) Always specify the type of a variable, parameter or function. Explicitly specify Variant where applicable to multiple types. (b) Always specify private/public/friend for module-level definitions. (c) Always use Option Explicit to ensure all variables are declared. 6. To prevent “spaghetti code”, confusion, and missed errors while using error handlers, follow these recommendations: (a) For clarity, use labels only for error-handling. Avoid unconditional gotos. (b) Put Errorhandler labels, if any, at the end of a procedure. (c) Avoid general error-handlers; limit error-handling to a minimal region of code, to make debugging more effective. 7. VBA provides three different kinds of procedures, subs, functions, and properties. Described below are when to use each: (a) When values are not being returned, use Subs instead of void Functions. This is more clear since Functions tend to indicate that values will be returned. Always use the returned value of a Function. (b) For better readability, use VB Properties instead of getFoo or setFoo functions. 8. For readability, the following conventions must be observed on comments and formatting: (a) When indenting use the default tab (four spaces). (b) Include a Function header comment for each function, per the template provided in functionHeader.txt, reproduced below: 54
’=========================================================================== ’ FunctionName ’=========================================================================== ’ Description: ’ ’ Given: ’ Returns: ’ Precondition: ’ Postcondition: ’===========================================================================
In this template note the Given, Returns, Precondition and Postcondition fields are optional. To avoid redundancy, the Given and Returns fields, if any, should not merely list parameter types. (c) Include a Header and Footer in non-trivial source files, per the template provided in header.txt and footer.txt, reproduced below with cvs keywords escaped: ’======================================================================== ’ $\RCSfile: SafeCollection.cls,v $ ’ $\Revision: 1.4 $ ’======================================================================== ’ Description: ’ Place a description of your module here. ’======================================================================== ’ See footer for history. ’======================================================================== ’======================================================================== ’ History Footer ’======================================================================== ’ Original Author: Your Name ’ Created: Jan 9, 2004 ’ Organization: Oregon State University ’======================================================================== ’ $\Log: SafeCollection.cls,v $
Optionally, update the modification history manually instead of using cvs keywords. For trivial source files or documentation, the $Id$ keyword or equivalent may be used. 8.3.3
Common Lisp and CLOS
For Common Lisp, standard Lisp formatting conventions should be followed. For example, developers should group closing parentheses on the last function statement, rather than breaking them up “C-style” across several lines. Developers should wrap all lines at 80 characters or less, and since tab interpretation varies between editors (4 space vs 8 space) configure their editor to expand tabs into spaces for better readability. Where tabs are used, they often correspond to 8 spaces, the Unix standard. For the Vim editor, this can be configured as follows: set lisp set expandtab set autoindent 55
For readability, developers may configure their editor to use syntax highlighting, for example use set syntax on in Vim. Use grep or find to locate function definitions across different files. The following bash functions may be useful for this: # Search lisp function, method, or struct definitions defgrep() { egrep -in "^[^;]*def(class|un|method|struct|setf).*$1" *.lisp } # Search for a string in lisp files. lispgrep() { egrep -in "^[^;]*$1" *.lisp; } New functions should have descriptive headers on top, describing the inputs, outputs, and what the function does. A template for this header is in functionHeader.lisp.
56
9
Gnumeric
To help validate the extensibility of our architecture, and to overcome shortcomings in Excel, implementation of WYSIWYT was explored in a second spreadsheet package. As free software, this spreadsheet package, Gnumeric, is more flexible and programmable than Excel. Although less commonly used than Excel, Gnumeric supports the same file format and uses a similar graphical interface. Implementation under Gnumeric was limited to testedness and fault localization.
9.1
Excel Shortcomings
Under Excel, WYSIWYT is partially restricted by Excel’s lack of programmability. Specifically, a user interface suitable for HCI studies cannot feasibly be created under Excel, the VBA language is not suited for programming in the large, and a VBA Addin cannot handle many actions a user performs on the spreadsheet. 9.1.1
Inflexible User Interface
For the testing theory behind WYSIWYT to be accessible to users, it is distilled into visual metaphors. For example to show that a du-association between two cells is exercised, a cell is marked with a checkmark and dominated cells marked as blank. This illustrates to the user how further testing of the blank cells is less useful. The overall testedness of the spreadsheet is also indicated via a form-level progress bar. Yet it is difficult to create such user-interface elements under Excel. For a testedness toolbar, the best approximation has been to fill a regular toolbar with specially colored buttons (Figure 23). These custom buttons must be individually copied and pasted from the clipboard, interfering with the user’s copy and paste operations. Testboxes can be created, but their event handlers are not designed to be added on the fly, and the VBA addin must textually insert event handlers into the user’s spreadsheet. This is problematic because it can leave a user’s spreadsheet with extra macros, triggers virus scanners, and can crash Excel. Furthermore, this approach does not scale well to larger spreadsheets. 9.1.2
Difficult Native Language
The programming features of Excel are made available via Visual Basic for Applications, a language with automated memory management and a low learning curve for many tasks. However, while object-based, VBA is not object-oriented (Section 5), so it is difficult to subclass and extend existing objects and classes. Furthermore, working with object variables under VBA is often confusing since they must be assigned differently than scalar variables. This means sometimes the type of function calls must be tested before they can be assigned to a variable (Table 7). Excel VBA is also difficult to use within a version control system, since the source code is stored as code panes inside a binary .xls file (Section 8.2). 9.1.3
Design Holes
Finally many user actions are possible under Excel which cannot be adequately handled through a VBA Addin. For example, Excel permits deletion of rows, columns, and individual cells, but does not distinctly signal this event. Since a WYSIWYT implementation needs to store testedness and other information for dependents of each spreadsheet cell, deleting cells without warning could cause incorrect results. Moreover, some features of the Excel language, such as macros, necessarily 57
itemType = VarType(col.Item(index)) If itemType = vbObject Then Set Item = col.Item(index) Else Item = col.Item(index) End If Table 7: Use of VarType with Variant Function
Figure 27: A diagram of the overall Testmeric architecture. cannot be supported since they conflict with the WYSIWYT mechanism itself. This permanently limits WYSIWYT to a subset of the spreadsheet language. 9.1.4
Testmeric
To help address these problems, implementation of WYSIWYT was partially explored within Gnumeric. The resulting implementation was called Testmeric (Test + [Gnu]meric). Gnumeric was chosen for implementation since it seemed most conducive to fast modification and compared favorably with other packages in terms of programmability. Since Excel and Gnumeric share a common structure, Testmeric uses the same backend for analysis as Excel.
9.2
Architecture
The architecture for Testmeric is similar to WYSIWYT-XL, with socket-based communication between a frontend and backend, with Gnumeric used as the frontend instead of Excel. Under Testmeric, instead of using a built-in event-generating socket module, watches are added for write and error events on the Gtk main event loop. This is summarized in Figure 27.
58
9.3
Implementation
Some salient aspects of Testmeric’s implementation are described in this section. Since WYSIWYTXL and Testmeric use the same architecture, the backend implementation was identical to that described in Section 7. 9.3.1
Build System
Some difficulty was encountered linking a WYSIWYT module into the Gnumeric build system. The build system involves over 2000 files, in C, XML, SGML, YACC, LEX, and M4 format. These files are tied together using Makefiles which are autogenerated from a configure script. These configure scripts are in turn auto-generated using GNU Autoconf files, and the autoconf files are influenced by GNU Automake files. This condenses the build system to a basic listing of source files, with Makefiles being constructed automatically by automated analysis of their dependents, but requires some familiarity with Automake and Autoconf to add new files. For Testmeric, a “wysiwyt” subdirectory of the Gnumeric source directory was created and linked in as “libwysiwyt.a” using GNU Libtool, a portable library linker. Another challenge of the build system was how creating the Gnumeric executable required compiling over 100 KSLOC (source lines of code). Building the executable from scratch took about 15 minutes, extending the testing/debugging cycle. 9.3.2
Library Communications
Testmeric also focused on reusing the existing analytical WYSIWYT engine and being APIcompatible with an Excel-based system. The system added functionality for communication over a TCP/IP (connection-based) socket. Like the Excel system, the Gnumeric application provides data to the backend and receives information such as testedness in return, in an asynchronous manner. However, since the communications are continuous there is no end-of-transmission (EOT or EOF) signal over the socket to signal the current communication is finished, and when running of Gnumeric should resume. Since Gnumeric is a purely user-interface driven system, integrating this additional socket-based method of input was non-trivial. Fortunately, Gnumeric uses a C library subsystem “Glib” 3 . Glib provides common data structures such as linked lists and queues, basic reference counting, and portability wrappers. It also provides a class of objects called GIOChannels [19], which can be wrapped around conventional BSD sockets. Using this library, a basic socket to the backend library was established, wrapped around a GIOChannel. The main event loop within Gnumeric was extended to “watch” for events on this GIOChannel, and handle them with a default priority. Since GIOChannels also handle writing and reading concurrently on the same channel, it was only necessary to flush the write buffer before and after writes to keep the GIOChannel consistent. 9.3.3
Execution
Testmeric runs either locally on a GNU/Linux based machine or using X-forwarding. Since Gnumeric runs on Solaris, MacOS, and Windows as well, Testmeric could also be ported to these platforms. Since Gnumeric is dependent on the XInputExtension property under X-Windows, it must be run remotely using xhosts, rather than ssh. 3
Glib should be distinguished from glibc, the GNU C library. The similar name arises from its origin as the library for GTK, itself a toolkit for GIMP, the GNU Image Manipulation Program.
59
Figure 28: A screenshot of Testmeric.
9.4
Results
Like Excel, cells under Testmeric are appropriately colored with a Red/Blue value indicating their testedness (Figure 9.4). Checking of cells is supported by a testbox per the WYSIWYT specification. Since the static GnomeCanvas image was used for creating the testboxes, updating of the testbox’s status proved difficult and is not yet supported. The sending of Fault Localization (X-marks) is also supported, however a suitable scheme for indicating this information is not in place.
60
10
Conclusions and Future Work
To help study problems of scale, WYSIWYT was implemented in two spreadsheet packages, Microsoft Excel and Gnumeric. While the Excel implementation contains more features, Excel’s limited programmability required limiting how arrows, tooltips, and spreadsheet-level progress bars could be implemented. Running the system as a VBA macro also made the system vulnerable to unexpected termination from Excel or the user, limiting how well the system could be applied in long-term studies. As part of dealing with these limitations, however, innovative interfaces were developed which may be preferable to the original design. With interactivity added, the Gnumeric implementation may be more suitable for studies in this respect than Excel. Gnumeric might also be suitable for future work in spreadsheet visualization, such as Shiozawa’s 3D visualization scheme [32] of spreadsheet dependencies. Experimenting with new ways to display fault localization information, for example through “sunken” cells, may also be rewarding under both Excel and Gnumeric. By using commercial spreadsheet packages, this project provides a framework for studying WYSIWYT and associated dependability-enhancing techniques in a new and promising environment.
References [1] IEEE Std 830-1993. Recommended Practice for Software Requirements Specifications. IEEE Computer Society Press, New York, NY, 1993. [2] H. Agrawal and J.R. Horgan. Dynamic program slicing. In Proceedings of the ACM SIGPLAN ’90 Conference on Programming Language Design and Implementation, pages 246–256, June 1990. [3] Alfred V. Aho, Ravi Sethi, and Jeffrey D. Ullman. Compilers: Principles, Techniques, and Tools. Addison-Wesley, Reading, Massachusetts, 1986. [4] ANSI/IEEE. IEEE Standard Glossary of Software Engineering Terminology. IEEE, New York, 1983. [5] Mario. Barbacci, Mark H. Klein, Thomas H. Longstaff, and Charles B. Weinstock. Quality attributes. Technical Report CMU/SEI 95-TR-021, Carnegie Mellon University, Pittsburgh, PA, January 1995. [6] Kent Beck. Extreme Programming Explained: Embrace Change. Addison-Wesley Professional, New York, 1999. [7] B. Boehm and V. Basili. Gaining intellectual control of software development. Computer, 33(5):27–33, May 2000. [8] B.W. Boehm, C. Abts, A.W. Brown, and S. Chulani. Software Cost Estimation with COCOMO II. Prentice Hall PTR, Upper Saddle River, NJ, 2000. [9] M. Burnett, J. Atwood, R. Djang, H. Gottfried, J. Reichwein, and S. Yang. Forms/3: A first-order visual language to explore the boundaries of the spreadsheet paradigm. Journal of Functional Programming, 11(2):155–206, March 2001.
61
[10] M. Burnett, C. Cook, O. Pendse, G. Rothermel, J. Summet, and C. Wallace. End-user software engineering with assertions in the spreadsheet paradigm. In Proceedings of the 25th International Conference on Software Engineering, pages 93–103, Portland, OR, May 3–10, 2003. [11] M. Burnett, A. Sheretov, and G. Rothermel. Scaling up a ‘What You See Is What You Test’ methodology to spreadsheet grids. In Proceedings of the IEEE Symposium on Visual Languages, pages 30–37, Tokyo, Japan, September 13–16, 1999. [12] E. Rogan Creswick. Dynamic, incremental assertion propagation in end-user programming. Master’s thesis, Oregon State University, School of Electrical Engineering and Computer Science, Corvallis, Oregon, June 2004. [13] D. Cullen. Excel snafu costs firm $24m. The Register, 67, June 2003. http://www.theregister.co.uk/content/67/31298.html. [14] M. Fisher II. WYSIWYT-XL. Proceedings of the IEEE Conference on Software Engineering, In preparation 2004. [15] M. Fisher II, M. Cao, G. Rothermel, C.R. Cook, and M.M. Burnett. Automated test case generation for spreadsheets. In Proceedings of the 24th International Conference on Software Engineering, pages 141–151, Orlando, Florida, May 19–25, 2002. [16] M. Fisher II, D. Jin, G. Rothermel, and M. Burnett. Test reuse in the spreadsheet paradigm. In Proceedings of the IEEE International Symposium on Software Reliability Engineering, November 2002. [17] Erich Gamma, Richard Helm, Ralph Johnson, and John Vlissides. Design Patterns. AddisonWesley, Reading, Massachusetts, 1995. [18] Oleg Gdalevich. Csocket class, a replacement for the ms winsock control. VBIP, Viewed April 20, 2004. http://www.vbip.com/winsock-api/csocket-class/csocket-class-01.asp. [19] GNOME. The Glib Reference http://developer.gnome.org/doc/API/2.0/glib/.
Manual,
April
2004.
[20] Mark Johnson. Lalr parser generator. Open-source software written by Mark Johnson, Viewed January 1, 2004. http://www.cog.brown.edu/ mj/Software.htm. [21] V. Krishna, C. Cook, D. Keller, J. Cantrell, C. Wallace, M. Burnett, and G. Rothermel. Incorporating incremental validation and impact analysis into spreadsheet maintenance: An empirical study. In Proceedings of the International Conference on Software Maintenance, pages 72–81, Florence, Italy, November 2001. [22] Institute of Electrical and Electronics Engineers. IEEE Standard Computer Dictionary: A Compilation of IEEE Standard Computer Glossaries. IEEE, New York, NY, 1990. [23] R. Panko. Finding spreadsheet errors: Most spreadsheet errors have design flaws that may lead to long-term miscalculation. Information Week, page 100, May 1995. [24] R. Panko. What we know about spreadsheet errors. Journal on End User Computing, pages 15–21, Spring 1998. 62
[25] R. Panko and R. Halverson. Spreadsheets on trial: A survey of research on spreadsheet risks. In Proceedings of the 29th Hawaii International Conference on System Sciences, January 1996. [26] G. Rothermel, L. Li, C. Dupuis, and M. Burnett. What You See Is What You Test: A methodology for testing form-based visual programs. In Proceedings of the 20th International Conference on Software Engineering, pages 198–207, June 1998. [27] K. Rothermel, C. Cook, M. Burnett, J. Schonfeld, T. Green, and G. Rothermel. An empirical evaluation of a methodology for testing spreadsheets. In Proceedings of the 22nd International Conference on Software Engineering, pages 230–239, June 2000. [28] J. Ruthruff, E. Creswick, M. Burnett, C. Cook, S. Prabhakararao, M. Fisher II, and M. Main. End-user software visualizations for fault localization. In Proceedings of the ACM Symposium on Software Visualization, pages 123–132, San Diego, CA, June 11–13, 2003. [29] J.R. Ruthruff, A. Phalgune, L. Beckwith, M. Burnett, G. Rothermel, and C. Cook. Rewarding good behavior: End-user debugging and rewards. In IEEE Symposium on Visual Languages and Human-Centric Computing, September 2004. [30] J. Sajanieme. Modeling spreadsheet audit: A rigorous approach to automatic visualization. Journal on Visual Languages and Computing, 11(1):49–82, 2000. [31] A. Scott. Shurgard stock dives after auditor quits over company’s accounting. The Seattle Times, November 18 2003. [32] H. Shiozawa, K. Okada, and Y. Matsushita. 3d interactive visualization for inter-cell dependencies of spreadsheets. ACM Conference on Information Visualization, 1999. [33] R.D. Smith. University of Toledo loses $2.4M in projected revenue. The Toledo Blade, May 2004. [34] /N Software. Ip*works! v6 visual basic edition. Online, Viewed November 1, 2003. http://www.nsoftware.com/products/showprod.aspx?part=IPV6-A. [35] J. Summet and M. Burnett. End-user assertions: Propagating their implications. Technical Report 02-60-04, Oregon State University, Corvallis, OR, August 2002. [36] S. Tanimoto. Viva: A visual language for image processing. Journal of Visual Languages and Computing, 2(2):127–139, June 1990. [37] A. Wilson, M. Burnett, L. Beckwith, O. Granatir, L. Casburn, C. Cook, M. Durham, and G. Rothermel. Harnessing curiosity to increase correctness in end-user programming. In Proceedings of the ACM Conference on Human Factors in Computing Systems, pages 305– 312, Fort Lauderdale, FL, April 5–10, 2003.
63
11 11.1
Appendix A: Excel Formula Grammars An Excel Formula Grammar
Excel Formula Grammar Exp -> Constant | identifier | string | Exp ’+’ Exp | Exp ’-’ Exp | Exp ’*’ Exp | Exp ’/’ Exp | Exp ’^’ Exp | Exp ’&’ Exp | Exp ’=’ Exp | Exp ’’ Exp | Exp GTE Exp | Exp NE Exp | Exp LTE Exp | Exp ’ ’ Exp | ’-’ Exp | ’+’ Exp | Exp ’%’ | ’(’ Arglist ’)’ | ’{’ Arraycols ’}’ | Func | NamedRef | CellRef Func -> string ’(’ Arglist ’)’ NamedRef -> SheetRef string | WorkbookRef string SheetRef -> StringOrId ’!’ | WorkbookRef StringOrId ’!’ WorkbookRef -> StringOrId CellRef -> Rangeref | Func ’:’ Func | Rangeref ’:’ Func | Func ’:’ RangeRef Arglist -> Exp 64
| Exp ’,’ Arglist | ’,’ Arglist | epsilon StringOrId -> identifier | string Constant = ’#’ identifier | true | false | int | double Rangeref -> SheetRef Address | Workbookref StringOrId ’:’ StringOrId ’!’ Address | RangeRef ’:’ RangeRef | colRowRef | address
11.2
Original Precedence Grammar
FORMULA -> =EXPRESSION EXPRESSION -> EXPRESSION COP EXPR1 | EXPR1 EXPR1 -> EXPR2 & EXPR1 | EXPR2 EXPR2 -> EXPR2 AOP EXPR3 | EXPR3 EXPR3 -> EXPR3 MOP EXPR4 | EXPR4 EXPR4 -> EXPR4^EXPR5 | EXPR5 (This precedence may differ in other spreadsheet systems) EXPR5 -> EXPR5% | EXPR6 EXPR6 -> -EXPR6 | EXPR7 EXPR7 -> REFERENCE | FUNCTION | CONSTANT | ( EXPRESSION ) | NAMEDREF | CELLREF FUNCTION -> FNAME(ARGUMENTS) ARGUMENTS -> EXPRESSION, ARGUMENTS | EXPRESSION | epsilon REFERENCE -> ADDRESS | ADDRESS:ADDRESS | NAME CELLREF -> RANGEREF | FUNC : FUNC | RANGEREF : FUNC | FUNC : RANGEREF RANGEREF -> SHEETREF ADDRESS | WORKBOOKREF STRINGORID : STRINGORID ! ADDRESS | RANGEREF : RANGEREF | COLROWREF | ADDRESS NAMEDREF -> SHEETREF string | WORKBOOKREF string STRINGORID -> string | id COP -> = | < | | >= | AOP -> + | MOP -> * | /
11.3
Formula Lexemes as Regular Expressions
colRowRef -> (R|C)[(-)?[1-9]+] address -> R[(-)?[1-9]+]C[(-)?[1-9]+] 65
| R[0-9]+C[0-9]+ quoted_string = ".+" int = [:digit:]+ double = [:digit:]+([.][:digit:]+)?([E][+-][:digit:])? string = [:alphanum:]
66
12
Appendix B: Communications Format
A grammar describing the syntax of messages is described in Section 5.4.2.
12.1
From Frontend to Backend Specification
Overall - Overall Communications 1. (quit) :- Quits the system 2. (gui-unknown-message messageName) :- Returns unhandled messages Testedness - Showing and Hiding Spreadsheets 1. (gui-mark-placed formID cellID type) :- Tells Lisp a a mark has been placed in a check mark 2. (gui-split-regions formID cellID rowIndex colIndex) :- Tell Lisp a region is ready to split Arrows/HMT Related - Showing and Hiding Spreadsheets 1. (gui-do-slice formID formID cellID) :- Asks Lisp to display/undisplay a slice on a given cell. 2. (gui-erase-arrow formID CellID StartIdx EndIdx destFormID destCellID destStartIdx destEndIdx) :- Tells Lisp that the user has hidden a single arrow. 3. (gui-help-test formID :cells cellIDList :dupair duPair) :- Specify a form to be used in a GUI help test. 4. (gui-stop-help-test status ’formID) :- Ceases a help test session for a given spreadsheet. Transcription - Controls Transcripting Oriented Features 1. (transcript-start name) :- Asks Lisp to start a transcript file with the given name 2. (transcript-stop) :- Asks Lisp to stop any running transcript files 3. (transcript-transcribe text) :- Tells the engine to add a string message to the transcript 4. (load-all-policies fileName T) :- Asks Lisp to load the given policy file Cell Manipulation - Working with individual cells 1. (gui-name-cell formID cellID name) :- Asks Lisp to rename a cell. 2. (gui-cell-set-formula formID cellID formula) :- Asks Lisp to set a cell’s formula. 3. (gui-xlcell-set-formula formID cellID formula dependents w/new values) :- Asks Lisp to set a cell’s formula. Assertions - Assertion-related Messages 1. (gui-set-assertion formID roCellID status) :- Tells the Engine to change the assertion(s) on a cell. 2. (gui-assertion-parser formID roCellID result) :- Tells the Engine to create a new assertion. 3. (gui-assertion-priorityset formID roCellID assertionID priority radioBoxChoice) :- Set priority of an assertion. 67
4. (gui-remove-hmt-assertions ’formID’) :- Removes Help Me Test Assertions for a given spreadsheet. 5. (gui-send-assertion-conflict-and-violation-list) :- Requests that the engine send us a list of all cells that are in value violation and assertion conflict. 6. (gui-assertion-posted formID cellID isPosted) :- Informs Lisp that an assertion is posted.
12.2
From Backend to Frontend Specification
WYSIWYT - Testedness Features 1. (Update-Form-Testedness) - Show the testedness of a Workbook. 2. (Update-Ro-Testedness) - Show the testedness of a cell or region. 3. (Update-Ro-Checkbox-Status) - Show the status of a checkbox. Overall - Overall disabling/enabling of features 1. (LoginOk) - Accepted login. 2. (LoginFailed) - Login was not accepted. 3. (NameForm) Assertions - Placement and Control of Assertions 1. (DisplayAssertion) - Show an assertion. 2. (RemoveAssertion) - Hide an assertion 3. (AssertionValueConflicted) - Show a conflict. 4. (Assertion-display-order) Cells - Control of Cells and Regions 1. (NameCell) - maps worksheet names to IDs 2. (SetFormula) - sets a formula for HMT. 3. (NameRegion) - regionID memberCells Arrows - Drawing Arrows Features 1. (Draw-Arrow) 2. (Erase-Arrow) 3. (Erase-Ro-Arrows) 4. (Update-Arrow-Testedness) Fault Likelihood - Visualization of faultiness 1. (Update-Ro-Fault-Likelihood) 2. (Update-Fl-Overview) Policy - Enabling and disabling of GUI features. 1. (UpdateEnabledWidgets) 68
2. (UpdateEnabledTools) 3. (UpdateTooltipTranscript) HMT - The test-case generation system. 1. (HmtStopped) 2. (HmtStarted) 3. (HmtMessage) Explanations - Subsystem to keep tooltips up to date. 1. (UpdateToolTip)
69