Aug 13, 2010 - OC] 13 Aug 2010. Scheduling in Parallel Queues with Randomly Varying Connectivity and Switchover Delay. Guner D. Celik, Long B. Le and ...
Scheduling in Parallel Queues with Randomly Varying Connectivity and Switchover Delay Guner D. Celik, Long B. Le and Eytan Modiano
arXiv:1008.2347v1 [math.OC] 13 Aug 2010
Abstract We consider a dynamic server control problem for two parallel queues with randomly varying connectivity and server switchover time between the queues. At each time slot the server decides either to stay with the current queue or switch to the other queue based on the current connectivity and the queue length information. The introduction of switchover time is a new modeling component of this problem, which makes the problem much more challenging. We develop a novel approach to characterize the stability region of the system by using state action frequencies, which are stationary solutions to a Markov Decision Process (MDP) formulation of the corresponding saturated system. We characterize the stability region explicitly in terms of the connectivity parameters and develop a frame-based dynamic control (FBDC) policy that is shown to be throughput-optimal. In fact, the FBDC policy provides a new framework for developing throughput-optimal network control policies using state action frequencies. Further, we develop simple Myopic policies that achieve more than 96% of the stability region. Finally, simulation results show that the Myopic policies may achieve the full stability region and are more delay efficient than the FBDC policy in most cases.
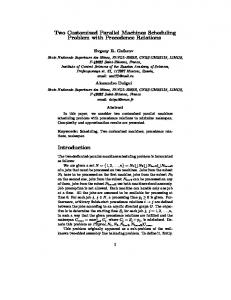
I. I NTRODUCTION Scheduling a dynamic server over randomly varying wireless channels has been a very popular topic since the seminal works by Tassiulas and Ephremides in [28] and [29]. These works were generalized to many different settings by several authors in the network control field (e.g., [8], [14], [18], [20], [21], [26], [34], [35]). However, the significant effect of server switchover time between the queues has been ignored. We consider a parallel queue network with randomly varying connectivity and the server switchover time between the queues and study the impact of the switchover time on the system performance. Our model consists of two parallel queues whose connectivity is varying in time according to a stochastic process and one server receiving data packets from the queues by dynamically adjusting its position as shown in Fig. 1. We consider a slotted system where the slot length is equal to a packet transmission time and it takes one slot for the server to switch from one queue to the other. A packet is successfully received from queue-i if queue-i is connected, if the server is present at queue-i and if it decides to stay at queue-i. Therefore, the server is to dynamically choose to stay with the current queue or switch to the other queue based on the connectivity and the queue length information of both queues. To the best of our knowledge, this paper is the first to consider random connectivity and switchover times to be simultaneously present in the system. Our purpose is to characterize the effect of switchover time on system performance. In particular, we are interested in the impact of the switchover time on the maximum throughput region (or the throughput region for simplicity) and to find the optimal scheduling policy for the server that stabilizes the system whenever the arrivals are within the throughput region. Switchover delay in dynamic server control problems is a widespread phenomenon that can be observed in many practical systems. In satellite systems where a mechanically steered antenna is providing service to ground stations, the time to switch from one station to another can be around 10ms [4], [30]. Similarly, the delay for electronic beamforming can be on the order of 10µs in wireless radio systems [4], [30]. Furthermore, in optical communication systems tuning delay for transceivers can take significant time (µs-ms) [5], [17]. We show in this paper that switchover delay indeed fundamentally changes the system characteristics. As compared to the seminal work of Tassiulas and Ephremides in [29], the supported rate region shrinks considerably, the optimal policies change and novel mathematical approaches might be necessary for systems with nonzero switchover delay.
λ2
λ1
ts C1
C2 Server
Fig. 1: System model. Two queues with randomly varying connectivities (C1 and C2 ) and ts = 1 slot switchover time. The server is currently connected to queue-1 and it takes 1 time slot to switch to queue-2.
2
Note that the switchover time can be smaller or larger than a packet transmission duration in practical systems. In systems where it is less than 1 slot, when the server switches from one queue to another, it usually has to waste the entire slot due to synchronization issues. For systems with significant switching times (e.g., vehicular networks with mobile relays), our analysis can be used as a starting point while keeping in mind that similar solution techniques will apply. Finally note that some of our results, in particular the FBDC policy, and the throughput region characterization in terms of state action frequencies hold for more general systems such as many queues with arbitrary switchover times and channel statistics. We analytically characterize the throughput region Λ: The set of all arrival rate pairs (λ1 , λ2 ) that the system can stably support. We derive necessary and sufficient stability conditions on the arrival rate pairs (λ1 , λ2 ) in terms of the connectivity parameters for both correlated and uncorrelated connectivity processes. For this, we consider the corresponding saturated system in which there is always a packet to send in both queues and we formulate a discrete time Markov Decision Process (MDP) whose stationary deterministic solutions in terms of state action frequencies provide corner points of the polytope of achievable rates, i.e., the throughput region. We develop a frame based dynamic control (FBDC) policy for the original system with dynamic arrivals. FBDC policy is based on solving a Linear Programm (LP) corresponding to the MDP solution for the saturated system and it is throughput-optimal asymptotically in the frame length. FBDC policy is applicable to many general systems and provides a new framework for developing throughput-optimal policies for network control. Namely, for any system whose corresponding saturated system is Markovian with finite state space, FBDC policy achieves stability by solving an LP to find the stationary MDP solution of the saturated system and applying this solution over a frame in the actual system. We also develop simple Myopic policies with throughput guarantees that do not require the solution of an LP and that can be more delay efficient than the FBDC policy. We show that the Myopic policy with “one lookahead” achieves at least 90% of the throughput region while the Myopic policies with 2 and 3-lookahead achieve more than 94% and 96% of the stability region respectively. The mathematical solution technique used for proving the stability of various policies is novel in this paper in that it involves utilizing Markov Decision Theory inside the Lyapunov stability arguments. Optimal control of queueing systems and communication networks has been a very active research topic over the past two decades. In the the seminal paper [28], Tassiulas and Ephremides characterize the stability region and propose the well-known max-weight scheduling algorithm. Later in [29], they consider a parallel queueing system with randomly varying connectivity and prove the throughput-optimality of the Longest-Connected-Queue scheduling policy. These results are extended to the joint power allocation and routing problem in wireless networks in [20] and [21] and the optimal scheduling problem for switches in [24] and [26]. Decentralized and greedy scheduling algorithms with throughput guarantees are studied in [6], [7], [14], [34], while [8] and [18] consider distributed algorithms that achieve throughput-optimality (see [9] for a detailed review). In [11], [25] and [35] the network control problem with delayed channel state information is studied, while [1] and [13] investigate network control with limited channel sensing. These existing works do not consider the server switchover times. Scheduling in optical networks under reconfiguration latency was considered in [5], where the transmitters and receivers were assumed to be unavailable during the system reconfiguration time. While switchover delay has been studied in polling models in the queueing theory community (e.g., [2], [12], [15], [31]), random connectivity was not considered since it may not arise in classical polling applications. To the best of our knowledge, this paper is the first to simultaneously consider random connectivity and server switchover times. The main contribution of this report is solving the scheduling problem in parallel queues with randomly varying connectivity and server switchover times for the first time. In particular, • We establish the stability region of the system using the state action frequencies of the MDP formulation for the corresponding saturated system. Furthermore, we characterize the stability region explicitly in terms of the connectivity parameters. • We develop a frame-based dynamic control (FBDC) policy and show that it is throughput-optimal asymptotically in the frame length. The FBDC policy is applicable to more general systems whose corresponding saturated system is Markovian with finite state and action spaces, for example, networks with more than two queues, arbitrary switchover times and general arrival and Markov modulated channel processes. • We develop a simple 1-Lookahead Myopic policy that achieves at least 90% of the stability region while the Myopic policies with 2 and 3-lookahead achieve more than 94% and 96% of the stability region respectively. • We present simulations suggesting that the Myopic policies may be throughput-optimal and are more delay efficient than the throughput-optimal FBDC policy in most cases. This paper provides a novel framework for solving network control problems via characterizing the stability region in terms of state action frequencies and achieving throughput-optimality by utilizing the state action frequencies over frames. In the next section we introduce the system model and in Section III we provide a motivating example by analyzing the case with uncorrelated channel processes over time. We establish the throughput region in Section IV via formulating a MDP for the saturated system. We prove the throughput optimality of the FBDC policy in Section V and analyze simple Myopic policies with large throughput guarantees in Section VI. We provide simulation results in Section VII and conclude in Section VIII.
3
1−ǫ
ǫ
ON
1−ǫ OFF
ǫ Fig. 2: Markov modulated ON/OFF channel process. We have ǫ ≤ 0.5 for positive correlation.
II. T HE M ODEL Consider two parallel queues with randomly varying connectivity and one server receiving data packets from the queues. Time is slotted into unit-length time slots equal to one packet transmission time; t ∈ {0, 1, 2, ...}. It takes one slot for the server to switch from one queue to the other, and m(t) denotes the queue at which the server is present at slot t. Let the stationary stochastic process Ai (t), with average arrival rate λi , denote the number of packets arriving to queue i at time slot t where E[A2i (t)] ≤ A2max , i ∈ {1, 2}. Let C(t) = (C1 (t), C2 (t)) be the channel (connectivity) process at time slot t, where Ci (t) = 0 for the OFF state (disconnected) and Ci (t) = 1 for the ON state (connected). We assume that the processes A1 (t), A2 (t), C1 (t) and C2 (t) are independent. We analyze two different models for the connectivity process C(t): Definition 1 (Uncorrelated Channels [20], [22], [29]): The process Ci (t), i ∈ {1, 2}, is in ON state with probability (w.p.) pi and in OFF state w.p. 1 − pi at each time slot independently from earlier slots and of the other queue. Definition 2 (Correlated Channels [1], [13], [33], [36]): The process Ci (t), i ∈ {1, 2}, follows the two-state Markov chain (i.e., the symmetric Gilbert-Elliot channel model) with transition probability ǫ as shown in Fig. 2 independently of the other queue. G-E channel model has been widely accepted in modeling and analysis of wireless systems [1], [13], [33], [36], [37]. Note that our results and algorithms are applicable to general non-symmetric channel models, but here we present the symmetric case for ease of exposition. Let Q(t) = (Q1 (t), Q2 (t)) be the queue lengths at time slot t. We assume that Q(t) and C(t) are known to the server at the beginning of each time slot. Let at ∈ {0, 1} denote the action taken at slot t, where at = 1 if the server stays with the current queue and at = 0 if it switches to the other queue. One packet is successfully received from queue i at time slot t, if m(t) = i, at = 1 and Ci (t) = 1. Definition 3 (Strong Stability): A queue is called strongly stable if : t−1
1X E[Q(τ )] < ∞. lim sup t→∞ t τ =0
In addition, the system is called strongly stable (or stable for simplicity) if both queues are stable. Definition 4 (Stability Region): The stability region Λ is the set of all arrival rate vectors (λ1 , λ2 ) such that there exists a control algorithm that stabilizes both queues in the system. n o The δ-stripped stability region is defined for some δ > 0 as Λδ , (λ1 , λ2 )|(λ1 + δ, λ2 + δ) ∈ Λ . A policy is said to achieve γ-fraction of Λ, if it stabilizes the system for all input rates inside γΛ. A throughput-optimal policy achieves γ = 100% of the stability region. III. M OTIVATION -U NCORRELATED C HANNELS In this section we show that there is no diversity gain when the channel processes are i.i.d. over time and that channel correlation over time is necessary in order to take advantage of the diversity gain and enlarge the throughput region. Specifically, we show that when the channel processes are i.i.d. over time, the stability region is reduced considerably with respect to the no-switchover time case, and no policy can achieve a stability region larger than that of the simple Exhaustive or Gated type policies. Gated policy is such that the server serves all the packets that were present at the queue at the time of arrival and then switches to the other queue. In the Exhaustive policy, the server does not leave the current queue until it empties. Assume the channel processes C1 (t) and C2 (t) are as described in Definition 1. We first derive a necessary condition on the stability of the system and then show the sufficiency of this condition by proving that gated policy stabilizes the system under this condition. Theorem 1: A necessary condition on stability is given by: ρ=
λ1 λ2 + < 1. p1 p2
(1)
The proof for a more general system is given in Appendix A. Since both queues have memoryless channels, for any received packet from queue-i, as soon as the server switches to queue i, the expected time to ON state is 1/pi . Namely, the time to ON state is a geometric random variable with parameter pi . Hence, the effect of i.i.d. connectivity is such that this geometric
4
λ2 0.5
no-switchover time Markovian channels
i.i.d. channels
0.5
λ1
Fig. 3: Stability region under uncorrelated (i.i.d.) and correlated (Markovian) channels with and without switchover time.
random variable is essentially the “service time per packet” for queue-i. Note that we call the term λ1 /p1 + λ2 /p2 the system load, ρ, since it is the rate with which the work is entering the system in the form of service slots. In a multiuser single-server system with or without switchover times, with stationary arrivals whose average arrival rates are λi , i ∈ {1, 2}, and i.i.d. service times independent of the arrivals with average service times 1/pi , i ∈ {1, 2}, a necessary condition for stability is given by the system load, ρ, less than 1. To see this, the stability region of the polling system with zero switchover times is an upperbound on the stability region of the corresponding system with nonzero switchover times. Finally, a necessary condition for the stability of the former system is ρ = λ1 /p1 + λ2 /p2 < 1, (e.g., [32]). Next we show that the stability condition in (1) is also sufficient. Gated Policy: Serve all the packets that are present at a queue upon arrival at the queue. Theorem 2: Gated policy together with cyclic order of service for the server stabilizes the system as long as ρ < 1. The proof for a more general system is given in Appendix B. It is based on a Lyapunov stability argument over a cycle duration. Namely, we let m be the discrete time index for the mth time the server stops for servicing a queue and let Tm be the time slot number of this server-queue meeting times Let I(m) be the i.d. of the node that the mobile serves at time Tm and let S(QI(m) (Tm )) be the service time required to serve QI(m) (Tm ) packets at time Tm . Under Gated service the server serves all QI(m) (Tm ) messages, therefore, S(QI(m) (Tm )) is the summation of QI(m) (Tm ) independent geometric random variables of parameter pI(m) . We have the following queue evolution: 2 X i=1
2 Tm+1 2 X−1 X X Ai (t)−QI(m) (Tm ) Qi (Tm+1 ) = Qi (Tm ) +
(2)
i=1 τ =Tm
i=1
where Tm+1 = S(QI(m) (Tm )) + 1 with additional 1 due to switchover delay. We use the following linear Lyapunov function: L(Q(Tm )) =
2 X Qi (Tm ) i=1
pi
.
(3)
Given the current queue sizes, this Lyapunov function represents the expected amount of service slots needed to serve the packets present in both queues. We define the drift over one cycle as ∆(Tm ) , E {L(Q(Tm+2 )) − L(Q(Tm ))|Q(Tm )} . Using (18) and (3) one can show that the drift over the cycle is negative if 2 X Qi (Tm ) i=1
pi
>ρ
2 . 1−ρ
(4)
2 To understand the intuition behind this condition, first note that 1−ρ is the expected cycle time in the system in steady state 2 (in general the expected cycle time is the total travel time per cycle divided by 1 − ρ) [27]. Hence, ρ 1−ρ denotes the expected P2 Qi (Tm ) increase in system work load over one cycle. Therefore, (25) argues that if i=1 pi , a lower bound on the expected decrease in system work load over one cycle, is greater than the expected increase in system load over one cycle, then the system is stable. Therefore, the throughput region of the system is given by o n λ1 λ2 + ≤1 . (5) Λ = (λ1 , λ2 ) p1 p2
For the case of two parallel queues, the throughput region of the system without switchover delay analyzed in [29], Λns , is
5
given by
n o Λns= (λ1 , λ2 ) λ1 ≤ p1 , λ2 ≤ p2 , λ1 + λ2 ≤ p1 + p2 (1 − p1 ) .
(6)
These two regions are displayed in Fig. 3 for the case of p1 = p2 = 0.5. The stability region of the system without switchover time shrinks considerably when there is switchover delay. Note that for the case of deterministic channels, (C1 (t) = C2 (t) = 1, ∀t), the systems with or without switchover times have the same stability region λ1 +λ2 < 1 1 . Therefore, there is a significant throughput loss due to switchover delay when the channel processes are i.i.d. over time. Therefore, it is the combination of switchover delay and random connectivity that result in fundamental changes in system behavior. Remark 1: Note that the results of this section hold for more general systems; namely, for systems with N queues and arbitrary switchover times between the queues (switchover time from some queue-i to queue-j given by a constant dij ≥ 1 slots). The stability region in this case is given by λ1 /p1 + ... + λN /pN ≤ 1. With Markovian channels, it is clear that one can achieve better throughput region than the i.i.d. channels case if the channels are positively correlated over time. This is because we can exploit the channel diversity when the channel states stay the same with high probability. In the following, we show that indeed the throughput region approaches the throughput region of no switchover time case in in [29] as the channels become more correlated over time. Note that the throughput region in [29] is the same for both i.i.d. and Markovian channels under the condition that probability of ON state for the i.i.d. channels is the same as the steady state probability of ON state for the two state Markovian channels. This fact can be derived as a special case of the seminal work of Neely in [21]. IV. S TABILITY R EGION - C ORRELATED C HANNELS In this and the following sections we analyze the system under correlated channels assumption. Assume the channel processes C1 (t) and C2 (t) are according to Definition 1. We analytically derive an upper bound on the throughput region of the system (necessary conditions on λ1 and λ2 for stability) via analyzing the corresponding system with saturated queues. As we show in Section V, the necessary conditions derived in this section are also sufficient and hence the region established in this section is the throughput region of the system. When switchover times are non-zero, channel correlation impacts the stability region considerably. In particular, channel correlation can be exploited to improve the throughput of the system. Moreover, as ǫ → 0, the stability region tends to that achieved by the system with no-switchover time and for 0 < ǫ < 0.5 it lies between the stability regions corresponding to the two extreme cases ǫ = 0.5 and ǫ → 0 as shown in Fig. 3. We start by analyzing the corresponding system with saturated queues, i.e., both queues are always non-empty. Let Λs denote the set of all time average expected departure rates that can be obtained from the two queues in the saturated system under all possible policies that are possibly history dependent, randomized and non-stationary. We will show that Λ = Λs . We prove the necessary stability conditions in the following Lemma and establish sufficiency in the next section. Lemma 1: We have Λ ⊆ Λs . Proof: Given a policy π for the original system specifying the switch and stay actions based possibly on observed channel and queue state information, consider the saturated system with the same sample path of channel realizations for t ∈ {0, 1, 2, ...} and the same set of actions as policy π at each timXe slot t ∈ {0, 1, 2, ...}. Let this policy for the saturated system be π ′ . Let Di (t), i ∈ {1, 2} be total number departures by time t from queue-i in the original system under policy π and let Di′ (t), i ∈ {1, 2} be the corresponding quantity for the saturated system under policy π ′ . It is clear that limt→∞ (D1 (t) + D2 (t))/t ≤ 1, where the same statement also holds for the limit of Di′ (t), i ∈ {1, 2}. Since some of the ON channel states are wasted in the original system due to empty queues, we have D1 (t) ≤ D1′ (t), and, D2 (t) ≤ D2′ (t).
(7)
Therefore, the time average expectation of Di (t), i ∈ {1, 2} is also less than or equal to the time average expectation of Di′ (t), i ∈ {1, 2}. This completes the proof since (7) holds under any policy π for the original system. Now, we derive the region Λs by formulating the system dynamics as a Markov Decision Process (MDP). Let st = (m(t), C1 (t), C2 (t)) ∈ S denote the system state at time t where S is the set of all states. Also, let at ∈ A = {0, 1} denote the action taken at time slot t where A is the set of all actions at each state. Let H(t) = C(τ )|tτ =0 denote the full history of the channel processes until time t. For a saturated system, a policy is a mapping from H(t) to the set of all probability distributions on actions at ∈ {0, 1}. This definition includes randomized policies that choose at randomly at a given state st . 1 Throughput region of a general N-queue polling system with stationary arrivals of rates λ , i ∈ 1, ..., N , i.i.d. service processes of mean service times i PN s1 , ..., sN and finite travel times Dij between queues i and j is given by ρ = i=1 λi si < 1 (see e.g., [27]). Therefore, in the absence of random connectivity, finite travel times do not affect the stability region. To see this, considering the system under the optimal Gated Policy, with arrival rates close to the boundary of the stability region, the fraction of times the server spends receiving packets dominates the fraction of time spent on travel.
6
A stationary policy is a policy that depends only on the current state. In each time slot t, the server observes the current state st and chooses an action at . Then the next state j is realized according to the transition probabilities P(j|s, a), which depend on the random channel processes. Now, we define the reward functions as follows: r1 (st , at ) = 1 if st=(1, 1, 1) or st=(1, 1, 0), and at=1 r2 (st , at ) = 1 if st=(2, 1, 1) or st=(2, 0, 1), and at=1,
(8) (9)
and r1 (st , at ) = r2 (st , at ) = 0 otherwise. That is, a reward is obtained when the server stays at an ON channel. We are interested in the set of all possible time average expected departure rates, therefore, given some α1 , α2 ≥ 0, define the system reward at time t as r(st , at ) = α1 r1 (st , at ) + α2 r2 (st , at ). The average reward of policy π is defined as K o 1 nX r(st , aπt ) . E K→∞ K t=1
rπ = lim
Given some α1 , α2 ≥ 0, we are interested in the policy that achieves the maximum time average expected reward r∗ = maxπ rπ . This optimization problem is a discrete time MDP characterized by the state transition probabilities P(j|s, a) with 8 states and 2 actions per state. Furthermore, under every policy, the underlying Markov chain that describes the system state evolution has a single recurrent class plus possibly a set of transient states. Note that we eliminate the policy that switches in all 8 states and achieves 0 total average rate. Therefore this MDP belongs to the class of Unichain MDPs [23]. For Unichain MDPs with finite state and action spaces, we can define the state-action polytope, X, as the set of 16-dimensional vectors x that satisfy the balance equations X X � x(s; 1) + x(s; 0) = P s|s′ , a x(s′ ; a), ∀ s ∈ S, (10) s′ a∈{0,1}
the normalization condition X
x(s; 1) + x(s; 0) = 1,
(11)
s
and the nonnegativity constraints
x(s; a) ≥ 0, for s ∈ S, a ∈ A.
(12)
Note that x(s; 1) can be interpreted as the stationary probability that action stay is taken at state s. More precisely, a point x ∈ X corresponds to a randomized stationary policy that takes action a ∈ {0, 1} at state s w.p. P(action a at state s) =
x(s; a) , a ∈ A, s ∈ Sx , x(s; 1) + x(s; 0)
(13)
where Sx is the set of recurrent states given by Sx ≡ {s ∈ S : x(s; 1) + x(s; 0) > 0}, and actions are arbitrary for transient states s ∈ S/Sx [23, Theorem 8.8.6]. Furthermore, every policy has a unique limiting average state action frequency in X regardless of the initial state distribution [23, Theorem 8.9.3]. Therefore, given any policy, there exists a stationary randomized policy with the same limiting state action frequencies [23]. These facts imply that when searching for the optimal policies, one can restrict attention to stationary randomized policies as in (13) for x ∈ X. The following linear transformation of the state-action polytope X defines the reward polytope [16]: {(r 1 , r2 ) r1 = x.r1 , r 2 = x.r2 , x ∈ X}, where (.) denotes the vector inner product and r1 and r2 are the 16-dimensional reward functions defined in (8) and (9). This polytope is the set of all time average expected departure rate pairs that can be obtained in the saturated system, i.e., it is the rate region Λs . An explicit way of deriving Λs is given in Algorithm 1. Algorithm 1 Stability Region Characterization 1:
Given α1 , α2 ≥ 0, solve the following Linear Program max x
α1 r 1 + α2 r 2
subject to 2:
x ∈ X.
(14)
For a given α2 /α1 ratio, the optimal solution (r ∗1 , r ∗2 ) of the LP in (14) gives one of the corner points of Λs . Find all possible corner points and take their convex combination.
The following lemma is useful for finding the solutions of the above LP for all possible α2 /α1 ratios [23, Corollary 8.8.7].
7
0.5
0.5
b0
λ1 = (1−ε)2/4 λ = 0.5−ε/4
0.45
0.45 2
λ1 = 3/8 − (7ε−4ε )/(8(2−ε)) λ2 = 3/8 − ε/(8(2−ε)) λ1 + λ2= 3/4
2
0.4
ελ1 + (1−ε)2λ2= (1−ε)2/2
0.4
0.35
b1
(1−ε)λ1 + (1+ε−ε2)λ2= 3/4−ε/2 λ2
0.3
0.25
0.25
λ1 + λ2= 3/4−ε/2 0.2
0.2
0.15
0.15 With Switchover Delay Without Switchover Delay
0.1
λ1 + λ2= 3/4−ε/2
b2
With Switchover Delay Without Switchover Delay
0.1
0.05 0
λ1 + λ2= 3/4
2
0.35
0.3 λ2
λ1 = 3/8 − (7ε−4ε2)/(8(2−ε)) λ = 3/8 − ε/(8(2−ε))
λ1 + (1−ε)(3−2ε)λ2= (1−ε)(3−2ε)/2
0.05
0
0.05
0.1
0.15
0.2
0.25 λ1
0.3
0.35
0.4
0.45
0
0.5
b3 0
0.05
0.1
0.15
0.2
0.25 λ1
0.3
0.35
0.4
0.45
0.5
(b)
(a)
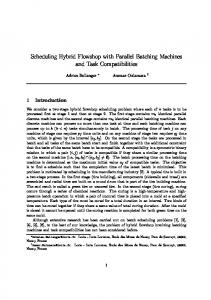
Fig. 4: Stability region under correlated channels with and without switchover time for (a) ǫ = 0.25 < ǫc and (b) ǫ = 0.40 ≥ ǫc .
Lemma 2: Suppose x is a vertex for the LP in (14), then the stationary randomized policy corresponding to x, as defined in (13), is a deterministic policy. Conversely, for any stationary deterministic policy, the stationary distribution of states induced by the policy is a vertex for the LP in (14). The intuition behind this lemma is as follows. For simplicity assume all states are recurrent. Note that the more general case can be argued similarly. Now suppose x ∈ X, i.e., x(s, a) ≥ 0, s ∈ S, a ∈ A, and x satisfies all the equality constraints in (10) and (11) out of which only 8 are linearly independent. For a 16 dimensional vector x ∈ X to be a vertex, we need to have at least 16 linearly independent active constraints at x. If x corresponds to a deterministic policy, then either x(s, 1) or x(s, 0) has to be zero. This gives at least |S| = 8 more linearly independent active constraints at x, satisfying the vertex condition. Therefore, the corners of the rate polytope Λs are given by stationary deterministic policies. There are a total of 28 stationary deterministic policies since we have 8 states and 2 actions per state. Hence, finding the rate pairs corresponding to the 256 deterministic policies and taking their convex combination gives Λs . Fortunately, we do not have to go through this tedious procedure. The fact that at a vertex of (14) either x(s; 1) or x(s; 0) has to be zero for each s ∈ S provides a useful guideline for analytically solving this LP. The following theorem, proved in Appendix C, is based on this solution to find the corners of Λs and then applying Algorithm 1. It is one of key results of this paper characterizing the stability region explicitly. √ Theorem 3: The rate region Λs is the set of all arrival rates λ1 ≥ 0, λ2 ≥ 0 that for ǫ < ǫc = 1 − 2/2 satisfy ǫλ1 + (1 − ǫ)2 λ2
≤
(1 − ǫ)λ1 + (1 + ǫ − ǫ2 )λ2
≤
λ1 + λ2
≤
(1 + ǫ − ǫ2 )λ1 + (1 − ǫ)λ2
≤
(1 − ǫ)2 λ1 + ǫλ2
≤
and for ǫ ≥ ǫc satisfy
(1 − ǫ)2 2 3 ǫ − 4 2 3 ǫ − 4 2 3 ǫ − 4 2 (1 − ǫ)2 , 2
(1 − ǫ)(3 − 2ǫ) 2 3 ǫ λ1 + λ2 ≤ − 4 2 (1 − ǫ)(3 − 2ǫ) (1 − ǫ)(3 − 2ǫ)λ1 + λ2 ≤ . 2 The stability regions for these two ranges of ǫ are displayed in Fig. 4 (a) and (b). As ǫ → 0.5, the stability region converges to that of the i.i.d. channels with ON probability equal to 0.5. In this regime, knowledge of the current channel state is of no value. As ǫ → 0 the stability region converges to that for the system with no-switchover time in [29]. In this regime, the channels are likely to stay the same in several consecutive time slots, therefore, the effect of switching delay is negligible. Remark 2: Stability region expressions in terms of the channel parameter ǫ are for two parallel queues, two-state Markovian channels and one slot switching time. However, the technique used for characterizing the stability region in terms of the state action frequencies is general. For instance, this technique can be used to find the stability region of systems with more than two queues, arbitrary switchover times, and more complicated Markovian channel processes. λ1 + (1 − ǫ)(3 − 2ǫ)λ2
≤
8
As we stated before, the corner points of the polytope Λs correspond to deterministic policies. We observe that the 4 corner points of the rate region polytope for ǫ ≥ ǫc case are also present in the rate region polyopte for ǫ < ǫc case. One of the two additional corners for the ǫ < ǫc case, namely, the policy for the corner point (r1 , r2 ) = ((1 − ǫ)2 /4, (2 − ǫ)/4), corresponds to the following deterministic policy: At queue-1: stay only at (C1 , C2 ) = (1, 0) and switch in all other states and at queue-2: switch only at (C1 , C2 ) = (1, 0) and stay at all other states. The critical point is that this policy decides to switch at queue-1 when the channels are (C1 , C2 ) = (1, 1), which does not provide a vertex for the rate region for ǫ ≥ ǫc . Analytically, this is because (r1 , r2 ) = ((1 − ǫ)2 /4, (2 − ǫ)/4) is within the convex combination of the 4 vertices of the rate region for ǫ ≥ ǫc . The intuitive reason behind this is that as ǫ increases, the predictions about the future channel states become less reliable. Therefore, as ǫ increases, switching at (C1 , C2 ) = (1, 1) at queue-1 for future ON channel states at queue-2 becomes less preferable than a successful transmission available at queue-1 in the current slot. V. F RAME BASED DYNAMIC C ONTROL P OLICY We propose a frame-based dynamic control (FBDC) policy inspired by the state action frequencies and prove that it is throughput-optimal asymptotically in the frame length. The motivation behind the FBDC policy is that a policy π ∗ that achieves the optimization in (14) for given weights α1 and α2 for the saturated system, should achieve a good performance also in the original system when the queue sizes Q1 and Q2 are used as weights. This is because first, the policy π ∗ will lead to similar average departure rates in both systems for sufficiently high arrival rates, and second, the usage of queue sizes as weights creates self adjusting policies that capture the dynamic changes due to stochastic arrivals. This is similar to the structure of the celebrated max-weight scheduling in [28]. Specifically, divide the time into equal-size intervals of T slots and let Q1 (jT ) and Q2 (jT ) be the queue lengths at the beginning of the jth interval. We find the deterministic policy that optimally solves (14) when Q1 (jT ) and Q2 (jT ) are used as weights and then apply this policy in each time slot of the frame. The FBDC policy is described below in details. Algorithm 2 F RAME BASED DYNAMIC C ONTROL (FBDC) P OLICY 1:
Find the optimal solution to the following Linear Program max.{r1 ,r2 } subject to
2:
Q1 (jT )r1 + Q2 (jT )r2 (r1 , r2 ) ∈ Λs
(15)
where Λs is the rate polytope derived in Section IV. The optimal solution (r1∗ , r2∗ ) in step 1 is a corner point of Λs that corresponds to a stationary deterministic policy denoted by π ∗ . Apply π ∗ in each time slot of the frame.
Theorem 4: The FBDC policy stabilizes the system as long as the arrival rates (λ1 , λ2 ) are within the δ-stripped stability region Λδs where δ(T ) is a decreasing function of T . The proof is given in Appendix D. It performs a drift analysis using the standard quadratic Lyapunov function. However, it is novel in utilizing an MDP framework in Lyapunov drift arguments. The basic idea is that when the optimal policy solving (15), π ∗ , is applied over a sufficiently long frame of T slots, the average output rates of both the actual system and the corresponding saturated system converge to r∗ . For the saturated system, the difference between empirical rates and r∗ is essentially due to the convergence of the Markov chain induced by policy π ∗ to its steady state, which is exponentially fast in T [16]. Therefore, for sufficiently large queue lengths, the difference between the empirical rates in the actual system and r∗ also decreases with T . This ultimately results in a negative Lyapunov drift when λ is inside the δ(T )-stripped stability region since from (15) we have Q(jT ).r∗ ≥ Q(jT ).λ. The parameter δ(T ), capturing the difference between the stability region of the FBDC policy and Λs , is related to the mixing time of the system Markov chain and is a decreasing function of T . This establishes that the FBDC policy is asymptotically optimal and that Λ = Λs . Moreover, as also suggested by the simulation results in Section VII, δ(T ) is negligible even for relatively small values of T . The FBDC policy is easy to implement since it does not require the solution of the LP for each frame. Instead, we can solve the LP for all possible Q2 (t)/Q1 (t) values only once in advance and create a mapping from the Q2 (t)/Q1 (t) values to the corner points of the stability region. Then, we can use this mapping to find the corresponding optimal policy π ∗ at the beginning of each frame. Such a mapping depends only on the slopes of the lines in the stability region in Fig. 4. Therefore, these mappings are already available and are given in figures 5 and 6. Remark 3: FBDC policy is a generic policy applicable to much more general systems. For instance, it provides throughput optimality for systems with more number of queues, with swithcover time from some queue-i to queue-j given by a constant dij ≥ 1 slots, and with more complicated Markov modulated channel structures. FBDC can also be used to achieve stability for classical network control problems such the one with no-switchover times analyzed in [29].
9 Q2 Q1 ǫ (1−ǫ)2
1−ǫ 1+ǫ−ǫ2
1
1+ǫ−ǫ2 1−ǫ
(1−ǫ)2 ǫ
d
b3
b4
b5
b1
b2
b0
Fig. 5: Mapping from the queue sizes to the capacity region corner points for the FBDC policy for ǫ < ǫc . 1 (1−ǫ)(3−2ǫ)
(1 − ǫ)(3 − 2ǫ)
1
d
b5
b3
b2
b0
Fig. 6: Mapping from the queue sizes to the capacity region corner points for the FBDC policy for ǫ ≥ ǫc . Remark 4: FBDC policy provides a new framework for developing throughput-optimal policies for network control. Namely, given any queuing system whose corresponding saturated system is Markovian with a finite state space, throughput optimality is easily achieved by solving an LP in order to find the stationary MDP solution of the corresponding saturated system and applying this solution over a frame in the actual system. Note that the FBDC policy does not require the knowledge of the arrival rates, the channel statistics or the capacity region. The mapping in figures 5 and 6 is given in terms of threshold on ǫ since for two queues these values are available. For general networks of many queues and arbitrary switchover times, the corresponding table of mappings from the queue sizes to stationary deterministic policies can be obtained by solving the LP in (14) using the queue sizes (Q1 (jT ), Q2 (jT ) as weights. In the next section we consider Myopic policies that do not require the solution of an LP and provide stability for more than 96% of the stability region. Simulation results in Section VII suggest that the Myopic policies may indeed achieve the full stability region while providing better delay performance than the FBDC policy for most arrival rates. VI. M YOPIC C ONTROL P OLICIES Next, we investigate the performance of simple Myopic policies. We implement these policies in a frame-based fashion where the scheduling/switching decisions during a frame of T time slots are based on queue lengths at the beginning of the frame and channel predictions for a small number of slots into the future. We refer to a Myopic policy considering k future time slots as the k-Lookahead Myopic policy. In the 1-Lookahead Myopic policy, the server chooses the queue with the larger weight where the weight of a queue is the product of the queue length and the expected number of departures in the current and the next slot from the queue. The detailed description of the 1-Lookahead Myopic policy is given below. Algorithm 3 1-L OOKAHEAD M YOPIC P OLICY 1:
Assuming that the server is currently with queue 1 and the system is at the jth frame, calculate the following weights in each time slot of the current frame; � � �� W1 (t) = Q1 (jT ) C1 (t) + E C1 (t + 1)|C1 (t) � � W2 (t) = Q2 (jT )E C2 (t + 1)|C2 (t) . (16)
2:
If W1 (t) ≥ W2 (t) stay with queue one, otherwise, switch to the other queue. A similar rule apply for queue 2.
Next we establish a lower bound on the stability region of the 1-Lookahead Myopic Policy by comparing its drift over a frame to the drift of the FBDC policy. Theorem 5: The 1-Lookahead Myopic policy achieves at least γ-fraction of the stability region Λs asymptotically in T where γ ≥ 90%. The proof is constructive and will be establish in various steps in the following. The basic idea behind the proof is that the 1Lookahead Myopic policy produces a mapping from the set of queue sizes to the stationary deterministic policies corresponding to the corners of the stability region. This mapping is similar to that of the FBDC policy, however, the thresholds on the queue size ratios Q2 /Q1 are determined according to (16). We first show the derivation of this mapping and then bound the difference between the weighted average departure rates of the 1-Lookahead Myopic and the FBDC policies. We refer to the 1-Lookahead Myopic policy as the Myopic policy in the following. Mapping from queue sizes to actions. Case-1: ǫ < ǫc For each corner of the throughput region, we will find the range of coefficients Q1 and Q2 such that the Myopic policy chooses the deterministic actions corresponding to the given corner. We enumerate the corners of the throughput region as b0 , b1 , ..., b5 where b0 is (0, 0.5) and b5 is (0.5, 0). Corner b0 :
10
Optimal actions are to stay at queue-2 for every channel condition. Therefore, the server chooses queue-2 even when the channel state is C1 (t), C2 (t) = (1, 0). Therefore, using (16), for the Myopic policy to take the deterministic actions corresponding to b0 we need Q2 1−ǫ Q1 .(1 − ǫ) < Q2 .(ǫ) ⇒ > . Q1 ǫ This means that if we apply the Myopic policy with coefficients Q1 , Q2 such that Q2 /Q1 > (1 − ǫ)/ǫ, then the system output rate will be driven towards the corner point b0 (both in the saturated system or in the actual system with large enough arrival rates). Corner b1 : The optimal actions for the corner point b1 are as follows: At queue-1, for the channel state 10:stay, for the channel states 11, 01 and 00: switch. At queue-2, for the channel state 10: switch, for the channel states 11, 01 and 00: stay. The most limiting conditions are 11 at queue-1 and 10 at queue-2. Therefore we need, Q1 (2 − ǫ) < Q2 (1 − ǫ) and Q1 (1 − ǫ) > Q2 ǫ. Combining these we have 1−ǫ Q2 2−ǫ < < . 1−ǫ Q1 ǫ √ 2−ǫ Note that the condition ǫ < ǫc = 1 − 2/2 implies that 1−ǫ ǫ > 1−ǫ . Corner b2 : The optimal actions for the corner point b1 are as follows: At queue-1, for the channel state 10 and 11:stay, for the channel states 01 and 00: switch. At queue-2, for the channel states 10: switch, for the channel states 11, 01 and 00: stay. The most limiting conditions are 11 at queue-1 and 00. Therefore we need, Q1 (2 − ǫ) > Q2 (1 − ǫ) and Q1 < Q2 . Combining these we have Q2 2−ǫ 1< < . Q1 1−ǫ The conditions for the rest of the corners are symmetric and can be found similarly to obtain the mapping in Fig. 7.
Mapping from queue sizes to actions. Case-2: ǫ ≥ ǫc In this case there are 4 corner points in the throughput region. We enumerate these corners as b0 , b2 , b3 , b5 where b0 is (0, 0.5) and b5 is (0.5, 0). Corner b0 : The analysis is the same as the b0 analysis in the previous case and we obtain that for the Myopic policy to take the deterministic actions corresponding to b0 we need Q2 1−ǫ > . Q1 ǫ Corner b2 : This is the same corner point as in the previous case corresponding to the same deterministic policy: At queue-1, for the channel state 10 and 11:stay, for the channel states 01 and 00: switch. At queue-2, for the channel states 10: switch, for the 2−ǫ channel states 11, 01 and 00: stay. The most limiting conditions are 10 at queue-2 (since ǫ ≥ ǫc we have 1−ǫ ǫ < 1−ǫ ) and 00. Therefore we need, Q1 (1 − ǫ) > Q2 ǫ and Q1 < Q2 . Combining these we have 1
0 such that P (λ1 , λ2 ) + (ξ, ξ) = 0.9(r1 , r2 ) − (δ5 , δ5 ), for some r = (r1 , r2 ) ∈ Λs . Substituting this expression for (λ1 , λ2 ) and using i Qi (t)(r − ri∗ ) ≤ 0 we have, � �X ∆T (t) Qi (t) ξ. ≤ (B + 2)T − 2T i
Therefore, the system is stable for λ inside at least the 0.9 fraction of δ5 -stripped throughput region where δ5 (T ) is a decreasing function of T . Remark 5: A similar analysis shows that the 2-Lookahead Myopic Policy achieves at least 94% of Λs , while the 3-Lookahead Myopic Policy achieves at least 96% of Λs . The k-Lookahead Myopic Policy is the same as before except that the following weight functions are used for decisions: Assuming the server is with � � Pkqueue� 1 at time slot t, Pkscheduling W1 (t) = Q1 (jT ) C1 (t) + τ =1 E C1 (t + τ )|C1 (t)} and W2 (t) = Q2 (jT ) τ =1 E C2 (t + τ )|C2 (t) .
12
Fig. 9: The total average queue size for (a) the FBDC policy and (b) the Myopic Policy for T = 10 and ǫ = 0.40.
Fig. 10: The total average queue size for (a) the FBDC policy and (b) the Myopic policy for T = 25 and ǫ = 0.25.
13
0.5 0.45 0.4 0.35
λ2
0.3 0.25 0.2 0.15
With Switchover Delay Without Switchover Delay
0.1 0.05 0
0
0.05
0.1
0.15
0.2
0.25 λ1 (a)
0.3
0.35
0.4
0.45
0.5
0.5 0.45 0.4 0.35
λ2
0.3 0.25 0.2 0.15 0.1 0.05 0
0
0.05
0.1
0.15
0.2
0.25 λ1
0.3
0.35
0.4
0.45
0.5
(b)
Fig. 11: Stability region under correlated channels with and without switchover time for (a) ǫ = 0.05 and (b) ǫ = 0.45.
VII. N UMERICAL R ESULTS In this section we present simulation results for the FBDC and the 1-Lookahead Myopic policies. We also present numerical results that show the stability region for different ǫ values. We performed simulation experiments that present average queue occupancy results for the FBDC and the Myopic policies. We first verified the correctness of the simulation model by confirming that the FBDC policy achieves the full stability region in the simulation results and then performed experiments for the 1Lookahead Myopic (OLM) policy. In all the reported results, we have (λ1 , λ2 ) ∈ Λs with 0.01 increments. For each point at the boundary of Λs , we simulated one point outside the stability region. Furthermore, for each data point, the arrival processes were i.i.d., the channel processes were Markovian as in Fig. P 2 and the simulation length was 100,000 slots. Fig. 9 (a) presents the total average queue size, Qavg , 100K t=1 (Q1 (t)+Q2 (t))/t, under the FBDC policy for ǫ = 0.40 > ǫc . The boundary of the stability region is shown by (red) lines on the two dimensional λ1 − λ2 plane. We observe that the average queue sizes are small for all (λ1 , λ2 ) ∈ Λs and the big jumps in queue sizes occur for points outside Λs . Fig. 9 (b) presents the performance of the OLM policy for the same system. The simulation results suggest that there is no appreciable difference between the stability regions of the FBDC and the OLM policies. Note that the total average queue size is proportional to the average delay in the system through Little’s law. For these two figures, the average delay under the OLM policy is less than that under the FBDC policy for 86% of all arrival rates considered. For the same system we also simulated a non-frame-based Myopic policy that utilizes the queue length information in the current time slot for the weight calculations in (16). This implementation of the OLM policy preserves a similar stability region to Fig. 9 (b) while having delay results at most as much as the FBDC policy for 96% of all arrival rates. When the current queue lengths are used in the scheduling decisions, the Myopic policy adapts to changes in the system dynamics more quickly, therefore, better delay performance is expected. Fig. 10 (a) shows the total average queue size under (a) the FBDC policy and (b) the OLM policy for ǫ = 0.25 < ǫc . Again this result suggest that the OLM policy is achieving the full stability region. In this case the regular and the non-frame-based implementations of the OLM policy outperformed the FBDC policy in terms of delay for 81% and 96% of all arrival rates considered respectively. These delay results show that the OLM policy is not only simpler to implement than the FBDC policy, but it can also be more delay efficient. Figures 11 (a) and (b) displays the stability region of the system for ǫ = 0.05 and ǫ = 0.45 respectively. For very small channel correlation (ǫ → 0.5) the stability region tends to that of the i.i.d. channels case, whereas for very large channel correlation (ǫ → 0) the stability region approaches that of the no-switchover time case analyzed in [29]. Fig. 12 (a) shows the total average queue size under (a) the FBDC policy and (b) the OLM policy for ǫ = 0.10 < ǫc . Again this result suggest that the OLM policy is achieving the full stability region. In this case the regular and the non-frame-based implementations of the OLM policy outperformed the FBDC policy in terms of delay for 47% and 91% of all arrival rates considered respectively. This suggest that the delay advantage of the Myopic policies are less pronounced for highly correlated channels.
14
Fig. 12: The total average queue size for (a) the FBDC policy and (b) the Myopic policy for T = 20 and ǫ = 0.10.
Fig. 13: The total average queue size for (a) the FBDC policy and (b) the Myopic policy for T = 50 and ǫ = 0.30.
15
Fig. 13 (a) shows the total average queue size under (a) the FBDC policy and (b) the OLM policy for ǫ = 0.30 ≃ ǫc . In this case the regular and the non-frame-based implementations of the OLM policy outperformed the FBDC policy in terms of delay for 94% and 96% of all arrival rates considered respectively. This suggest that the delay advantage of the Myopic policies are more pronounced for less correlated channels. VIII. C ONCLUSIONS In this paper, we analyzed the scheduling problem with randomly varying connectivity and server switchover time for the first time in literature. We analytically characterized the throughput region of the system using MDP theory, developed a frame based dynamic control policy (FBDC) that is throughput-optimal and developed much simpler Myopic Policies achieving γ-fraction of the throughput region where γ can be as high as 94%. For systems with correlated channels, throughput region characterization in terms of the state action frequencies of the the saturated system and the throughput-optimality of the FBDC policy hold for general systems with many queues, arbitrary switching times and more complicated Markovian channels. Similarly, the throughput region as well as the throughput-optimality of the Gated policy for the uncorrelated channels case hold for more general systems. FBDC policy provides a new framework for developing throughput-optimal policies for network control. For any queuing system whose corresponding saturated system is finite-state Markovian, FBDC achieves stability based on a novel idea of applying state action frequencies that solve an LP for the saturated system. In the future, we intend to derive analytical expressions for the throughput regions of more general systems. In particular, for systems with non-symmetric Markov channels or multiple-slot switching times, analytical solution of the LP describing the throughput region of the system could be possible. We intend to develop throughput optimal Myopic policies for the current system and for more general systems. Finally, scheduling and routing in multihop wireless networks with dynamic channels and switchover times is an interesting and challenging future direction. A PPENDIX A-P ROOF
OF
T HEOREM 1
We prove Theorem 1 for a more general system with N -queues and travel time between queue-i and queue-j given by Dij PN slots. We call the term i=1 λi /pi the system load and denote it by ρ since it is the rate with which the work is entering the P system in the form of service slots. We prove that a necessary condition for the stability of any policy is ρ = N i=1 λi /pi < 1. Proof: Since queues have memoryless channels, for any received packet, as soon as the server switches to queue i, the expected time to ON state is 1/pi . Namely, the time to ON state is a geometric random variable with parameter pi and hence 1/pi is essentially the “service time per packet” for queue-i. Therefore, the i.i.d. connectivity is essentially a geometric random variable representing service time in a classical polling system. In a multiuser single-server system with or without switchover times, with stationary arrivals whose average arrival rates are λi , i ∈ {1, 2}, and i.i.d. service times independent of arrivals with average service times 1/pi , i ∈ {1, 2}, a necessary condition for stability is given by the system load, ρ, less than 1. To see this, consider the polling system with zero switchover times, stationary arrivals of rate λi and i.i.d. service times of mean 1/pi . The throughput region of this system is an upperbound on the throughput region of the corresponding system with nonzero switchover times (for the same sample path of arrival and channel processes, the system with zero switchover time can achieve exactly the same departure process as the system with nonzero switchover times by making the server idle when necessary). A necessary condition for the stability of the former system is ρ = λ1 /p1 + λN /pN + ... + λ1 /pN < 1, (e.g., [32]). A PPENDIX B-P ROOF
OF
T HEOREM 2
Again we prove the theorem for a more general system with multiple and travel time between queue-i and queue-j Pqueues N given by Dij slots. We prove that Gated cyclic policy is stable if ρ = i=1 λpii . Proof: Let m be the discrete time index for the mth time the mobile stops for servicing a queue. The proof is similar to the stability proof in [2]. Let Tm be the time slot number of this mobile-node meeting times (at time Tm+1 the mobile meets with the next node in the cycle and at time Tm+N it comes back to the same node). Let I(m) be the i.d. of the node that the mobile serves at time Tm and let S(QI(m) (Tm )) be the service time required to serve QI(m) (Tm ) packets at time Tm . Since we have cyclic service, we specify one particular order of service and simplify the notation for traveling times from PNnode i to node j, Dij as Di denoting the time required to move from node i to the next node in the cycle. Also let D = i=1 Di be the total travel time in one cycle. Since we have gated service, we obtain the following queue evolution: N X i=1
Qi (Tm+1 ) =
N X i=1
Qi (Tm ) +
(Tm ))+DI(m) −1 N � Tm +S(QI(m)X X i=1
t=Tm
� Ai (t) − QI(m) (Tm ).
(18)
16
Consider the following Lyapunov function: ~ m )) = L(Q(T
N X Qi (Tm )
pi
i=1
.
(19)
The intuition behind this choice of Lyapunov function is that, given the current queue sizes, it is the expected amount of service time needed to serve what is currently in all the queues. From (18) we obtain, N X Qi (Tm+1 ) i=1
pi
=
N X Qi (Tm ) i=1
pi
+
(Tm ))+DI(m) −1 N � Tm +S(QI(m)X X Ai (t) � i=1
t=Tm
pi
−
QI(m) (Tm ) . pI(m)
(20)
Taking expectations conditional on Q(Tm ) we obtain, N N N hX i X � Q Qi (Tm ) X λi � QI(m) (Tm ) Qi (Tm+1 ) I(m) (Tm ) E + + DI(m) − . Q(Tm ) = pi pi p pI(m) pI(m) i=1 i=1 i i=1
(21)
where we used the independence of the arrival and the channel processes conditional on the current queue sizes. S(QI(m) (Tm )) is a random variable that depends on arrivals before Tm but not on arrivals after Tm as the arrival processes are i.i.d. over Q (Tm ) . Simplifying we obtain time. Therefore, E[S(QI(m) (Tm ))|QI(m) (Tm )] is nothing but I(m) pI(m) N N hX i X QI(m) (Tm ) Qi (Tm ) Qi (Tm+1 ) E + ρDI(m) − (1 − ρ). Q(Tm ) = p p pI(m) i i i=1 i=1
Now we write a similar expression for time Tm+2 . � � hX N N i i hX Qi (Tm+2 ) Qi (Tm+2 ) |Q(Tm+1 ) Q(Tm ) E Q(Tm ) = E E pi pi i=1 i=1 �X � N QI(m+1) (Tm+1 ) Qi (Tm+1 ) =E + ρDI(m+1) − (1 − ρ) Q(Tm ) . pi pI(m+1) i=1
(22)
(23)
Noting that QI(m+1) (Tm+1 ) ≥ QI(m+1) (Tm ) and using (22), we have from (23)
N N i X �Q hX QI(m+1) (Tm ) � Qi (Tm ) Qi (Tm+2 ) I(m) (Tm ) . + ρ(DI(m) + DI(m+1) ) − (1 − ρ) + E Q(Tm ) ≤ pi pi pI(m) pI(m+1) i=1 i=1
Repeating the same argument we obtain a drift condition over one cycle given by
N N −1 hX i X QI(m+j) (Tm ) Qi (Tm+N ) Qi (Tm ) E − . Q(Tm ) ≤ ρD − (1 − ρ) p p pI(m+j) i i i=1 i=0
(24)
Hence, we obtain a negative drift as soon as
N X Qi (Tm ) i=1
pi
>ρ
D . 1−ρ
(25)
Therefore using the Lyapunov stability (e.g., [21, Theorem 3]), the queue length processes at discrete times indexed by m satisfies an N -step negative Lyapunov drift and therefore they are stable. Now consider an arbitrary time slot t ∈ (Tm , Tm+1 ). We have that Q(t) ≤ Q(Tm+1 ) since there is guaranteed to be no service between Tm and Tm+1 . Therefore we have E{Q(t)} ≤ E{Q(Tm+1 )}. Therefore, the system is stable as long as ρ < 1. A PPENDIX C-P ROOF
OF
T HEOREM 3
We enumerate the states as follows: s = (1, 1, 1) ≡ 1, s = (2, 1, 1) ≡ 5
s = (1, 1, 0) ≡ 2, s = (2, 1, 0) ≡ 6
s = (1, 0, 1) ≡ 3, s = (2, 0, 1) ≡ 7
s = (1, 0, 0) ≡ 4, s = (2, 0, 0) ≡ 8.
(26)
17
We rewrite the balance equations in (14) in more details. � x(1; 1) + x(1; 0) = (1 − ǫ)2 x(1; 1) + x(5; 0) � +ǫ(1 − ǫ) x(3; 1) + x(7; 0) � x(2; 1) + x(2; 0) = ǫ(1 − ǫ) x(1; 1) + x(5; 0) � +ǫ2 x(3; 1) + x(7; 0)
� + ǫ(1 − ǫ) x(2; 1) + x(6; 0) � + ǫ2 x(4; 1) + x(8; 0) � + (1 − ǫ)2 x(2; 1) + x(6; 0) � + ǫ(1 − ǫ) x(4; 1) + x(8; 0)
... � � x(5; 1) + x(5; 0) = (1 − ǫ)2 x(5; 1) + x(1; 0) + ǫ(1 − ǫ) x(6; 1) + x(2; 0) � � +ǫ(1 − ǫ) x(7; 1) + x(3; 0) + ǫ2 x(8; 1) + x(4; 0) � � x(7; 1) + x(7; 0) = ǫ(1 − ǫ) x(5; 1) + x(1; 0) + ǫ2 x(6; 1) + x(2; 0) � � +(1 − ǫ)2 x(7; 1) + x(3; 0) + ǫ(1 − ǫ) x(8; 1) + x(4; 0) ...
(27) (28)
(29) (30)
The following equations hold for each channel state pair (C1 , C2 ). x(1; 1) + x(1; 0) + x(5; 1) + x(5; 0) = 1/4
(31)
x(2; 1) + x(2; 0) + x(6; 1) + x(6; 0) = 1/4 x(3; 1) + x(3; 0) + x(7; 1) + x(7; 0) = 1/4
(32) (33)
x(4; 1) + x(4; 0) + x(8; 1) + x(8; 0) = 1/4
(34)
Let u1 = (x(1; 1) + x(2; 1) and u2 = (x(5; 1) + x(7; 1)). Summing up (27) with (28) and (29) with (30) we have � � � � ǫu1 = − x(1; 0) + x(2; 0) + ǫ x(3; 1) + x(4; 1) + ǫ x(7; 0) + x(8; 0) + (1 − ǫ) x(5; 0) + x(6; 0) � � � � ǫu2 = − x(5; 0) + x(7; 0) + ǫ x(6; 1) + x(8; 1) + ǫ x(2; 0) + x(4; 0) + (1 − ǫ) x(1; 0) + x(3; 0) Rearranging and using (31)-(34) we have u1 =
� � � 1−ǫ + ǫ x(3; 1) + x(4; 1) + x(7; 0) + x(8; 0) − (2 − ǫ) x(1; 0) + x(2; 0) − (1 − ǫ) x(5; 1) + x(6; 1) 2
� � � 2−ǫ u2 = + ǫ x(2; 0) − x(4; 1) + x(6; 1) − x(8; 0) − (2 − ǫ) x(5; 0) + x(7; 0) − (1 − ǫ) x(1; 1) + x(3; 1) 4
(35)
(36)
Using (29) in (35) and (27) in (36) we have � (1 − ǫ)(3 − 2ǫ) � ǫ(1 − ǫ) 1−ǫ x(4; 0) + x(8; 1) − + ǫ x(3; 1) + x(4; 1) + x(7; 0) + x(8; 0) − x(6; 1) 2 2−ǫ 2−ǫ � � (1 − ǫ)2 � 1 + ǫ − ǫ2 (1 − ǫ)2 1−ǫ x(2; 0) x(3; 0) + x(7; 1) − 2 − ǫ + x(5; 0) − x(1; 0) − + ǫ(2 − ǫ) ǫ(2 − ǫ) 2−ǫ 2−ǫ � � � (1 − ǫ)(3 − 2ǫ) � 2−ǫ ǫ(1 − ǫ) u2 = x(4; 1) + x(8; 0) − + ǫ x(2; 0) + x(6; 1) − ǫ + x(3; 1) 4 2−ǫ 2−ǫ � � 1−ǫ (1 − ǫ)2 � 1 + ǫ − ǫ2 (1 − ǫ)2 + x(7; 0). x(2; 1) + x(6; 0) − 2 − ǫ + x(1; 0) − x(5; 0) − ǫ(2 − ǫ) ǫ(2 − ǫ) 2−ǫ 2−ǫ
u1 =
(37)
(38)
18
Using (33) and (34) in (37) and (32) in (38) we have � � 1 ǫ(1 − ǫ) � (1 − ǫ)(3 − 2ǫ) � x(4; 1) + x(8; 0) + x(3; 1) + x(7; 0) + ǫ+ u1 = 4(2 − ǫ) 2−ǫ 2−ǫ � (1 − ǫ)(3 − 2ǫ) 1−ǫ 1 + ǫ − ǫ2 (1 − ǫ)2 � − x(2; 0) x(6; 1) + x(5; 0) − x(1; 0) − 2 − ǫ + 2−ǫ ǫ(2 − ǫ) ǫ(2 − ǫ) 2−ǫ � � � 3 − 2ǫ 1 ǫ(1 − ǫ) � u2 = x(4; 1) + x(8; 0) + x(2; 0) + x(6; 1) − ǫ+ 4(2 − ǫ) 2−ǫ 2−ǫ � 1−ǫ 1 + ǫ − ǫ2 (1 − ǫ)2 � (1 − ǫ)(3 − 2ǫ) x(7; 0). x(3; 1) + x(1; 0) − x(5; 0) − 2 − ǫ + − 2−ǫ ǫ(2 − ǫ) ǫ(2 − ǫ) 2−ǫ
(39)
(40)
� � Consider the LP objective function α1 x(1; 1) + x(2; 1) + α2 x(5; 1) + x(7; 1) , and note that the solution to this LP is a stationary deterministic policy for any given α�1 and α2 . This means that, � for any state s either x(s; 1) or x(s; 0) has to be zero. In order to maximize α1 x(1; 1) + x(2; 1) + α2 x(5; 1) + x(7; 1) we need x(7; 0) = 0
if
x(3; 1) = 0
if
x(5; 0) = 0
if
x(8; 0) = x(4; 1) = 0
if
x(6; 0) = 0
if
x(1; 1) = 0
if
α2 1 ≥ , 2 α1 (2 − ǫ) + (1 − ǫ)2 1 α2 ≥ , α1 (1 − ǫ)(3 − 2ǫ) α2 1−ǫ ≥ , α1 1 + ǫ − ǫ2 α2 ≥ 1, α1 α2 ≥ (1 − ǫ)(3 − 2ǫ), α1 1 + ǫ − ǫ2 α2 ≥ . α1 1−ǫ
Note that we have (2 − ǫ)2 + (1 − ǫ)2 (2 − ǫ)2 + (1 − ǫ)2
≥ (1 − ǫ)(3 − 2ǫ) ≥ 1 1 + ǫ − ǫ2 ≥ ≥1 1−ǫ
holding for all ǫ ∈ [0, 0.5]. Consider the following two cases:
√ Case-1: ǫ > ǫc = 1 − 2/2 In this case we have (1 − ǫ)(3 − 2ǫ) < (1 + ǫ − ǫ2)/(1 − ǫ). This means that we have the following optimal policies depending on the value of α2 /α1 . 1≤
α2 α1
≤ (1 − ǫ)(3 − 2ǫ): @queue-1 : (1, 1, 1) : stay, @queue-2 : (2, 1, 1) : stay,
(1, 1, 0) : stay, (1, 0, 1) : switch, (1, 0, 0) : switch. (2, 1, 0) : switch, (2, 0, 1) : stay, (2, 0, 0) : stay.
Substituting the above zero variables into (39) and (40), it can be seen that this policy achieves the rate pair r1 =
α2 α1
(1 − ǫ)(3 − 2ǫ) , 4(2 − ǫ)
r2 =
3 − 2ǫ . 4(2 − ǫ)
> (1 − ǫ)(3 − 2ǫ): @queue-2 : (2, 1, 1) : stay, (2, 1, 0) : stay, (2, 0, 1) : stay, (2, 0, 0) : stay.
In this case it is optimal to stay at queue-2 for all channel conditions. Therefore the decisions at queueu-1 are arbitrary. Namely, it is sufficient that at least one state corresponding to server being at queue-1 take a switch decision, which is the case for
19
α2 /α1 ≥ ((1 − ǫ)(3 − 2ǫ)),since x(3; 1) = 0 if α2 /α1 ≥ 1/((1 − ǫ)(3 − 2ǫ)). Since the policy always stays at queue-2, it achieves the rate pair r1 = 0, r2 = 0.5. Note that the case for α2 /α1 < 1 is symmetric and can be obtained similarly. √ Case-2: ǫ < ǫc = 1 − 2/2 In this case we have (1 − ǫ)(3 − 2ǫ) > (1 + ǫ − ǫ2 )/(1 − ǫ). This means that before the state x(6; 0) becomes zero, namely for (1 + ǫ − ǫ2 )/(1 − ǫ) < α2 /α1 < (1 − ǫ)(3 − 2ǫ), having x(1; 1) = 0 is optimal. This means that there is one more corner point of the rate region for ǫ < ǫc . In more details we have the following optimal policies. 1≤
α2 α1
≤
1+ǫ−ǫ2 1−ǫ :
@queue-1 : (1, 1, 1) : stay, @queue-2 : (2, 1, 1) : stay,
(1, 1, 0) : stay, (1, 0, 1) : switch, (1, 0, 0) : switch. (2, 1, 0) : switch, (2, 0, 1) : stay, (2, 0, 0) : stay.
This policy is the same policy as in the previous case and it achieves the rate pair r1 =
α2 α1
>
(1 − ǫ)(3 − 2ǫ) , 4(2 − ǫ)
r2 =
3 − 2ǫ . 4(2 − ǫ)
1+ǫ−ǫ2 1−ǫ :
We have the following deterministic actions. @queue-1 : (1, 1, 1) : switch, (1, 1, 0) : ?, (1, 0, 1) : switch, (1, 0, 0) : switch. @queue-2 : (2, 1, 1) : stay, (2, 1, 0) : ?, (2, 0, 1) : stay, (2, 0, 0) : stay. In order to find the final threshold on α2 /α1 , we substitute the above deterministic decisions in (28), (29) and (30). Utilizing also (31), (32), (33) and (34) we obtain (1 − ǫ)2 − (1 − ǫ)2 x(6; 1) 4 2−ǫ + ǫx(6; 1) x(5; 1) + x(7; 1) = 4 x(2; 1) =
(41) (42) (43)
The previous threshold on α2 /α1 for x(6; 0) to be zero, i.e., (1 − ǫ)(3 − 2ǫ), is valid for the case where x(1; 0) = 0. Other decisions staying the same, when x(1; 0) is positive and x(1; 1) = 0, r2 increases and r1 decreases. Therefore the threshold on α2 /α1 for x(6; 0) to be zero changes, in particular it becomes α2 /α1 > (1 − ǫ)2 /ǫ. This gives the following two regions: 1+ǫ−ǫ2 1−ǫ
≤
α2 α1
≤
(1−ǫ)2 : ǫ
The optimal policy is @queue-1 : (1, 1, 1) : switch, (1, 1, 0) : stay, (1, 0, 1) : switch, (1, 0, 0) : switch. @queue-2 : (2, 1, 1) : stay, (2, 1, 0) : switch, (2, 0, 1) : stay, (2, 0, 0) : stay. From (41) and (42) it is easy to see that this policy achieves r1 =
α2 α1
>
(1 − ǫ)2 , 4
r2 =
2−ǫ . 4
(1−ǫ)2 : ǫ
The optimal policy is @queue-2 : (2, 1, 1) : stay, (2, 1, 0) : stay, (2, 0, 1) : stay, (2, 0, 0) : stay.
20
This policy achives r1 = 0,
r2 = 0.5.
Similar to Case-1, the case α2 /α1 < 1 is symmetric and can be solved similarly. Thus we have characterized the corner point of the stability region for the two regions of ǫ. Using these corner points, it is easy to derive the expressions for the lines connecting these corner points, which are given in Theorem 3. A PPENDIX D-P ROOF
OF
T HEOREM 4
Proof: Let Di (t) be 1 if there is a departure from queue-i at time slot t and zero otherwise, we have the following queue evolution relation. Qi (t + 1) = Qi (t) + Ai (t) − Di (t). Writing similar expressions for time slots t ∈ {t + 2, ..., t + T } and summing all the expressions creates a telescoping series, yielding T −1 T −1 X X Qi (t + T ) = Qi (t) − Di (t + τ ) + Ai (t + τ ). τ =0
τ =0
Taking the square of both sides we obtain Qi (t + T )2 ≤ Qi (t)2 +
−1 � TX τ =0
−1 T −1 −1 � � TX �2 �2 � TX X Di (t + τ ) − Ai (t + τ ) . Ai (t + τ ) − 2Qi (t) Di (t + τ ) + τ =0
τ =0
(44)
τ =0
Define the quadratic Lyapunov function
L(Q(t)) =
2 X
Q2i (t),
i=1
and the T -step conditional Lyapunov drift
� ∆T (t) , E L(Q(t + T )) − L(Q(t)) Q(t) .
Summing (44) over p both queues, taking conditional expectation, using Di (t) ≤ 1 for all time slots t, E{Ai (t)2 } ≤ A2max and E{Ai (t1 )Ai (t2 )} ≤ E{Ai (t1 )}2 E{Ai (t2 )}2 ≤ A2max for all t1 and t2 we have ) ( T −1 X X Qi (t) [Ai (t + τ ) − Di (t + τ )] Q(t) ∆T (t) ≤ 2BT 2+2E i
=
2
2BT + 2T
X i
A2max
τ =0
Qi (t)λi−2
X
Qi (t)E
(T −1 X τ =0
i
) Di (t + τ ) Q(t)
where B = 1 + is a constant. Let ri (t) be a reward function such that ri (t) = 1 if at time t the server is at queue-i with ON channel and decides to stay at queue-i at time t and ri (t) = 0 otherwise. Note that ri (t) is simply the reward function associated with applying policy π ∗ to the saturated queue system whose infinite horizon average rate is r∗ = (r1∗ , r2∗ ). Let x∗ be the optimal vector of state action frequencies corresponding to π ∗ . Define the time average empirical reward from queue-i in the saturated system, rˆT,i (t), and ˆ T,i (t), as that in the actual system, D T −1 1 X rˆT,i (t) , ri (t + τ ), T τ =0
T −1 1 X ˆ DT,i (t) , Di (t + τ ). T τ =0
ˆ T (t). Similarly define time average empirical state action Also define the corresponding two dimensional vectors ˆrT (t) and D ˆ T (t). Let a.b denote the inner product for vectors a and b. From the definition of the rewards in terms of frequency vector x state action frequencies in (9) we can write rˆT,1 (t) = a1 .ˆ xT (t), rˆT,2 (t) = a2 .ˆ xT (t) and r1∗ = a1 .x∗ , r2∗ = a2 .x∗ , where a1 ˆ T (t) converges to x∗ and hence ˆ and a2 are appropriate vectors of dimension 16. Now we have that as T increases, x rT (t) ∗ converges to r with probability 1 regardless of the initial state of the system. More precisely we have the following lemma [10], [16]: Lemma 4: For every choice of initial state distribution, there exists constants c1 and c2 such that 2
P(||ˆ xT (t) − x∗ || ≥ δ1 ) ≤ c1 e−c2 δ1 T , ∀T ≥ 1, ∀δ1 > 0.
21
Therefore using ||ˆrT (t) − r∗ || ≤ ||ˆ xT (t) − x∗ || ||a1 ||2 + ||a2 ||2
� 12
, we have that there exists constants c2 and c3 such that 2
P(||ˆrT (t) − r∗ || ≥ δ1 ) ≤ c1 e−c3 δ1 T , ∀T ≥ 1, ∀δ1 > 0, under policy π ∗ for any initial state distribution. Now define the following: WT (t) ,
X i
RT (t) ,
X
T −1 X 1 X ˆ T,i (t). Qi (t)D Qi (t) Di (t + τ ) = T τ =0 i
Qi (t)
i
∗
R (t) ,
X
T −1 X 1 X Qi (t)ˆ rT,i (t). ri (t + τ ) = T τ =0 i
Qi (t)ri∗ .
i
We rewrite the drift expression as
X � ∆T (t) Qi (t)λi − E WT (t) Q(t) ≤ BT + 2T i X � Qi (t)λi − E R∗ (t) Q(t) = BT + i
� +E R∗ (t) − WT (t) Q(t) X X Qi (t)ri∗ Qi (t)λi − = BT +
i i � +E R∗ (t) − WT (t) Q(t) .
Now we bound the last term.
� E R∗ (t) − WT (t) Q(t) = � = E R∗ (t) − WT (t) Q(t), R∗ (t) − WT (t) ≥ δ2 ||Q(t)|| � . P R∗ (t) − WT (t) ≥ δ2 ||Q(t)|| Q(t) o n � ~ R∗ (t) − WT (t) < δ2 ||Q(t)|| + E R∗ (t) − WT (t Q(t), � . P R∗ (t) − WT (t) < δ2 ||Q(t)|| Q(t) � �X � Q(t) P |R∗ (t)−WT (t)| ≥ δ2 ||Q(t)|| Q(t) + δ2 ||Q(t)||. ≤ i
Consider
� P |R∗ (t) − WT (t)| ≥ δ2 ||Q(t)|| Q(t) � � δ2 ∗ ≤ P |R (t) − RT (t)| ≥ ||Q(t)|| Q(t) 2 � � δ2 + P |WT (t) − RT (t)| ≥ ||Q(t)|| Q(t) 2 � � δ 2 ≤ P ||r∗ − ˆ rT (t)|| ≥ Q(t) 2 � � δ2 ˆ + P ||DT (t)−ˆ rT (t)|| ≥ Q(t) 2
where the last inequality follows from the Schwartz Inequality for inner products given as |R∗ (t) − RT (t)| = |Q(t).(r∗ −ˆ rT (t))| ≤ ||Q(t)||.||r∗ −ˆ rT (t)||. Using (45), there exists constant c4 such that � � �X 2 Q(t) c1 e−c4 δ2 T +δ2 ||Q(t)|| E R∗ (t)−WT (t) Q(t) ≤ +
�X i
i � � � δ2 ˆ T (t)−ˆ Q(t) P ||D rT (t)|| ≥ Q(t) . 2
(45)
22
Hence we can write the drift term as � �X X X ∆T (t) Q(t) Qi (t)ri∗ + Qi (t)λi − ≤ BT + 2T i i � �i �� −c4 δ22 T ˆ T (t) − rˆT (t)|| ≥ δ2 Q(t) . . c1 e + δ2 +P ||D 2 ˆ T (t) − rˆT (t)|| is because of the lost rewards due to empty queues and it is equal to zero if both of the queues Note that ||D ˆ T (t) − rˆT (t)|| = 0 if Q1 (t) ≥ T and Q2 (t) ≥ T . Therefore, calling have more than T packets at time t. Namely, ||D 2 δ , c1 e−c4 δ2 T + δ2 , we can write X X X ∆T (t) ≤ BT + Qi (t)λi − Qi (t)ri∗ +(δ+1{Q(t) 0 such that (λ1 , λ2 ) + (ξ, ξ) = (r1 , r2 ) − (δ, δ), for some r = (r1 , r2 ) ∈ Λs . Therefore we have, X X ∆T (t) Qi (t). Qi (t)(ri − ri∗ ) − ξ ≤ (B + 2)T + 2T i i P Finally using i Qi (t)(r − ri∗ ) ≤ 0 we have � �X ∆T (t) Qi (t) ξ. ≤ (B + 2)T − 2T i P Hence the queue sizes have negative drift when i Qi (t) is outside a bounded set. Therefore the system is stable for λ within the δ-stripped stability region Λδs where δ(T ) is a decreasing function of T (see e.g., [21, Theorem 3]). Note that 2 δ = c1 e−c4 δ2 T + δ2 for any δ2 > 0. Therefore choosing δ2 appropriately (for example, δ2 = T −0.5+δ3 for some small δ3 > 0), we have that δ(T ) is a decreasing function of T . A PPENDIX E-P ROOF
OF
L EMMA 3
′
Here we prove that Ψ ≥ 0.9002 where
P Qi (t)riMy Ψ = Pi ∗ . i Qi (t)ri Proof: We divide the proof into separate cases for different ǫ regions. 1) Weighted Departure-Rate Ratio Analysis, Case 1: ǫ < ǫc : Considering the mappings in figures 7 and 5, the regions where the Myopic policy and the optimal policy “chooses” the same corner point, we have Ψ′ = 1. In the following we analyze the ratio in the regions where the two policies chooses different corner points. We term these cases as “discrepant” cases. We will (1+ǫ−ǫ2 ) always holds. use Q1 and Q2 instead of Q1 (t) and Q2 (t) for notational simplicity. Note that we have that 2−ǫ 1−ǫ > (1−ǫ) However
2−ǫ 1−ǫ
equals
(1−ǫ)2 ǫ
′
at ǫt = 0.245 for the case of ǫ < ǫc = 0.293.
(1−ǫ)2 2−ǫ 1−ǫ < ǫ 2 Q2 1: (1−ǫ) < ǫ Q1
Case 1.1: ǫ < ǫt →
Discrepant Region < 1−ǫ ǫ In this case the Myopic policy chooses the corner point b1 whereas the optimal policy chooses the corner point b0 . Therefore, � 2� + Q2 12 − 4ǫ Q1 (1−ǫ) (1 − ǫ)2 ǫ ǫ 4 ≥1− + Ψ′ = 1 2 2 1−ǫ Q2 2 2 ǫ = 1− ≥ 0.9700. 2 2
) 2−ǫ 2