SCIENCE FROM THE SOURCE WARMING CLIMATE DAMAGES NORTHERN ROADS Jim Graham1, Marolo Alfaro1, Hamid2, David Kurz3, 1. University of Manitoba, Winnipeg, Manitoba, Canada, 2. Golder Associates Ltd., Calgary, Alberta, Canada, 3. Golder Associates Ltd., Winnipeg, Manitoba, Canada
C
anadians are increasingly aware of the needs and opportunities of northern Canada. Communities in the North need additional support in terms of health care, education, employment opportunities, and the high cost of living. Meanwhile, the economic importance of the North is increasing rapidly through development of mineral, petrocarbon, and hydroelectric resources. Reduction of ice cover in the Arctic Ocean is expected to lead to additional shipping in and out of northern ports. New roads are being planned over difficult terrain in Yukon Territory, Northwest Territory, Nunavut, northern Manitoba and northern Quebec. The only rail line in the North - to Churchill on the shores of Hudson’s Bay - needs major repairs. Where will needed help come from? Much of the analysis, design, and construction of these developments will come from professional civil engineers who design buildings, bridges, transportation systems, water supply and treatment facilities, and manage environmental impacts. All of these projects have ‘ground connections’ and involve engineers like the authors who work in the area known as geotechnical engineering.
SOIL CONDITIONS IN COLD REGIONS Canada has cold winters – colder in some places than others. In winter, heat flows from the ground to the atmosphere and the soil freezes. In summer, warmer air temperatures cause heat to flow back into the ground and the soil thaws. Soil near the ground surface that freezes and thaws seasonally is known as the active layer. The thickness of the active layer depends on the mean annual temperature, the nature of the ground cover, the relationship between sunshine and cloud, and surface elevation.
There is strong “ evidence that climate
warming is progressing more rapidly in areas between the heavily populated regions of southern Canada and the very lightly populated far North.
There is strong evidence that climate warming is progressing more rapidly in areas between the heavily populated regions of southern Canada and the very lightly populated far North. For example, increases in mean annual temperature between 2.7°C and 2.9°C by 2040-2070 are likely in the region between Manitoba and Nunavut where mean annual temperatures are currently close to 0°. Planning, construction, and maintenance of civil engineering infrastructure such as buildings, roads, railways, and airports must take account of future warming.
DOI: 10.13034 / JSST-2015-008
Seven years ago, Manitoba Infrastructure and Transportation (MIT) asked us to help them understand how warming was affecting roads in northern Manitoba. Interested readers will find more details in our recent article in the Canadian Geotechnical Journal (Batenipour et al. 2014).
If water can enter the active layer from below when freezing is moving downward, the ground will often contain irregular layers of concentrated ice known as ice lenses. These may be centimetres thick and produce heaves (known as frost boils) at the ground surface. During melting in spring, the ice lenses thaw and water works its way to the ground surface. This softens the roads, and trucks must reduce the loads they carry.
”
In colder areas, the active layer may be underlain by soil or rock that remains permanently frozen1 . When permanently frozen ground is found in some places but not in others, it is called discontinuous permafrost. However, farther north, permanently frozen ground is found everywhere beneath the active layer and the permafrost is said to be continuous.
THE JOURNAL OF STUDENT SCIENCE AND TECHNOLOGY
2015 VOL 8 ISSUE I
55
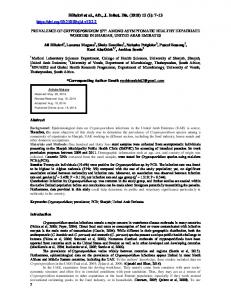
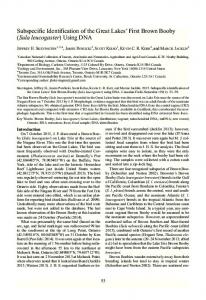
In Manitoba, discontinuous permafrost is encountered north of the isotherm representing a current mean annual air temperature close to 0ºC (Figure 1), which corresponds to an air freezing index of about 2500ºC-days. Permafrost becomes continuous farther north, near Hudson Bay. Differences in snow, rain, solar radiation, wind, natural vegetation and road material (asphalt or gravel) all alter the energy balance at the ground surface and induce changes in temperature in the active layer above permanently frozen soil. This is especially true in areas of ‘warm’ or discontinuous permafrost where the mean annual temperature is below, but close to 0°C. Freezing in winter can produce large vertical and horizontal deformations in road embankments and these are not fully reversed during thawing in the following summer. As a result, instabilities of side-slopes and irregular settlements of road surfaces produce difficult and sometimes dangerous driving conditions. These effects will be made worse by climate warming in the North. THE TEST SITE Our test site was a small 2 m high road embankment about 800 km north of Winnipeg (Figure 1) on Provincial Road 391, which connects
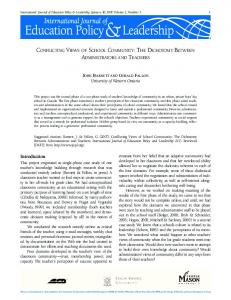
Thompson to northern mining towns, hydroelectric generating stations, and First Nations communities in north-western Manitoba. Figure 2 shows a simplified half-section of the embankment and an underlying soil profile consisting of a thin layer of peat and clayey silt, and a layer of silty clay underlain by gneissic bedrock. The surrounding area is poorly drained and freestanding water is common. The embankment was originally constructed as a compacted earthen road on discontinuous permafrost in the mid-1960s and then converted to a gravel road in the early 1970s. It was upgraded with a bituminous asphalt surface in the 1980s. The road produced changes in snow cover, and therefore heat transfer into and out from the ground. The changes melted ground ice that had been detected earlier under the sideslopes of the embankment. (The lower end of the side-slopes will be called the toe, and the upper end the shoulder.) The thawing led to large ongoing irregular deformations and issues with traffic safety. In an attempt to limit the deformations, compacted fill was placed at the sides of the embankment in the early 1990s. Over some years, these berms settled into the foundation soil
and now provide little support. Considerable yearly road maintenance was required and the pavement was eventually returned to gravel from asphalt. Over a period of almost three years, which is now extended to five years, we measured changes in ground temperature, water pressures, and movements of a section of the embankment that was deforming considerably. This required installing measuring instruments to depths of 9 m, with a positioning anchor for a slope inclinometer2 at 18 m depth (Figure 2). The instruments provided information at only a limited number of positions under the embankment. We calibrated a numerical heat flow model3 to the measured temperatures. The model then allowed us to simulate temperatures everywhere in the soil profile, at all times in the year, and over many years of climate warming. The longer term objective was to produce improved techniques for simulating temperatures not only at our site but at other northern sites as well. Additional work included measurements of vertical and horizontal movements, or deformations, of the embankment. We also instrumented and monitored a second section of the embankment which was on a thinner layer of clay and deforming
Technically, frozen soil or rock is said to be permafrost if its temperature is always below 0oC for two or more years. Slope indicators take the form of a probe that is lowered down a vertical casing. The probe contains an instrumented pendulum that records the local slope of the casing at a series of known depths. These local slopes can be integrated over the length of the casing to measure lateral ground movements in projects in natural hillsides, embankments, dams, etc. 3 TEMP-W from GeoStudio 2007, GeoSlope International, Calgary, Alberta 4 The rate at which heat moves through the ground under a temperature gradient. 5 On the y-axis, void ratio, e is the volume occupied by unit volume of solid particles. 6 http://www.climate.weatheroffice.ec.gc.ca 7 The Segregation Potential SP = vw /grad T, where vw is the rate of water intake, and T is temperature. 1 2
56
2015 VOL 8 ISSUE I
LA REVUE POUR LES ÉTUDIANTS EN TECHNOLOGIE ET SCIENCES
DOI: 10.13034 / JSST-2015-008
much less. Later, we will call these two sections the unstable section and stable section respectively. In 1991, drilling to obtain test samples encountered frozen soil below the toe of the embankment. Additional drilling in 2005 detected only scattered frozen soil, and in 2008, no frozen soil was identified. A later figure will show no sub-zero temperatures, and therefore no frozen soil, below the toe and middle of the side-slope during almost three years of measurements. Warming appears to be an issue.
in our project, and we were finally allowed to drill under the pavement. This time we found some remaining frozen soil which we believe is due to different rates of heat flow across the cleared pavement and vegetated or snow-covered side-slopes of the embankment.
observed, so we were dealing with the effects of irregular settlements on vehicle safety, what we call in engineering a serviceability limit state. LABORATORY TESTING As in all geotechnical projects, socalled ‘undisturbed’ samples were taken from the site and tested for their compressibility under loads that did not cause failure, and for strength under loads that did. Because our embankment was deforming but not actually failing, interested readers are referred to our original publication for the strength data. Heat flow through the soil was an important part of our study, so we also performed tests for thermal conductivity4 at temperatures above and below 0°C.
In our initial drilling in 2008, safety considerations meant we were not permitted to drill under the pavement itself. Later, in 2012, highway engineers in other provinces became interested
The embankment settled considerably after it was built. It now contains about 5 m to 6 m of gravel under the road surface. The gravel comes from the original construction, ongoing re-grading, and also perhaps from the former remedial berm. Depth ‘zero’ in Figure 2 and subsequent figures is the level of the toe of the embankment and the surrounding ground surface. No major slide surface was
Figure 1.
Figure 2.
Figure 3.
Location of test site and permafrost in Manitoba. The figure also shows a -1°C isotherm line.
Instrumentation at the test site. 1. Surface measurement plate 2. Deep settlement gauges 3.Thermistors, 4. Stand pipe 5. Slope inclinometer 6. Piezometers 7. Extensometer
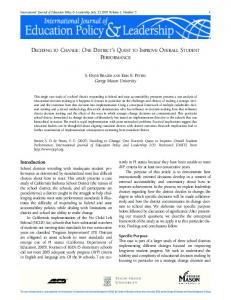
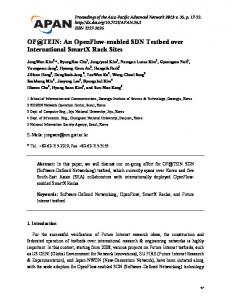
Results of 1-D oedometer compression tests. (a) Compression of voids vs. log (pressure in kPa). (b) Compression of voids vs log (time in minutes).
DOI: 10.13034 / JSST-2015-008
THE JOURNAL OF STUDENT SCIENCE AND TECHNOLOGY
2015 VOL 8 ISSUE I
57
COMPRESSION TESTS
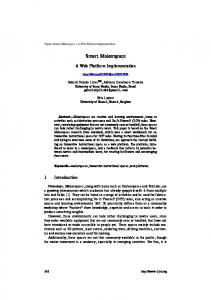
Figure 4. Thermal conductivity vs. temperature. Figure 7. Comparison of selected measured temperatures with values simulated using GeoStudio TEMP/W.
Figure 5. Monthly temperature profiles between November 2008 and September 2009 below the toe of the embankment.
Figure 8. Horizontal movements in downslope direction at (a) shoulder, (b) toe of the embankment.
One-dimensional compression tests were run on 64 mm diameter specimens using a 24-hour loading cycle that squeezed water from the specimens (Figure 35) . The tests included an unload-reload cycle when the pressure reached 700 kPa, after which, loading continued to a maximum applied stress of 1400 kPa. To examine if laboratory tests run at room temperature produce behaviour similar to ground temperatures just above freezing, we ran tests at +21°C and +3°C. Figure 3a shows non-linear compression that was partly recoverable (elastic) and partly non-recoverable (plastic). Clays often also show ongoing viscous (viscoplastic or creep) movements due to timedependent reorganization of clay particles (Figure 3b). Both of these figures show that the clay properties varied only slightly with temperature, probably because the samples contained only 50% of clay particles, with the remaining 50% being less active silt particles. This meant that changes in ground temperature would not affect the behaviour of the embankment when temperatures were above freezing. The ongoing deformations had to be caused by some other process, probably the change of phase when water changed seasonally from liquid to ice and back to liquid. THERMAL CONDUCTIVITY TESTS
Figure 6. Annual temperature envelopes between November 2008 and October 2010 at (a) toe, and (b) mid-slope of the unstable section. 58
2015 VOL 8 ISSUE I
Figure 9. Vertical movements (settlements) at (a) shoulder, (b) toe of the embankment.
Measurements of thermal conductivity were undertaken because we wanted to match numerical calculations with measured ground temperatures. We also wanted to simulate future ground temperatures due to
LA REVUE POUR LES ÉTUDIANTS EN TECHNOLOGIE ET SCIENCES
DOI: 10.13034 / JSST-2015-008
warming air temperatures. This would enable prediction of future degradation of permafrost, with its associated major disruption of roads and runways. For the measurements we used a thermal probe that applied a constant heat flux for a controlled time duration, and recorded resulting changes in temperature in the specimen. Figure 4 plots values of thermal conductivity against initial temperature of the specimens. Thermal conductivity of frozen soil is higher than that of the same soil when not frozen – ice is more thermally conductive than water. In our numerical modeling, we assigned constant, but different, thermal conductivities to frozen and unfrozen soil. Additional information on the thermal conductivity tests can be found in Batenipour et al. (2014). FIELD MEASUREMENTS Ground temperatures under embankments have been measured fairly frequently in the past using thermocouples or thermistors. Our measurements of deformations and water pressures, both of which are necessary for predicting future performance of roads and runways, are much less common. The current five years period of our measurements is unusually long. Instruments were installed at the shoulder, mid-slope and toe of the embankment (Figure 2). They included surface measurement plates, deep settlement gauges, slope inclinometers, and lateral displacement extensometers for measuring deformations; thermistor strings at 1 m intervals of depth for
DOI: 10.13034 / JSST-2015-008
measuring ground temperatures; and multi-level vibrating wire piezometers and standpipes for measuring pore water pressures. Observations were taken during three winter seasons and two summer seasons over a period of almost three years. Monthly visits to the site measured vertical and horizontal movements of the surface settlement plates and water levels in the standpipes. Readings of the electronic instruments were taken on a data acquisition system and downloaded manually. In a recent 2-year extension of the project, we installed remotesensing that uses photovoltaic cells to generate electricity, sends readings to satellites, and then forwards them to our university. This overcomes the difficulty of working on a remote site 600 km from our offices during very cold winters with site temperatures down to -40°C.
MEASURED TEMPERATURES AND GEOTHERMAL MODELING TEMPERATURE DATA Figure 5 shows ground temperatures below the toe of the embankment. The thermistor data start in November 2008 when temperatures at shallow depths were decreasing with the onset of winter. Gradually, the low temperatures moved deeper into the soil profile. Warming began near the surface in April 2009 and again moved slowly down the profile during summer and fall months until cooling began again at the surface in September. The data suggest that ground temperatures below the toe were approximately constant at depths
below 9 m. The lowest recorded temperature was about +2°C. This confirms the absence of frozen soil in the earlier drilling program and implies the absence of permafrost. Figure 6 shows values of minimum, average, and maximum temperatures in 2008-2009 and 2009-2010 plotted against depth, a) below the toe of the embankment and b) below the mid-slope. The average temperatures indicate a net heat flow into the ground in both years and therefore a general warming of the foundation soil. Temperatures below the midslope are lower than below the toe, with the lowest temperature being only slightly above 0°C. As mentioned earlier, additional thermistors installed more recently show freezing temperatures, and therefore frozen soil, beneath the shoulder and centreline. GEOTHERMAL MODELING Thermal conductivities from Figure 4 were used for simulating temperature changes in and under the embankment. To maximize computing efficiency, symmetry was assumed about the centerline of the embankment, shown as the left boundary in Figure 2. Geothermal modeling requires a long list of material properties. We measured gravimetric water contents and thermal conductivities for the gravel fill, upper plastic clay, and lower silty clay. Other properties like unfrozen gravimetric water content, volumetric water content, and heat capacity were obtained from the research literature. The program TEMP/W uses climate data (maximum and minimum temperature for each day, relative humidity, wind speed, amount of
THE JOURNAL OF STUDENT SCIENCE AND TECHNOLOGY
2015 VOL 8 ISSUE I
59
precipitation, starting and ending times of the precipitation events, longitude and latitude) to calculate the temperature boundary condition at the ground surface. After initial ‘steady state’ modeling, climate data6 from Environment Canada’s monitoring station at the nearby Thompson Airport were used for prediction of future warming under the embankment. Figure 7 compares measured and simulated ground temperatures at the embankment toe in a) January/ February, when air temperatures are coldest, and b) July/August, when air temperatures are warmest. The simulated ground temperatures beneath the embankment mostly match the observed data with reasonable accuracy and justify the selections we made for the surface flux boundary and material properties. This provides support for our simulations of present and future ground temperatures. Additional information on our thermal modeling can be found in Flynn et al. (2014). DEFORMATIONS Earlier, we showed that the physical properties of the foundation soil did not vary significantly with temperature, yet the embankment itself was deforming significantly. Some other mechanism must have been operating. Frost action causes expansion of the water in the soil as the freezing front moves downward in winter and turns water into ice. More importantly, this simple freezing process is often accompanied by formation of ice lenses as water from below is attracted up to the freezing front. Subsequent thawing in spring reduces shear strengths 60
2015 VOL 8 ISSUE I
and increases compressibilities in the soil. Our project measured non-recoverable deformations in both vertical and horizontal directions produced by seasonal freezing and thawing. MOVEMENTS MEASURED FROM SURFACE MEASUREMENT PLATES Up to now, we have dealt only with the ‘unstable’ section. For comparison, we will now also include data from the nearby ‘stable’ section. The principal difference between the two sections is the thickness of the underlying clay - about 18 m at the unstable section and only 4 m at the stable section. Otherwise, the soil properties are similar. Figures 8 and 9 show two years of measured movements in metres from steel plates installed on the surface of the ‘stable’ and ‘unstable’ sections at (a) the shoulder of the roadway, and (b) at the toe of the side-slope. The figures show horizontal movements and vertical movements respectively. Horizontal movements of the stable section in Figure 8 are small. The unstable section shows larger seasonal and cumulative movements totalling about 8 cm at the shoulder and 4 cm at the toe in the direction perpendicular to the roadway. In Figure 9, both sections show vertical movements that are largely, but not completely, recoverable. Because of gravel in the embankment, seasonal movements at the shoulder were small. Seasonal heaves were larger at the toe. At the stable section there was about 5 cm of heave at the shoulder (possibly as a result of maintenance) and 12 cm of cumulative heave at the toe. At the
unstable section, there was about 15 cm of cumulative settlement at the shoulder and 12 cm of heave at the toe. In general, the measurements show cumulative movements that were largely downward at the shoulder, with smaller outward movements at the toe. The resulting deformations push the lower levels of clay horizontally away from the centre of the embankment. FROST HEAVE AND SEGREGATION POTENTIAL As mentioned earlier, frost heave is associated in part with the normal expansion of water in the soil when it freezes. More importantly, larger heaves are developed when ice lenses form as freezing extends downward in winter. Once an ice lens forms, water above the lens cannot move downward - the lens can only grow if water moves upward from unfrozen soil beneath. The availability of water and the ease with which it can move toward the freezing front determine the extent and thickness of ice lenses. Ice lenses are most common in silts and fine sand. We wondered if water was available from below at our site during freezing and therefore if the deformations we saw from the instruments could be due to the formation of ice lenses. Our measurements of water pressures showed no upward or downward flow during summer months. In winter, however, we measured artesian pressures, meaning there was an upward flow of water towards suction pressures (negative energy levels) at the bottom of the layer that had already
LA REVUE POUR LES ÉTUDIANTS EN TECHNOLOGIE ET SCIENCES
DOI: 10.13034 / JSST-2015-008
been frozen. Our original paper contains details of this seasonal behaviour (Batenipour et al. 2014). The design of civil infrastructure in cold regions often uses the concept of swelling potential (SP)7 for calculating heaving due to frost action. The value of SP depends on the negative potential (water suction) where water is turning into ice, the freezing temperature, and the hydraulic conductivity in a narrow frozen fringe between ice and the ‘free’ water below. It is generally measured in laboratory tests or obtained from generic published values. Field measurements are rare. Because our site was unusually wellinstrumented and measurements were taken over several years, we were able to reverse this process. In what we believe is the first time field values have been used in this way, we measured rates of heaving and frost penetration in the field. Then we calculated values of SP and compared them with published values. The agreement was generally good and provides support for current design practices that are mostly empirical in nature.
WHAT DID WE LEARN, AND WHAT’S NEXT? The PR391 embankment was built on ‘warm’ permafrost, that is, permafrost close to 0oC. Following its construction, it changed vegetation cover, topography, and heat transfer. These changes altered heat flow across the airto-ground boundary. As well, the local climate has almost certainly become warmer. Field measurements showed a seasonable combination of vertical
DOI: 10.13034 / JSST-2015-008
settlements at the shoulder of the embankment and horizontal movements near the toe that led to lateral spreading. The deformations were cumulative. There were no signs of incipient rotational failure of the side-slopes, so the observed movements had to be caused by other mechanisms. Over almost three years of measurements, measurements showed that seasonal ground temperatures at about 9 m below the toe and mid-slope of the embankment were approximately constant and just above freezing. There was also a net flow of heat into the ground. This thawed permafrost that had been present when the embankment was first built. The warming was possibly caused by additional insulation from snow on the side-slopes of the embankment, and from regional warming. Meanwhile, clearing of snow from the pavement was allowing frozen soil to remain under the centre of the roadway. Measurements are continuing at the site and further work is being done on relating simulated future ground temperatures to embankment deformations using a new loaddeformation-time-temperature analysis that incorporates a viscous (creep) component. The project has shown that long-term deformations of our embankment were caused by thawing of discontinuous permafrost and cumulative strains associated with seasonal freezethaw processes. In broader terms, as northern Canada sees additional development of road, rail, sea, and airport infrastructure, design engineers must ensure satisfactory
performance, not only immediately after construction, but also in the longer term when their projects are subjected to changes in heat-flow caused by a combination of the project itself and warming climate. ACKNOWLEDGEMENTS Technical and financial support was provided by Manitoba Infrastructure and Transportation (MIT) and by the Natural Sciences and Engineering Research Council of Canada (NSERC). NRC Press permitted this re-writing of an original article in the Canadian Geotechnical Journal in 2014.
RESOURCES 1. Andersland, O.B., and Ladanyi, B. 2004. Frozen Ground Engineering. 2nd Edition. New Jersey, USA. John Wiley and Sons, Inc. 2. Batenipour, H., Alfaro, M., Kurz, D., and Graham, J. Deformations and ground temperatures at a road embankment in northern Canada. Can. Geotech. J. 2014, 51, 260-271. Listed as Editor’s Choice, March 2014. 3. CCCSN 2009, Canadian Climate Change Scenarios Network, Arctic Ensemble Scenarios. Environment Canada, Adaptation And Impacts Research Section. 4. Flynn, D., Alfaro, M., Graham, J., and Arenson, L. 2014. Geothermal modelling of ground thermal regime beneath a highway embankment on degrading permafrost. Proceedings 67th Canadian Geotechnical Conference, Regina SK, October 2014.
THE JOURNAL OF STUDENT SCIENCE AND TECHNOLOGY
2015 VOL 8 ISSUE I
61
5. Fortier, R., LeBlanc, A.M., and Yu, W.B. Impacts of permafrost degradation on a road embankment at Umiujaq in Nunavik (Quebec), Canada. Can. Geotech. J. 2011, 48, 720–740. 6. Hinkel, K.M., Nelson, F.E., Park, W., Romanovsky, V., Smith, O., Tucker, W., Vinson, T., and Brigham, L.W. 2003. Climate change, permafrost, and impacts on civil infrastructure. United States Arctic Research Commission: Permafrost Task Force Report, Special Report 01-03. 7. Konrad, J-M. Estimation of the segregation potential of fine-grained soils using the frost heave response of two reference soils. Can. Geotech. J. 2005, 45, 895-909. 8. Kurz, D., Alfaro, M., and Graham, J. 2012. Thermal modeling of an instrumented highway embankment on degraded permafrost. Proceedings 65th Canadian Geotechnical Engineering Conference, Winnipeg MB, October 2012. Jim Graham Civil Engineering Department University of Manitoba Winnipeg, Manitoba, R3T2N2
[email protected], 204-269-0424
62
2015 VOL 8 ISSUE I
Q&A WITH DR. JIM GRAHAM 1. YOU SAY YOU ARE A ‘PROFESSOR EMERITUS’. WHAT DOES THAT MEAN? Sometimes I say it means ‘without merit’, but that is not totally correct! I retired from the university twelve years ago and was then appointed to the volunteer position of Emeritus Professor. The title is conferred on a small number of professors who have shown ongoing interest in teaching and research. Since retiring, I have run a small research program of my own, but now work closely with my co-author Dr. Alfaro. Mostly I help his students with their projects and writing. I enjoy the stimulus of working with young engineers. 2. WHAT IS GEOTECHNICAL ENGINEERING? Geotechnical Engineering, like most engineering disciplines, combines elements of both the creativity of art and the rigour of science. It deals with civil infrastructure of many types – engineered and natural slopes, dams, earth retaining structures, foundations, hydrogeology, engineering geology, rock engineering, environmental issues, and ground improvement – essentially any engineering activity that interacts with the ground. It involves analysis of the variability and properties of construction sites, calculation of how projects will perform, preparing documents, supervising construction, and monitoring performance afterwards. For me, it is a fascinating combination of analysis, judgment, and synthesis.
3. WHY AND HOW DID YOU BECOME A GEOTECHNICAL ENGINEER? My university courses were given by a professor who was not the world’s greatest teacher but was a great educator. He introduced new ideas. He challenged us to study on our own in the library, and to work in group activities. He showed that most new geotechnical projects involve a research component because we don’t know in advance what materials lie below the ground surface. After my doctorate, which involved calculating the failure loads of footings on sand, I had a postdoctoral year in Norway working on the properties of clay soils that can liquefy when they are disturbed. Similar soils are found in eastern Canada. My interests led to laboratory testing in Norway, Northern Ireland, and now for many years in Canada. In that work, I was greatly helped by a year’s study in Oxford that provided an ongoing interest in separating stiff, recoverable behaviour from more deformable, non-recoverable behaviour – an approach that is very different from the one used in the early years of clay engineering. My work has applied these ideas of elastic-plastic soil behaviour to the effects of temperature, changes in soil-water chemistry, creep, and unsaturation in a wide range of applications, including the safe disposal of radioactive fuel waste. 4. TALK TO ME ABOUT ENGINEERING AS A CAREER. It’s enormously diverse. I’ve already mentioned some topics in civil and geotechnical engineering,
LA REVUE POUR LES ÉTUDIANTS EN TECHNOLOGIE ET SCIENCES
DOI: 10.13034 / JSST-2015-008
but there are many other areas as well – mechanical, production, manufacturing, electrical generation and distribution, agricultural, computing, mining, geological, engineering physics, biomedical – anything that incorporates ideas and research from science and develops them into products that serve the general public. Professional engineers are licensed under provincial legislation and participate in technical societies in their areas of specialization – see http://www.engineerscanada.ca/ and www.eic-ici.ca/. They adhere to a Code of Ethics that requires them to protect the interests of the public and the environment. Engineering offers great opportunities for young women and men. In geotechnical engineering, for example, you can work on site evaluation, in the laboratory, on computer analysis, on instrumentation and data collection (as we did on this project), on
DOI: 10.13034 / JSST-2015-008
project design with engineers and scientists in other disciplines, on a construction site, directly with clients, or on regulatory hearings. There are good opportunities for wide experience in Canada and in overseas deployments. 5. HOW DO I BECOME A PROFESSIONAL ENGINEER? Enter an accredited engineering program and obtain a Bachelor degree in what is usually a 4-year undergraduate program. The choice of a branch of engineering is usually made after the first year of studies. Programs involve a wide range of science, mathematics, communications, and generalinterest courses, as well as engineering. After graduation, you will be able to work in your chosen area and apply to your provincial licensing organization to register as an Engineer-in-Training. This is usually a 4-year period in which you work on projects under supervision
by a licensed engineer. The Bachelor degree is now purposely designed to be broadly-based, so specialization often requires a further degree. Many graduates will take a 1- or 2-year program for a Master degree and some will take a Doctor degree. A doctorate will not restrict you to a career as a researcher – most of our doctoral graduates work in consulting companies. 6. IF YOU WERE ONCE AGAIN A HIGH-SCHOOL SENIOR OR A FRESH STUDENT AT UNIVERSITY, WOULD YOU STILL GO INTO ENGINEERING? Absolutely! Engineering offers great opportunities for a widelybased, stimulating, enjoyable, and rewarding career in many areas of engineering. In my area of geotechnical engineering, companies are always looking for capable, inquiring, interactive young engineers.
THE JOURNAL OF STUDENT SCIENCE AND TECHNOLOGY
2015 VOL 8 ISSUE I
63