Available online at www.sciencedirect.com
ScienceDirect Procedia Engineering 100 (2015) 460 – 465
25th DAAAM International Symposium on Intelligent Manufacturing and Automation, DAAAM 2014
A Virtual Dimensionality Method for Hyperspectral Imagery Daniela Baran*, Nicolae Apostolescu National Institute for Aertospace Research “Elie Carafoli”, 220 Iuliu Maniu, Bucharest, Bucharest 061126, Romania
Abstract Hyperspectral sensors capture images in hundreds of narrow spectral channels. The spectral signatures for each spatial location provide rich information about an image scene, leading to better “separation” between physical materials and objects. Hyperspectral data are spectrally overestimated and the useful signals usually occupy lower dimensional subspace which needs to be inferred. The signal information is usually concentrated in lower dimensional subspaces. For estimating the number of spectrally distinct signatures present in a hyperspectral data the concept of Virtual Dimensionality (VD), give us the minimum number of spectrally distinct signal sources that characterize this data from a perspective view of target detection and classification. Considering these facts it is important to reduce the volume of data with minimum loss of information and this is the main idea of our algorithm. In this paper, a new VD modified method for estimating the number of spectral distinct signatures has been proposed. To demonstrate the applicability of the developed software tools, we used a few well-known hyperspectral image-data sets. © Authors. Published by Elsevier Ltd. This is an open access article under the CC BY-NC-ND license ©2015 2015The The Authors. Published by Elsevier Ltd. (http://creativecommons.org/licenses/by-nc-nd/4.0/). Peer-review under responsibility of DAAAM International Vienna.
Peer-review under responsibility of DAAAM International Vienna
Keywords: hyperspectral images; virtual dimension; spectral signatures; endmembers
1. Introduction Hyperspectral sensors used in Hyperspectral Imagery collect information of earth surfaces as a set of images that correspond to the same spatial scene, but are acquired at many different spectral bands with high resolution. These images contain abundant spatial, spectral, and radiometric information, which makes earth observation and information acquisition much more efficient for material applications. In terms of spectral properties, the high resolution has the capability of uncovering unknown sources, which cannot be identified by visual inspection.
* Corresponding author. Tel.: 40-21-4340083; fax: 40-21-4340082. E-mail address:
[email protected]
1877-7058 © 2015 The Authors. Published by Elsevier Ltd. This is an open access article under the CC BY-NC-ND license
(http://creativecommons.org/licenses/by-nc-nd/4.0/). Peer-review under responsibility of DAAAM International Vienna
doi:10.1016/j.proeng.2015.01.391
Daniela Baran and Nicolae Apostolescu / Procedia Engineering 100 (2015) 460 – 465
461
The large dimensionality of a hyperspectral dataset often requires data transformation which can effectively reduce noise in data sets with minimum loss of information. Several methods have been implemented for determining of pure substances from images. This paper refers to estimating the minimum number of spectrally distinct signal sources that characterize the hyperspectral data. This is an important step in the classification process. Also, it is used to highlight spectral properties of many different types of data. Different transformations are intended to find the minimum number of parameters required to represent the observed properties of the data. This number is so-called “intrinsic dimension” estimation (ID) according to the definition given in Fukunaga [3] and[10]. Other authors define their own intrinsic dimension as “the smallest number of parameters needed to contain all of the variability in the data through a mapping function” or the dimension of signal subspace [8]. Therefore, because the pixels in an image can be considered vectors, the intrinsic dimension of a random vector X is usually defined as the number of “independent” parameters needed to represent X. A general approach to ID estimation is the linear technique PCA that use the eigenvalue distribution, but it can be difficult to implement if it is applied to hyperspectral imagery. Chein-I Chang appreciate that ID may not be suitable for use with applications and image data characterized by significant spatial correlations (like hyperspectral data). Reference [9] provides a summary of methods to determine the intrinsic dimension and number of endmembers of a hyperspectral image. In the hyperspectral image, reflectance information depends only of the materials spectral responses in the scene. A mixed pixel is either linear or nonlinear combination of pure pixels signatures weighted by the correspondent abundance fraction. Many techniques of unmixing in hyperspectral image analysis are based on geometric approach where each pixel is seen as a spectral vector of p (number of spectral bands). The linear model is assuming that the number of substances and their spectra are known, but in reality these are not known and, then, hyperspectral unmixing falls into the blindly classes. When the mixture between materials is macroscopic, the linear mixing model of spectra is generally admitted because this model assumes no interaction between materials. Spectral unmixing is one of the most important techniques for analyzing hyperspectral images, it consists in endmember extraction. Today, the researchers are concerned to answer the questions: How many spectral signatures are required to unmix data? How many pure spectral signatures, referred to as endmembers, are supposed to be present in the data to be procesed? It is common practice to assume that the number of signatures used for spectral unmixing is the same number of endmembers, contradicted by reality. For estimating the number of spectrally distinct signatures present in a hyperspectral data was introduced the concept of Virtual Dimensionality (VD), which is the “minimum number of spectrally distinct signal sources that characterize the hyperspectral data from a perspective view of target detection and classification” [2]. Since a spectrally distinct signature is determined by different applications such as endmember extraction, anomaly detection, etc., the VD also varies with how a spectrally distinct signature is interpreted. VD provides an effective alternative because provides a good estimate of the number of dimensions after dimensionality reduction, therefore it can be used to predict how many spectrally distinct signal sources are present in the data. Also, the concept of VD helps us to know that how many bands need to be clustered. Harsanyi, Farrand, and Chang developed a new method, referred to as HFC method, to VD estimation or to determine the number of spectral endmembers in Airborne Visible Infrared Imaging Spectrometer (AVIRIS) data. The HFC method, derived from the concept of the Neyman–Pearson detection theory, is based on the observed data properties specified by signatures that can be discriminated spectrally band-by-band. HFC implements a binary hypothesis test for each spectral dimension to test if each of spectral dimensions can be used to accommodate one signal source as opposed to Principal Component Analysis (PCA) that uses eigenvalues to determine the total number of signal sources instead of a signal source in an individual spectral dimension [12]. Wei Xiong and Chein-I Chang develops a new approach to VD estimation based on data representation in a certain form, specifically based on linear spectral mixture analysis (LSMA)[4]. With the LSMA in mind the proposed approach interprets a spectrally distinct signature as an image endmember that can be used to specify a particular spectral class. All the methods use the eigenvalues of the observation correlation and covariance matrices. In all cases, not needs to be known about basis vectors, which is an advantage over supervised methods [17,18].
2. The proposed VD Algorithm A hyperspectral image can be illustrated as an image cube with the two dimensions of the face of the cube represents the spatial information and the third dimensional representing the spectral information. The information
462
Daniela Baran and Nicolae Apostolescu / Procedia Engineering 100 (2015) 460 – 465
available in a hyperspectral image (cube) is organized in a tridimensional matrix (each plane is an image corresponding to one wavelength band) denoted by HS3D(h,w,p). From the point of view of subsequent calculations we abandon the idea that the three-dimensional matrix representing the image; it is considered now that is just a three-dimensional matrix that will be reorganize in a bidimensional matrix, HS2D(h*w,p), by the rule: first column of bidimensional matrix include all the columns of HS3D, placed successively, where, p=1; second column will contain all columns of the HS3D matrix, , placed successively, where p=2, and so on. For each image pixel, the spectral bands can then be written as vectors. Using statistical language, we consider vectors pixel of a hyperspectral image are observations and their components are variable associated features. To estimate the VD number in Hyperspectral Imagery we have developed a computer program based on the methods described in [2] and [6] using own methods for variance. These methods are known as HFC and noise _whitening HFC (NWHFC) methods [1]. We also make a comparison between the results obtained with the two methods. As in the works [2], [1] and [6], for developing decision-making algorithms in the problem of estimation of VD we formulated this problem as a mathematical binary hypothesis testing. These binary hypothesis tests are procedures to determine whether a “value” is consistent with one of two states of the world, called hypotheses. They are denoted by H 0 and
H 1 and conventionally called the null hypothesis and the target hypothesis. The data that serves as the
basis for the decision is collected in an p-dimensional random vector x, and is described by an a priori probability densities under each hypothesis: pr0 ( x ) and pr1 ( x ) . The conditional notation will be used whether the hypothesis is regarded as a parameter or a random variable. The decision rule can be evaluated with an optimality criterion. Neyman-Pearson criteria is one well-known. Algorithm First calculate the correlation matrix R ( p, p ) and covariance matrix K ( p, p ) for the bidimensional hyperspectral image Im(h * w,
p ) that is assumed with zero-mean. These matrices are symmetric and positive semi-definite. R Thus all their eigenvalues are nonnegative. Let {n1 n2R 5 n Rp 0} and {n1K n2K 5 n Kp 0} be two sets of eigenvalues generated by R ( p, p ) and K ( p, p ) . Since the component dimensionality is equal to the total number of eigenvalues, each eigenvalue specifies a component dimension and provides an indication of the significance of that particular component in terms of energy or variance. If there is no signal source contained in the particular component, the corresponding correlation eigenvalue and covariance eigenvalue are equal. In the binary hypothesis testing, we wish to identify which hypothesis is true from the follows:
H 0 : xl ? nlR ? nlK ? 0, l ? 1,2,5, p or H 1 : xl ? nlR / nlK @ 0, l ? 1,2, 5, p when assuming at least
one of the two hypothesis correspond to reality. The null hypothesis
H 0 represent the case when the correlation
eigenvalue is equal to its corresponding covariance eigenvalues; the target hypothesis H 1 represent the case when the correlation eigenvalue is greater than its corresponding covariance eigenvalues. Express each pair of eigenvalues nl and R
nlK under H 0 and H 1
probability densities given by pr0 ( xl ) ? pr ( xl | H 0 ) B N (0, u xl ), l ? 1,2, 5, p and
as random variables by asymptotic conditional 2
pr1 ( xl ) ? pr ( xl | H 1 ) B N ( o l , u x2l ), l ? 1,2,5, p , where o l is an unknown constant and the noise variance
ux
l
is given by
u x2
l
2 (nlR - nlK ) , and N (0, u xl ) is normal distribution. h*w
The criteria of choice are established in terms of the probabilities for these two hypotheses. The probability of being true hypothesis H 0 can be expressed by false alarm probability ( PF ) and by detection probability ( PD ) in case of H 1 true. The Neyman-Pearson formulation of the decision in the binary hypothesis testing problem attempts to
Daniela Baran and Nicolae Apostolescu / Procedia Engineering 100 (2015) 460 – 465
formula
PD at a fixed PF value. With a fixed value for PF can be calculated the threshold value v l by the
vl ?
get the best
2 * u xl * erfinv(1 / 2 P F ) knowing that
PF ? Ð pr0 ( x)dx ? Ð N (0, u x2l )dxl ? ¢
¢
vl
vl
à à v 1Ä Ä l / 1 erf Ä Ä 2Ä Ä 2u x2 l Å Å
ÔÔ ÕÕ ÕÕ ÕÕ . ÖÖ
The VD estimation with HFC method is based on measuring the difference between the correlation eigenvalue and its corresponding covariance eigenvalue. VD number is estimated as the number of times when
nlR / nlK @ v l , l ? 1,2,5, p .
A modified version of HFC, named NWHFC (noise-whitening ) method is extend by including a noise-whitening step which needs to invert the noise covariance matrix. Both of these methods are used also to determine the number of spectral endmembers in hyperspectral data. Another method used to estimate VD in our computer program is that the eigenthreshold condition for noise In this relationship R is eigenvalues will be written as: nlK > t l R, l ? 1,2, 5 , p .
R ? R o (h * w, p) - sc Ru (h * w, p) . where
*
+
Ro à h * w - p Ô Õ h * w - p ; Ru (h * w, p) ? sqrt ( )Ä h * w ÄÅ h * w * p ÕÖ with h * w the number of pixels from each spectral band and s c will be assumed as a constant which is independent
1 Ro (h * w, p) ? h*w
on the image. The threshold value
vni H
1/ 3
2
t l will be tl ?
vnl . H . vnl H vnl . vnl H
where vni are eigenvectors of covariance matrix K ( p, p ) ;
are eigenvectors of the difference K ( p, p ) / I p and H ? u I P with I P identity matrix, and u 2 is the 2
mean of noise variances over all bands which will be calculated by
Ân r /1
value for which occurs the inegality
i ?1 p
Ân i ?1
between vectors n K and
K i
u2 ?
p 1 Â niK where r is the bigest p / r - 1 i ?r
> s for a particular value of θ, θ reflecting the proportion of noise
K i
tR . In the computer program this method is implemented as HOME method.
variance in dataset [13]. Thus, to estimate the VD with this method we calculate the threshold value as intersection
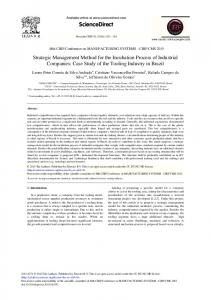
Results and conclusion To demonstrate the applicability of the software tools developed we present some results using two image scenes aquired by Airborne Visible IR Imaging Spectrometer (AVIRIS) using 224 channels ranging from 0.4 to 2.5μm with spatial and spectral resolutions of approximately 20m and 10nm, respectively: Purdue Indiana Indian Pine test site, covering an area of mixed agriculture and forestry in north-western Indiana and Cuprite image scene (figure 1).
463
464
Daniela Baran and Nicolae Apostolescu / Procedia Engineering 100 (2015) 460 – 465
Fig. 1. Hyperspectral images dimensions.
Table 1. Estimated VD on the basis of the HFC, NWHFC and Home methods (Indian_pines image). P_fa
HFC
10-4 10-3 10-2 10-1
33 38 41 51
Indian_pines NWHF σ C 19 121.753 26 82.034 29 121.751 33 121.71
theta
Home
.8971 .9601 .8284 .8844
28 42 27 29
Table 2. Estimated VD on the basis of the HFC, NWHFC and Home methods (Cuprite image). P_fa
HFC 10-4 10-3 10-2 10-1
17 20 23 31
Cuprite NWHF σ C 15 .0051 17 .0034 18 .0080 26 .0034
theta
Home
.9629 .9812 .8254 .9827
21 31 14 31
The main conclusion of our work is that analysing the data presented in tables 1 and 2 we can state that the results of the proposed algorithm is in an encouraging concordance with similar results obtained in literature and offers new developments in calculating a good dimension for hyperspectral images. As further developments we intend to create an intelligent interface for a package of software tools dedicated to the analysis of hyperspectral images as we build for other problems encountered in our activity [14, 15, 16]. References [1] C.-I Chang, Hyperspectral Imaging: Techniques for Spectral Detection and Classification, Kluwer/Plenum Acad. Publ., 2003. [2] Chein-I Chang, and Qian Du; Estimation of Number of Spectrally Distinct Signal Sources in Hyperspectral Imagery, IEEE Transactions on geoscience and remote sensing, vol. 42, no. 3, march 2004 [3] K. Fukunaga and D.R. Olsen. An algorithm for finding intrinsic dimensionality of data. IEEE Trans. on Computers, C-20:176, 183, 1971. [4] Wei Xiong and Chein-I Chang; Estimation of virtual dimensionality in hyperspectral imagery by linear spectral mixture analysis. [5] K. Cawse, A. Robin, M. Sears, The effect of noise whitening on methods for determining the intrinsic dimension of a hyperspectral image. [6] Kerry Cawse-Nicholson, Steven B. Damelin, Amandine Robin, and Michael Sears, “Determining the intrinsic dimension of a hyperspectral Image using random matrix theory”, IEEE TRANSACTIONS ON IMAGE PROCESSING . [7] Yuliya Tarabalka, Jón Atli Benediktsson, Jocelyn Chanussot, IEEE, and James C. Tilton, Multiple Spectral–Spatial Classification Approach for Hyperspectral Data. [8] J. Bioucas-Dias and J. Nascimento.”Estimation of signal subspace on hyperspectral data”, Proc. SPIE, vol.5982. pp.191-198, May 2005. [9] C. C.Wu, W.Liu, and Chein-I Chang, “Exploration of methods for estimation of number of endmembers in hyperspectral imagery”, Proc.SPIE, vol.7, nr.43, pp.1-11,2006. [10] K. Fukunaga, “Intrinsic dimensionality extraction”, in Classification, Pattern Recognition and Reduction of Dimensionality, Eds. Amsterdam 1982,vol.2 Handbook of Statistics.
Daniela Baran and Nicolae Apostolescu / Procedia Engineering 100 (2015) 460 – 465 [11] J. Harsanyi, W. Farrand, and C. –I Chang. “Determining the number and identity of spectral endmembers: An integrated approach using Neyman-Pearson eigenthresholding and iterative constrained RMS error minimization”, Proc. 9th Thematic Conf. Geologic Remote Sensing. Feb. 1993. [12] Anna V. Little, Jason Lee, Yoon-Mo Jung, Mauro Maggioni. “ Estimation of interinsic dimensionality of samples from noisy lowdimensional manifolds in high dimensions with multiscale SVD”. Department of Mathematics, Duke University, P.O.Box 90320, Durham, NC, 27708, USA. [13] Mingyu Fan, Nannan Gu, Hong Qiao and Bo Zhang. “ Intrinsic dimension estimation of data by principal component analysis” Feb. 2010. [14] D. Popescu, D. Baran, C. Pupaza, S Tataru, D. Lozici, 3D Visual Environment for Aeronautical Structures Design and Analysis, The 20th International Daaam Symposium “Inteligent Manufacturing and Education”, Annals of DAAM for 2009&Proceedings of the 20 th International DAAAM Symposium, Book Series: Annals of DAAAM and Proceedings Volume: 20, Pages: 919-920, 200 [15] D. Lozici-Brinzei, D. Baran, S. Tataru, Fatigue Analysis Optimization, "PDF OFF-PRINTS", 0655-0657, Annals of DAAAM for 2010 & Proceedings of the 21st International DAAAM Symposium, ISBN 978-3-901509-73-5, ISSN 1726-9679, pp 0328, Editor B. Katalinic, Published by DAAAM International, Vienna, Austria, 2010. [16] D. Baran, D. Lozici-Brinzei, S Tataru, R. Bisca, Visual environmentfor structural loads computations for stress analysis of aeronautical structures, 24th DAAAM International Symposium on Intellgent Manufacturing and Automation 2013, Procedia Engineering (2014), pp. 1430-1436. [17] G. Shobana , A. Muthuvel, Multi clustering approach for fast hyperspectral endmember extraction using k-means, International Journal of Engineering Research and Applications (IJERA) ISSN: 2248-9622; International Conference on Humming Bird ( 1st March 2014) [18] Chein_I Chang, Hyperspectral Data Processing: Algorithm Design and Analysis.ISBN: 978-0-471-69056-6, WILEY, March 2013.
465