Available online at www.sciencedirect.com
ScienceDirect Procedia Engineering 100 (2015) 511 – 519
25th DAAAM International Symposium on Intelligent Manufacturing and Automation, DAAAM 2014
Framework for Continuous Improvement of Production Processes and Product Throughput Sahno Jevgeni, Shevtshenko Eduard, Zahharov Roman * Ehitajate tee 5, Tallinn 19086, Estonia
Abstract This paper introduces a new framework that allows continuous improvement for the reliability of production process and product throughput. The new framework allows engineers with less effort to define and measure failures of production processes, also enable to analyse these failures. It can be done by identifying the most critical operations in the process that influence on Key Performance Indicator (KPI) such as throughput of that process. Based on the received results, engineer can apply corrective actions and perform continuous improvement by performing daily monitoring of production processes. Current paper involves a basic concept of improvement methodology that followed by a framework development and its description, moreover, a case study regarding this research is under consideration to implement the framework and visualize the results. The framework allows the company decrease production lead time and increase product throughput KPI with less expenditures. This new framework also integrates various tools and methods like Six Sigma DMAIC, FMEA, TOC, FC, swim-line diagram. 2015The The Authors. Published by Elsevier Ltd. ©2015 © Authors. Published by Elsevier Ltd. This is an open access article under the CC BY-NC-ND license (http://creativecommons.org/licenses/by-nc-nd/4.0/). Peer-review under responsibility of DAAAM International Vienna. Peer-review under responsibility of DAAAM International Vienna
Keywords: Six Sigma DMAIC; Failure Mode and Effect Analysis (FMEA); Failiure Classifier (FC); Theory Of Constraints (TOC); Swimline diagram
1. Introduction There are many problems that manufacturing companies face today, for instance, unreliable production processes, bad product quality, financial losses, delay in product delivery etc., but often, companies do not understand the root causes of these problems. As the rule, problems in manufacturing start from various causes, e.g.,
*Corresponding author. Tel.:+372 55900731; E-mail address:
[email protected]
1877-7058 © 2015 The Authors. Published by Elsevier Ltd. This is an open access article under the CC BY-NC-ND license
(http://creativecommons.org/licenses/by-nc-nd/4.0/). Peer-review under responsibility of DAAAM International Vienna
doi:10.1016/j.proeng.2015.01.398
512
Sahno Jevgeni et al. / Procedia Engineering 100 (2015) 511 – 519
inadequate labor qualification, unbearable working conditions, old technologies applied, material supply, etc., leads to the worsening of company efficiency. As a result, this worsening may cause to non-fulfillment of customers’ expectations and consequently loss of position in the market. Therefore, in order to survive in the competitive market, companies should always be able to satisfy their customers by continuously improving their production processes and measure these improvements with the help of suitable KPIs. The objective of this research is to develop framework that allows continuous improvement for the reliability of production process and required KPI. The new framework will be applied into Six Sigma DMAIC methodology. With the help of presented framework, company can decrease production lead time and subsequently increase product throughput that improves product on-time delivery to a customer. Today customer satisfaction is very important for business success, as a high level of customer satisfaction leads to a high level of customer loyalty; consequently it also creates greater chances to repeat product order and company financial revenue [1]. The new framework integrates various tools and methods that help engineers to find out problematic operations in the process and eliminate root causes of problems quickly and with less expenditure. The framework serves as role of a “dashboard” like in a cockpit, which allows monitor production processes in an up-to-date way due to the constantly renewal data from production floor, for example, data from Enterprise Resource Planning (ERP) system [2]. This framework is suitable for SMEs and can be applied in big enterprises, which have batch production. Furthermore, it is focused on the improvement of production processes on a production floor. 2. Basic concepts applied in the research This section provides the background of the basic concepts and the definitions that have been used in this research. 2.1. Key Performance Indicators (KPIs) Measurement of any performance in business is very important principle because it shows gaps between current and desired performance, it indicates where necessarily move to close the unwanted gap. Therefore, carefully selected KPIs precisely show where to take action in order to improve performance [3]. KPIs help an organization to define and measure progress towards selected goals. If an organization has defined its goals, then it is necessary to measure the progress of those goals. A business organization may have its own KPIs that are based on customer’s feedback, for example delivery of product on time [4]. In addition, KPIs are used for evaluating the company current status or for foreseeing the possible benefits after implementation of some modifications in the system. KPIs are quantifiable dimensions that are agreed to beforehand, they reflect the critical success factors of an organization and it depends on the particular company where these KPIs should be evaluated, also they are different depending on the organization [5]. Nowadays KPIs are used in most business areas for monitoring of the performance of production, procurement and management of entire supply chain, etc. The KPIs represent a company’s performance that must fully be understood how effectively a company competes in the marketplace. For this reason company needs to measure its own performance and compare it with competitors [6]. Reviewing different literature of many authors, there are found three important KPIs: Quality, Cost and Delivery [5, 7, 8]. However, the Delivery notion is quite broad (it can be measured from order receiving until the physical order delivery to the customer), therefore this research is considering only manufacturing part of this notion production lead time (for example the period from product manufacturing started until the product manufacturing ended). During this time, manufacturing line should release specified amount of products and the ability of production line releases needed amount of units called – Throughput, which is under consideration in this paper. 2.2. Production Route (PR) card It is a card that gives the detail of an operation to be performed in a production process. It is used to instruct the production people to take up the production work. The content and formats of the PR card can vary from a company to company. In general, it contains: an item and the number of quantities to be produced; production time; physical dimensions; any additional information that may be required by the production worker. PR card traces the route to be taken by a product during a production process [9, 10].
513
Sahno Jevgeni et al. / Procedia Engineering 100 (2015) 511 – 519
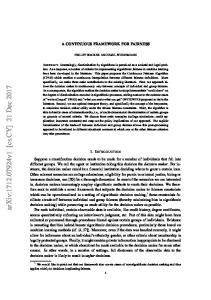
2.3. Failure Classifier (FC) Reliability engineering deals with an analysis of the causes of the faults in organizations. In this research authors developed a FC based on DOE-NE-STD-1004-92 standard, shown in Fig. 1. There are seven major cause categories, and each has its subcategories. The basic goal of using this standard is to define the problems or causes that can occur for each operation during production process, in order to further correct them (DOE-NE-STD-1004-92 11.2012). This standard is adapted and modified for the machinery enterprises [11].
Fig. 1. Failure Classifier.
2.4. Failure Mode and Effect Analysis (FMEA) It is a systematic method of identifying and preventing product and process problems before these occur. It is focused on preventing defects, enhancing safety. In recent years, companies are using FMEA to enhance the reliability and quality of their products, also improving business processes [12]. The risk of a failure and its effects in FMEA are determined by three factors: Severity (S) – the consequence of the failure that might occur during process. Occurrence (O) – the probability or frequency of the failure occurring. Detection (D) – failure being detected before the impact of the effect realized. Every potential failure mode and cause is rated in these three factors on a scale ranging from 1 to 10. By multiplying these rating (See Equation 1), a Risk Priority Number (RPN) is generated. This RPN is used to determine the effect of a failure [13]. RPN = S × O × D
(1)
514
Sahno Jevgeni et al. / Procedia Engineering 100 (2015) 511 – 519
The RPN ranges from 1 to 1000 for each failure mode or operation. It is used to rank the need for corrective actions to eliminate or reduce the potential cause of failures [14]. All FMEAs are team based and the purpose of a FMEA team is to bring a variety of perspectives and experience to the project [15]. 2.5. Six Sigma DMAIC “Six Sigma utilizes analytical tools used to measure quality and eliminate variances in processes. The objective of Six Sigma is to produce near perfect products and services that will satisfy customers [16]”. “Motorola was the first company who developed a Six Sigma project in the mid-1980s that allowed many organizations to sustain their competitive advantage by integrating their knowledge of the process with statistics, engineering, and project management [17, 18]”. “Six Sigma is a project-driven management approach intended to improve the products, services and processes of organizations by reducing defects, it focuses on improving customer requirements understanding, business systems, productivity, and financial performance [19, 20]”. Six Sigma’s DMAIC methodology offers a structure for analysis and diagnosis of problems; driven by powerful tools and techniques [21]. The authors described the 5 steps: define, measure, analyze, improve, control; of the Six Sigma DMAIC in paper [22] that are based on Watson, G. H research [23]. 2.6. Lead Time in Manufacturing Lead Time is a measurement unit used in manufacturing and in lean manufacturing [24], which tells how much time it takes to start and finish something. Lead Time terms can be seen very differently, depending on personal preferences and work background. The scope of these terms is from customer order receiving to customer order delivery, which is the most vital measurement for any company. The scope – scale of Lead Time consists of five steps and represented in detail in Fig. 2 [25]. This research is focused on production lead time reduction, the time from the operation starts until the operation ends or until the next operation starts.
Fig. 2. Manufacturing lead time scale.
2.7. Theory Of Constraints (TOC) TOC is a multi-functional methodology that is developed to help people and organizations to think about system problems, also use to develop breakthrough solutions and implement them successfully. It was primarily developed by Dr. Eliyahu M. Goldratt, it has been popularized through business novels such as “The Goal” [26], “It’s Not Luck” [27], “Critical Chain” [28] and “Necessary But Not Sufficient” [29]. The purpose of TOC is system improvement; a system may consist of a many interdependent processes. It is similar as the chain: a group of interdependent links working together towards the overall goal. The constraint in the chain or in the process is a weak link. The performance of the entire chain or process is limited by the strength of the weakest link. In production processes, TOC concentrates on the process that slows the speed of product throughput. TOC consists of five steps [26]: “1. Identify the system’s constraints; Decide how to exploit the system’s constraints;
Sahno Jevgeni et al. / Procedia Engineering 100 (2015) 511 – 519
515
3. Subordinate everything else to the above decision; 4. Elevate the system’s constraints; 5. If in the previous steps a constraint has been broken, go back to step one, but do not allow inertia to cause a system constraint.” The summary of this methodology shows that reduction of waste in the constraint improves lead time and increases product throughput. When the constraint is improved, variation is reduced, the process reliability is improved [26, 27; 30, 31]. 3. Framework development and description One of the purposes of the TOC in this research is to identify and elevate production system constraint that in turn increases production orders throughput and product delivery KPI. In order to identify the constraint for some specific product or for general production system (system – which includes various production processes/products) the real data from production floor (production lead time, resources, etc.) can be entered into the simulation software or it also can be identified by experience observations of production managers and engineers. The system constraint can be elevated by increasing resources or by decreasing the production lead time. In order to decrease production lead time the RPN values of failures should be decreased or eliminated completely. As a result, the improvement enables to increase product throughput and delivery KPI. Fig. 3 shows the general description of the research framework that is presented in Six Sigma DMAIC structure. In addition, this framework can be applied using other well-known continuous improvement methodologies such as PDCA (Plan Do Check Act), 8D (8 Disciplines) and 4Q (4 Quadrants) [22].
Fig. 3. Framework for continuous improvement of product throughput KPI.
516
Sahno Jevgeni et al. / Procedia Engineering 100 (2015) 511 – 519
Fig. 4. Swimline process for TOC.
In order to identify what department (work center) is constraint for the process it is necessary to build the swimline diagram for instance, with the data as PR card (work centre, operation name and duration), also the data from FC (failures) and FMEA (RPN value), as shown in Fig. 4. The swimline diagram shows the RPN value per every failure, operation and work centre. According to the operation time, it can be identified the process constraint. The process visualization allows better understand what failures should be improved or eliminated in particular work centre to decrease production lead time that consequently increases product throughput. When the corrective actions applied, an engineer should follow them by performing “mini DMAIC” process, as follows: Define the object of study, which means something that has been corrected or improved. Measure the improved process by assigning failures from FC and assessing RPN in FMEA. Analyze processes and decide where and what corrective actions are necessary to carry out. Improve process; apply corrective actions (if needed). Control made improvements in daily processes, if the process requires repeating improvements then repeat the “mini DMAIC” process again until the changes are satisfied. If the made changes are satisfied and not require any corrective actions, then proceed the improvements with other processes. 4. Case study In this research, a case study of the implementation of new framework for continuous improvement of production processes is selected with the data from production floor. The case study was made on a “Wind Power Generator” product that is used in windmills for generation of energy. This product - assembly consists of three main subassemblies (Balanced Rotor, Connected Stator and Frame) as presented with the help of swimline process in Fig. 5. During the production process the modified FC is applied, which enables to specify the types of failures for each operation. In addition, the FMEA is applied to assess the weight of the each failure by means of Severity, Occurrence and Detection rating and then calculate the Risk Priority Number (RPN) value. This RPN value calculated for every failure, operation, and BOM level as shown in Fig. 6.
Sahno Jevgeni et al. / Procedia Engineering 100 (2015) 511 – 519
517
Fig. 5. Wind Power Generator swimline process in TOC.
Fig. 5 represents swimline production process for “Wind Power Generator” where identified a process constraint, which is assembly department (W10) because the lead time in this department is longer (2 hours) comparing with others. The department restricts product throughput and it does not allow releasing needed amount of product ontime. In order to decrease production lead time and increase product throughput of this department, for example, production planner can add additional resources (labor, machines). But in this case study, for increasing of product throughput of the constraint, the RPN values of failures will be decreased (at least failures which influence on the throughput) or they will be eliminated completely. The swimline diagram shown in Fig. 5 is created by using the data given in Fig. 6: PR card (work centre, operation name and duration), FC (failures) and FMEA (RPN values). In current case study the assembly department (W10) constrains the product throughput. The visualization of failures that should be improved is shown in Fig. 5. In order to decrease production lead time and increase product throughput of production line, the RPN values of failures should be decreased or eliminated completely. The process shows that there are two failures causes with high RPN values (140 points): “1C. Software failure” and “1E. Bad equipment work” both related to the “1. Equipment problem” failure group. These two failures delay production process (frequent problem corrections, scrap rework, idle time etc.) that increases production lead time and decreases product throughput. Based on the received results, an engineer can apply corrective actions that results increment of product Throughput KPI. For example, the repeat problem with equipment causes the company fine (penalty) for the product, not on-time delivery every month cost an amount of 10000 euro (120000 euro per year). In order to improve product delivery on-time, it is necessary to increase product throughput, it can be done by replacing old equipment by new one. This solution requires investment into new equipment but at the same time facilitates company to decrease production lead time and increase product throughput. On the other hand releasing needed amount of products on-time that is very important for the customer.
518
Sahno Jevgeni et al. / Procedia Engineering 100 (2015) 511 – 519
Fig. 6. Production process report.
The price of new equipment equals to 360000 euro. As this is the investment, the cost of new equipment pay off or break-even point [32] can be calculated in the following way (360000 / (12 x 10000) = 3 years). Thus, the company has invested into the new equipment begins to make a profit in just three years. But from the author’s point of view, it is more important to have satisfied customer, as the satisfied customer is willing to make an order again that is very important for the company stability, wellbeing and financial revenue. When the needed corrective actions are implemented, the “mini DMAIC process” should be applied in order to improve process and the same process will be carried out until the process in work centre - W10 becomes stable. After improvement of the process, the constraint can move to another work centre, for example to the work centre W05. Then, the same procedure (lead time reduction by eliminating failures and applying corrective actions) should be repeated until the constraint is elevated. Conclusions A new framework for continuous improvement of production process allows improvement in product throughput and product delivery to a customer, the framework was implemented to a production process as a case study in order to prove the results. Various tools and methods like Six Sigma DMAIC methodology, FMEA, TOC, FC, swimline diagram were integrated into general framework. This framework enables to define the failures types using FC for each operation. In the FMEA, the weight of each failure type was assessed with Risk Priority Number (RPN) by calculating Severity, Occurrence and Detection ratings. Further, these RPN values showed most critical failures in the production process. The calculated data from FC (failures), FMEA (RPN value) and operation lead time was analyzed by creating swimline diagram. Having this kind of analysis, it enables to identify most critical failures in the constraint department, then improve or eliminate them (at least those failures which influence on process delay, idle time and scrap rework). By reducing the RPN values or number of failures in the constraint facilitates reduction in production lead time, on the other hand it increases product throughput. As the result, the product throughput improvement influences on product delivery KPI that satisfies the customer and increases company wellbeing and revenue.
Sahno Jevgeni et al. / Procedia Engineering 100 (2015) 511 – 519
519
Acknowledgements Hereby we would like to thank the Estonian Ministry of Education, Doctoral School of Energy and Geotechnology II and Research for Grant ETF9460 which supports the research. References [1] Quality and Their Evolution, 9th International DAAAM Baltic Conference, Industrial Engineering, Tallinn, Estonia, 2014. Reichheld, F. F., & Sasser Jr, W. E., Zero defections: quality comes to services, Harvard business review, 1989, pp.105-111. [2] Umble, E. J., Haft, R. R., & Umble, M. M., Enterprise Resource Planning: Implementation procedures and critical success factors, European journal of operational research, 2003, pp.241-257. [3] Weber, A., & Thomas, R., Key Performance Indicators (KPI), Measuring and Managing the Maintenance Function, Ivara Corporation, Burlington, 2005. [4] Reh, F. J., Key Performance Indicators (KPI), 2005. [5] Barchetti, U., Bucciero, A., Guido, A. L., Mainetti, L., & Patrono, L., Supply Chain Management and Automatic Identification Management convergence: Experiences in the Pharmaceutical Scenario, Supply Chain Coordination and Management, 2011, pp.978-953. [6] Morphy, E., Measuring up, Export Today Vol.15, 1999, pp.52-7. [7] Stewart, G., Supply chain performance benchmarking study reveals keys to supply chain excellence, Logistics Information Management, Vol.8, Iss:2, 1995, pp.38-44. [8] Jacoby, D., Measuring sourcing performance: What's the mystery?, Purchasing, 2005. [9] Production Route Card, Available from: http://www.enotes.com/american-scholar/q-and-a/what-meant-by-job-card-route-card-usedproduction-99397, Accessed: 20.06.2014. [10] Karaulova, T., Pribytkova, M., Sahno, J., & Shevtshenko, E., Design Of Reliable Production Route System, Annals of DAAAM & Proceedings, 2011. [11] Karaulova, T., Kostina, M and Sahno, J., Framework of reliability estimation for manufacturing processes, Mechanics, 2012, pp.713-720. [12] Johnson, S. K., Combining QFD and FMEA to optimize performance, In Annual Quality Congress Proceedings-American Society for Quality Control, 1998, pp.564-575. [13] Wang, Y. M., Chin, K. S., Poon, G. K. K., & Yang, J. B, Risk evaluation in failure mode and effects analysis using fuzzy weighted geometric mean, Expert Systems with Applications, 2009, pp.1195-1207. [14] MacDermott, R. E., Raymond J. M., & Michael R. B., The basics of FMEA, Productivity Press, 1996. [15] Stamatis, D. H., Failure mode and effect analysis: FMEA from theory to execution, ASQ Press, 2003. [16] Stephens, J. S., & McDonald Jr, C. L., Lean Six Sigma, The Journal of Organizational Leadership and business, 2007. [17] Anbari, F. T., Six Sigma method and its applications in project management, In Proceedings of the Project Management Institute Annual Seminars and Symposium, San Antonio, 2002. [18] Rancour, T., & McCracken, M., Applying Six Sigma methods for breakthrough safety performance, Professional Safety, 2000, pp.29-32. [19] Kwak, Y. H., & Anbari, F. T., Benefits, obstacles, and future of six sigma approach, Technovation, 2006, pp.708-715. [20] Desai, T. N., & Shrivastava, R. L., Six Sigma – a new direction to quality and productivity management, In Proceedings of the World Congress on Engineering and Computer Science, San Francisco, CA. Elsevier, 2008. [21] Van den Heuvel, J., Does, R. J., & De Koning, H., Lean Six Sigma in a hospital, International Journal of Six Sigma and Competitive Advantage, 2006, pp.377-388. [22] Sahno, J., & Shevtshenko, E., Quality Improvement Methodologies for Continuous Improvement of Production Processes and Product Quality and Their Evolution, 9th International DAAAM Baltic Conference “Industrial Engineering”, 2014, pp.181-186. [23] Watson, G. H., Six Sigma for business leaders: a guide for implementation, GOAL/QPC, 2004. [24] Shah, R., & Ward, P. T., Lean manufacturing: context, practice bundles, and performance, Journal of Operations Management, 2003, pp.129149. [25] Lead Time Terminology in Manufacturing, Available from: http://www.leadtimes.org/, Accessed: 01.08.2014. [26] Goldratt, E. M., Cox, J., & Whitford, D., The goal: a process of ongoing improvement, Great Barrington, MA: North River Press, 1992. [27] Goldratt, E. M., It’s Not Luck, Great Barrington, MA: North River Press, 1994. [28] Goldratt, E. M., Critical chain: A business novel, Great Barrington, MA: North River Press, 1997. [29] Goldratt, E. M., Schragenheim, E., & Ptak, C. A., Necessary but not sufficient, 2011. [30] Dettmer, H. W., Goldratt's theory of constraints: a systems approach to continuous improvement, ASQ Quality Press, 1997. [31] Goldratt, E. M., Theory of constraints, Croton-on-Hudson, NY: North River, 1990. [32] Badiru, A. B., Handbook of industrial and systems engineering, CRC Press, 2005.