Available online at www.sciencedirect.com
ScienceDirect Procedia - Social and Behavioral Sciences 141 (2014) 1281 – 1290
WCLTA 2013
Learning styles and web technology use in Business and Economics university students Carlota Lorenzo-Romeroa *, María-del-Carmen Alarcón-del-Amob, Miguel-Ángel Gómez-Borjac a
b
University of Castilla-La Mancha, Plaza de la Universidad, 1, 02071, Albacete, Spain University Autònoma of Barcelona, Edifici B (B1-1052), 08193 Bellaterra (Cerdanyola del Vallès) Barcelona, Spain b University of Castilla-La Mancha, Plaza de la Universidad, 1, 02071, Albacete, Spain
Abstract New technologies in general and Web 2.0 in particular, have an important and growing presence in society, both in educational settings and in personal relationships. The main objective of this research is to analyse how 2.0 tools contribute in business strategy offered by the University for the teaching-learning Process, from learning styles of students in order to analyse the profiles obtained and thereby implement appropriate learning techniques to each profile. It has carried out an online survey of students in Degree in Business Administration from the University of Castilla-La Mancha (Spain). The results show three different profiles depending on the learning styles of each of the members surveyed and the use of Web 2.0 tools in their teaching-learning process. Each profile will achieve differentiated teaching strategies, seeking aimed at improving the teaching and learning of teachers and students. © 2014 The Authors. Published Published by by Elsevier Elsevier Ltd. Ltd.This is an open access article under the CC BY-NC-ND license (http://creativecommons.org/licenses/by-nc-nd/3.0/). Selection and peer-review under responsibility of the Organizing Committee of WCLTA 2013. Selection and peer-review under responsibility of the Organizing Committee of WCLTA 2013. Keywords: Learning styles, web technology, university education, use of 2.0 tools, profile of university students;
1. Introduction Web 2.0 offers many possibilities to the education system which allows social participation of a group of people in developing content. The professor approaching the mediating role of the student and the true defender of their knowledge, being a part very active in their formation, any time, any place [1]. As stated [2], Information and
*Corresponding Author: Carlota Lorenzo-romero. Tel.: +34-967-599200 Ext. 2310 E-mail address:
[email protected]
1877-0428 © 2014 The Authors. Published by Elsevier Ltd. This is an open access article under the CC BY-NC-ND license (http://creativecommons.org/licenses/by-nc-nd/3.0/). Selection and peer-review under responsibility of the Organizing Committee of WCLTA 2013. doi:10.1016/j.sbspro.2014.05.221
1282
Carlota Lorenzo-Romero et al. / Procedia - Social and Behavioral Sciences 141 (2014) 1281 – 1290
Communication Technology will provide a learning offer which facilitates collaborative working, self-learning and removing the barriers of time and space. Learning supported by Web 2.0 tools relies on two basic principles: the user-generated content and the architecture of participation, where both students and teachers can contribute their knowledge, fostering cooperation, thus multiplying the possibilities of learning [3]. The overall objective of this research is to analyse the different profiles of university students from their learning styles and use of Web 2.0 tools during the teaching-learning process. For this purpose, a survey was conducted, using online support platform, which analyses their perception, reactions using 2.0 tools and technologies according to their learning styles. 2. Background literature 2.1. Web 2.0 tools in the University studies The change in learning methodology implies the use of Web 2.0 tools (e.g. blogs, wikis, podcasts, social networks, virtual, collaborative maps, virtual platforms, etc.). However, it is imperative that the methodology-Web 2.0 tools binomial is adequate to achieve positive results in the teaching-learning process. Therefore, these tools should have the following characteristics for both student and teacher will take full advantage [1]: Interaction between two or more users, connectivity, open and dynamic applications that encourage participation and modification of the contents continuously, simple applications, intuitive and free for greater participation. In general, Web 2.0 applications can be classified into two groups, and not all require the same skills, nor used for the same purpose [4]: • Applications social or emotional, which focus more on building relationships through profiling or multimedia publications and, in general, have a more intuitive (e.g. social networks, YouTube, Skype, etc...). • Applications instrumental, which are used in education and requiring more skills to use (e.g., wikis, blogs or online office tools). The range of Web 2.0 applications is vast, diverse and fast evolving constantly, however, in the educational setting are especially useful the following platforms online content generation [3]: • Blog. For students and teachers can be a space to write questions, publish papers or record links to other resources. Currently, this tool is increasingly used , in fact , 77.4 % of Internet users surveyed do not have a blog , five points less than the previous year and only 4.8% of the users who have the updated frequently [5]. • Wikis. They are tools that allow collaborative authoring, allowing each student, from the place where you are, researching, writing and publishing and, at the same time, read the contributions made by other students, applying the principle of collective intelligence. The example most used educational wiki is Wikipedia. • Collaboration tools. This type of platform to share learning objects that can then be exported to other platforms. Simplify the access and exchange of materials between teachers and students, who can share documents, classes, homework, databases, etc. So that the student learns is the protagonist and the interaction with the learning object, mediated by teachers, an example of these tools can be the PowerPoint online or podcast, or Slideshare. The purpose is to make the learning process more dynamic and participatory. 2.2. Learning styles The most relevant definition of "Learning Styles" could be provided by [6], which means "the cognitive, affective and physiological, which serve as indicators of how students perceive, interact and respond to their learning environments". [7], the term is defined as "personal variable, halfway between intelligence and personality, explains the different ways to approach, plan and respond to the demands of learning". Meanwhile, [8] state that " learning styles indicate how the student perceives and processes the information to construct their own learning, providing indicators that guide the way we interact with the reality". Generally, [9] defined the concept as "the cognitive, emotional , physiological, preference for the use of sense environment, culture, psychology, comfort, personality development and which serve as relatively stable indicators of how people perceive, interact and respond to their learning environments and their own methods or strategies in their learning". The literature review shows that existing learning typologies are those made by [10] and [11], corroborating the research on learning styles since 2000, in which the instruments measurement and classification of learning styles used in most of these have been created by these authors although at times the instrument developed by Kolb was
Carlota Lorenzo-Romero et al. / Procedia - Social and Behavioral Sciences 141 (2014) 1281 – 1290
1283
able to raise some controversy [12]. These authors frame their learning models called multi-situational models, which would be those that focus on analysing individual differences in the processing and transformation of information , looking at the different ways of facing the same depending on the environment conceive learning as a cyclical process that goes through four phases: information collection , information processing , structuring and preparing the information associating each style , so that the preference of a style indicates the prevalence by an individual of one style over another [13]. The measuring instrument of learning styles developed by [10] was the Learning Style Inventory (LSI). This instrument is very versatile, since although originally was created to determine the learning styles of managers and adults, has been used interchangeably, both the academic and business. According to this instrument for effective learning come into play four different capacities: • Concrete experience, being able to get involved fully, openly and without bias in new experiences. • Reflective observation, being able to reflect on these experiences and to observe from multiple perspectives. • Abstract conceptualization, being able to create new concepts and to integrate their observations into logically sound theories. • Active experimentation, being able to use these theories to make decisions and solve problems. Drawing on the theories of Kolb's Experiential Learning and LSI measurement instrument, [11] developed a new model of learning styles, typifying in four types of learning styles, which correspond to the phases of a process circle of learning: active, reflective, theoretical, and pragmatic. • The process begins with finding and data collection (active style), • then that information is analysed from several points of view (reflective style), • then constructs a conceptualization, structuring or own theory from the data (theoretical style), • and ends with the application of new knowledge in the practical solution of problems (pragmatic style) to begin the cycle again. Originally, the model was developed to see the implications of the four learning styles in a group of managers, with the goal of creating a tool to help them diagnose these styles and enhance outstanding for those less well increase learning effectiveness [6]. 3. Methodology 3.1. Sample and procedure The information was collected through an online survey, to 400 students of Business Administration and Economics degree at University of Castilla-La Mancha, during March and April, 2013. 3.2. Data Analysis: A latent segmentation approach We have used the latent segmentation methodology to define segmentation and profiling of the students. This kind of procedure allows the assignation of individuals to the segments based on their probability of belonging to the clusters, breaking with the restrictions of deterministic assignment inherent to the non-hierarchic cluster analysis [14]. This methodology assigns the individuals to different segments under the assumption that the data stems from a mixture of distribution probabilities or, in other words, from various groups or homogenous segments that are mixed in unknown proportions [15]. The advantage of latent class models is that they allow the incorporation of variables with different measurement scales (continual, ordinal or nominal). Also, the models usually can incorporate independent variables that may be used to describe (rather than to define or measure) the latent classes. These exogenous variables are known as covariates or grouping variables [16, 17, 18]. 3.3. Measures The variables we have used as indicators for the cluster analysis were based on the frequency with students engage in different activities within the Social Media tools in their learning processes, using a six point scale (never, very sporadically, every two or three months, several times a month, several times a week or daily). On the other hand, two learning styles scales were introduced as covariates in order to outline the resulting segments The learning styles scales used has been the scale of Kolb (Learning Style Inventory, LSI) as Honey and Mumford
1284
Carlota Lorenzo-Romero et al. / Procedia - Social and Behavioral Sciences 141 (2014) 1281 – 1290
(Learning Style Questionnaire, LSQ) in its reduced version. Firstly, we have identified the four learning styles of the two scales: Theorist, Pragmatist, Activist and Reflector for the Honey and Mumford scale, and Concrete Experience (CE), Reflective Observation (RO), Abstract Conceptualization (AC) y Active Experimentation (AE) for the Kolb scale. Then, we have converted LSI and LSQ raw scale scores to dichotomy scores. The purpose of dichotomy conversions is to achieve scale comparability among an individual’s scores [19] and to define cut-points for defining the learning style types [20]. To develop the conversion, we have divided the every learning styles scores (Theorist, Pragmatist, Activist, Reflector, CE, RO, AC and AE) at the fiftieth percentile of the total group, and we assigned the students to each learning styles in which have a value above the fiftieth percentile. Based on the positioning of the different individuals, with regard to the indicators and covariates, we have obtained different grouping patterns that fulfil the principles of maximum internal coherence and maximum external differentiation (see Tables 2 and 3). For this, we have opted for using Latent Gold 4.5. statistical software. 4. Results. A Typology of students In applying the latent segmentation approach, the first step consists of selecting the optimum number of segments. The model used estimated from one (no heterogeneity existed) up to eight (i.e. eight segments or heterogeneity existed). Table 1 shows the estimation process summary and the fit indexes for each of the eight models. The fit of the model was evaluated with the Bayesian Information Criterion (BIC), which allows the identification of the model with the least number of classes that best fits to the data. The lowest BIC value was considered as the best model indicator [21, 18]. In this case, the best alternative was reflected in a final solution of three different user groups, as the BIC is minimized in this case. The Model Fit likelihood ratio chi-squared statistic (L2) can be interpreted as “indicating the amount of the observed relationship between the variables that remains unexplained by a model; the larger the value, the poorer the model fits the data and the worse the observed relationships are described by the specified model”. On the other hand, the p-value can be interpreted as a “formal assessment of the extent to which the model fits the data (the null hypothesis of this test is that the specified model holds true in the population)” [18]. Therefore, in our case, we have a good fit. Also, the entropy statistic (Es) and R2 are near 1. Table 1. Summary of the results of the models LL BIC(LL) Npar L² p-value Class.Err. Es R2 1-Cluster -8386.8388 17233.0101 78 15919.0256 1.3e-3151 0.0000 1 1 2-Cluster -7988.7809 16584.1163 103 15122.9098 9.7e-3004 0.0568 0.8063 0.8339 3-Cluster -7844.9855 16443.7473 128 14835.3189 1.2e-2964 0.0611 0.8359 0.8406 4-Cluster -7785.6638 16472.3259 153 14716.6755 4.0e-2962 0.1004 0.7994 0.7896 5-Cluster -7730.3810 16508.9823 178 14606.1100 6.7e-2962 0.1177 0.7989 0.7760 6-Cluster -7699.9905 16595.4233 203 14545.3290 4.8e-2973 0.1078 0.8169 0.7907 7-Cluster -7674.8619 16692.3880 228 14495.0718 2.9e-2987 0.1185 0.8155 0.7870 8-Cluster -7644.4683 16778.8227 253 14434.2846 3.2e-3000 0.1107 0.8319 0.7945 LL=log-likelihood; BIC=Bayesian information criterion; Npar=number of parameters; L2= LL statistic (measure of performance); p-value=significance of the model; Class.Err.=classification error; Es= entropy Rsquared; R2=Standard R-squared In addition to that set forth in Table 2, we have analysed the Wald statistic, to evaluate the statistical significance within a group of estimated parameters. For all the indicators (Table 2) we obtained a significant p-value associated with the Wald statistics, which corroborate that each indicator discriminates between the clusters in a significant way [18]. Table 2 also contains the profiles of each of the clusters obtained. In the upper part the size and name assigned to the four groups is shown. To complete the composition of the three segments that were revealed, we have analysed the profile of the resulting groups according to the information from the covariates introduced in the model. Table 3 shows the composition of each group based on the descriptive criteria included in the analysis. P-value associated with the Wald statistics conclude that significant differences exist between the segments regarding the “Pragmatist”
Carlota Lorenzo-Romero et al. / Procedia - Social and Behavioral Sciences 141 (2014) 1281 – 1290
1285
learning style from Honey and Mumford scale, and “Reflective Observation” learning style from Kolb scale. In addition, there are significant differences between clusters at 10% level for “Activist” and “Reflector” learning styles from Honey and Mumford scale, and “Abstract Conceptualization” from Kolb scale. Therefore, there is not significance differences between cluster with regard the “Theorist” learning style from Honey and Mumford scale, and the “Concrete Experience” and “Active Experimentation” learning style from Kolb scale. Table 2. Cluster profiles obtained (indicators) Cluster Cluster Cluster Wald p-value R² 2 1 3 Indicators Cluster Size 25.15% 56.60% 18.25% Never 0.0075 0.0005 0.0008 Several times a 0.0132 0.0062 0.0073 Virtual month 8.8857 0.012 0.0109 Campus Several times a week 0.3292 0.2481 0.2681 Daily 0.6500 0.7452 0.7238 Never 0.4393 0.2364 0.0436 Very sporadically 0.2931 0.2241 0.0712 Every 2 or 3 months 0.0256 0.0278 0.0152 Calendars 56.524 Several times a (Google 5.3e-13 0.1963 3 0.1012 0.1571 0.1471 calendar) month Several times a week 0.0996 0.2220 0.3566 Daily 0.0412 0.1326 0.3662 Never 0.5271 0.1602 0.0205 Very sporadically 0.3057 0.2004 0.0486 0.0475 0.0668 0.0306 Audio tools Every 2 or 3 months 66.721 (Podcasts, 3.2e-15 0.3222 Several times a 5 0.0738 0.2232 0.1933 iTunes...) month Several times a week 0.0394 0.2578 0.4225 Daily 0.0064 0.0915 0.2845 Never 0.0868 0.0103 0.0002 Very sporadically 0.2096 0.0481 0.0021 Video Every 2 or 3 months 0.1194 0.0527 0.0062 55.438 (YouTube, 9.2e-13 0.2285 Several times a 7 Dailymotion, 0.2273 0.1926 0.0612 month Vimeo) Several times a week 0.2857 0.4678 0.4014 Daily 0.0712 0.2285 0.5291 Never 0.4588 0.1849 0.0096 Online share Very sporadically 0.2726 0.1853 0.0227 platforms Every 2 or 3 months 0.0895 0.1026 0.0295 (Dropbos, 61.800 3.8e-14 0.2982 Several times a Bos, Sugar 5 0.0802 0.1554 0.1051 month Sync, Google Several times a week 0.0792 0.2608 0.4155 Drive, iCloud) Daily 0.0197 0.1109 0.4177 Never 0.3715 0.1650 0.0239 Very sporadically 0.2865 0.1896 0.0488 Communicati Every 2 or 3 months 0.0465 0.0459 0.0210 on tools 53.487 Several times a 2.4e-12 0.2013 (Google Talk, 4 0.1440 0.2127 0.1736 month Skype) Several times a week 0.1070 0.2376 0.3455 Daily 0.0445 0.1492 0.3872 Never 0.1435 0.0338 0.0005 15.599 0.0004 Messaging 0.0764 5 1 (Whatsapp) Very sporadically 0.0315 0.0103 0.0003
1286
Carlota Lorenzo-Romero et al. / Procedia - Social and Behavioral Sciences 141 (2014) 1281 – 1290
Slide sharing platform (SlideShare)
Social tagging (Delicious, Stumbleupon) Customized search engines (Technorati, Google Books, Google scholar)
Blogs
Wikis (Wikipedia, Wikispaces)
Photos (Flickr, Picasa, Panoramio)
Mind maps (CmapTools)
Every 2 or 3 months Several times a month Several times a week Daily Never Very sporadically Every 2 or 3 months Several times a month Several times a week Daily Never Very sporadically Every 2 or 3 months Several times a month Several times a week Daily Never Very sporadically Every 2 or 3 months Several times a month Several times a week
0.0161
0.0073
0.0006
0.0262
0.0167
0.0032
0.1036 0.6790 0.5494 0.2598 0.0617
0.0918 0.8401 0.3484 0.2438 0.0860
0.0430 0.9524 0.0909 0.1144 0.0725
0.0871
0.1810
0.2741
0.0358 0.0062 0.8302 0.1472 0.0147
0.1115 0.0293 0.5902 0.2474 0.0583
0.3040 0.1441 0.2087 0.1816 0.0880
0.0061
0.0581
0.1787
0.0016 0.0002 0.4603 0.2607 0.0646
0.0375 0.0086 0.3104 0.2301 0.0746
0.2339 0.1091 0.0440 0.0664 0.0437
0.1154
0.1749
0.2082
0.0795
0.1586
0.3839
Daily
0.0195
0.0514
0.2538
Never Very sporadically Every 2 or 3 months Several times a month Several times a week Daily Never Very sporadically Every 2 or 3 months Several times a month Several times a week Daily Never Very sporadically Every 2 or 3 months Several times a month Several times a week Daily Never Very sporadically Every 2 or 3 months
0.4003 0.3367 0.0725
0.2027 0.2628 0.0876
0.0656 0.1316 0.0678
0.1221
0.2287
0.2747
0.0573 0.0110 0.0436 0.1587 0.0808
0.1676 0.0506 0.0190 0.0902 0.0599
0.3129 0.1473 0.0021 0.0181 0.0222
0.3346
0.3237
0.2201
0.3221 0.0602 0.6041 0.2623 0.0541
0.4072 0.1000 0.2802 0.2387 0.0970
0.5083 0.2293 0.0446 0.0768 0.0624
0.0585
0.2102
0.2696
0.0187 0.0023 0.7142 0.2329 0.0313
0.1381 0.0358 0.4455 0.3032 0.0854
0.3565 0.1901 0.1497 0.1944 0.1036
57.265 0
3.7e-13
0.2015
58.671 1
1.8e-13
0.2868
56.570 6
5.2e-13
0.2192
50.181 2
1.3e-11
0.1571
0.6264
30.010 1
3.0e-7
62.356 0
2.9e-14
0.2949
64.437 9
1.0e-14
0.2435
1287
Carlota Lorenzo-Romero et al. / Procedia - Social and Behavioral Sciences 141 (2014) 1281 – 1290 (
)
Several times a 0.0164 0.0954 0.2168 month Several times a week 0.0048 0.0611 0.2600 Daily 0.0003 0.0094 0.0756 Never 0.6237 0.3004 0.1118 Very sporadically 0.2677 0.2627 0.1507 Every 2 or 3 months 0.0485 0.0967 0.0858 Office 52.773 (Google Docs, Several 3.5e-12 times a 2 0.0426 0.1724 0.2366 Thinkfree) month Several times a week 0.0144 0.1181 0.2513 Daily 0.0030 0.0497 0.1638 Never 0.1164 0.0146 0.0045 Very sporadically 0.1355 0.0289 0.0117 Social Every 2 or 3 months 0.0340 0.0123 0.0065 networking 38.085 5.4e-9 Several times a sites 3 0.1317 0.0809 0.0551 month (Facebook) Several times a week 0.2464 0.2580 0.2282 Daily 0.3361 0.6054 0.6941 Never 0.2419 0.0569 0.0069 Very sporadically 0.3951 0.1868 0.0445 Maps Every 2 or 3 months 0.0954 0.0907 0.0421 applications 58.641 1.8e-13 Several times a (google 5 0.2053 0.3954 0.3569 month Maps) Several times a week 0.0568 0.2248 0.3945 Daily 0.0055 0.0454 0.1551 Never 0.8360 0.5159 0.1755 Very sporadically 0.1474 0.2833 0.1913 RSS Every 2 or 3 months 0.0119 0.0716 0.0958 aggregators 57.002 4.2e-13 Several times a (RSS Feed, 1 0.0039 0.0734 0.1939 month Blogliness) Several times a week 0.0008 0.0457 0.2384 Daily 0.0001 0.0102 0.1051 *Boldface indicates the most relative importance between each category in each segments Table 3. Profile of latent segments (covariates) Covariates* Cluster 2 Cluster 1 Cluster 3 Wald Honey Theorist 0.6815 0.5796 0.5418 3.2760 and Pragmatist 0.3911 0.6293 0.6815 17.6167 Mumford Activist 0.3844 0.5822 0.5941 5.0145 scale Reflector 0.6003 0.4998 0.3698 5.2119 (LSQ) Concrete Experience 0.5870 0.5138 0.4663 0.3326 Reflective Observation 0.4015 0.5431 0.5704 8.4172 Kolb scale Abstract (LSI) 0.4395 0.5122 0.5532 4.9878 Conceptualization Active Experimentation 0.5603 0.5367 0.5538 3.3080 * Only positive values (yes) have been reflected in the Table (dichotomous variables).
0.2131
0.1419
0.2467
0.2872
p-value 0.19 0.00015 0.081 0.074 0.85 0.015 0.083 0.19
The main characteristics of the above mentioned groups listed from a lesser to higher intensity of Social Media tools’ use are detailed below.
1288
Carlota Lorenzo-Romero et al. / Procedia - Social and Behavioral Sciences 141 (2014) 1281 – 1290
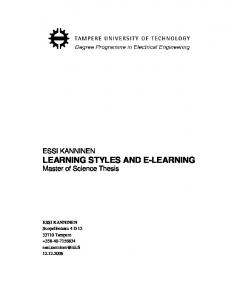
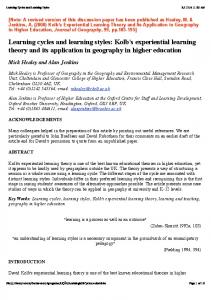
• Introvert student (cluster 2). This group covers 25.15% of the students. This is the least active group. Most of them don’t use the Internet tools and technologies in their learning processes. They basically use Virtual Campus, messaging tools and social networking sites (SNS), and with a less frequency than the other groups. According to the Honey and Mumford scale, this segment is basically Theorist and Reflector. And, with regard the Kolb scale, this group has a Concrete Experience and Active Experimentation learning style. • Novel student (cluster 1). The largest group, representing 50.60% of the sample. Most of them use daily messaging tools as WhatsApp (84.01%), Virtual Campus (74.52%), SNS (60.54%), at least several times a month the online audio (57.25%), several times a month or a week the wikis (32.37% and 40.72%, respectively) and the maps applications (39.54% and 22.48%, respectively), and several times a month o daily the online video (46.78% and 22.85%, respectively). This segment is distributed in the different considered frequency of use of calendars, online share platforms, communication tools and customized search engines. With regard the learning styles, they are Pragmatist and Activist, and have a Reflective Observation and Abstract Conceptualization learning style. However, although they have an active and pragmatist learning style, they are lesser extent that the Social users. • Social student (cluster 3). This is the smallest group, representing 18.25% of students. The most active students of all groups. These students use the considered Internet applications with a higher frequency than the other groups. Most of them use daily messaging tools (95.24), Virtual Campus (72.38%), SNS (69.41%) and online video platforms (52.91%). On the other hand, most of them use at least several times online share platforms (83.32%), wikis (73.76%), communication tools (73.27%), online calendars (72.28%), audio tools (70.7), customized search engines (63.77%) and maps applications (54.96%). The rest of Social media tools are used at least several times a month (slide sharing platforms, social tagging, blogs, photos, mind maps, office and RSS aggregators. With regard the learning styles, these students are the most Pragmatist and Activist according to the Honey and Mumford scale, and develop a Reflective Observation and Abstract Conceptualization learning style according to Kolb scale. Figure 1 clearly allows appreciation of the profile of those belonging to each one of the clusters, according to the indicators, and in Figure 2 according to the covariates.
Fig. 1. Profile of consumers contained in each cluster (indicators)
Carlota Lorenzo-Romero et al. / Procedia - Social and Behavioral Sciences 141 (2014) 1281 – 1290
1289
Fig. 2. Profile of consumers contained in each cluster (covariates) 5. Conclusions, implications and future research The university teacher influences on the learning construction of their students effectively and efficiently, developing classroom activities that take into account the individual characteristics that present each of them [8]. Learning styles showing each student is an influential element in the creation of profiles that determine the development of a particular teaching strategy during the teaching-learning process. This paper proposes a sound methodology and a process to classify and profile Business and Economics university students according to their use of social media technologies in their learning processes and their learning styles, and discuss about its implications. We have obtained three different segments, which have been classified as “introvert”, “novel” and “social”. The results indicate that there are different segments with regard the use of Social Media technologies and, moreover, there are differences in their learning style. Students more pragmatist and activist use more the Social media technologies, and the theorist and reflector do not use them in their learning processes. With regard the Kolb scale, students who develop a Reflective observation and abstract conceptualization use more these new technologies. For teachers could be interesting to identify the different segments and try to teach according their learning styles and the use of new technologies. Moreover, as there are a high percentage of students that do not use the Social Media tools for educational purpose, may be is due to the ignorance about their advantages in their learning process. The European Higher Education Area (EHEA) places the student at the centre of the teaching-learning process. This change in the educational paradigm is linked to a methodological change that enhances the students’ active role, their initiative and critical thinking. In this scenario, blogs, wikis, SNS and generally all Social Media tools of information and communication, generate a context for developing skills such as critical thinking, autonomy, initiative, collaborative work and/or individual responsibility; all of them are key competences in the new EHEA [22]. In addition, SNS has been identified as a potential tool for education as it is used quite frequently among students. Because of these advantages, would be very interesting to try to use these new technologies in the learning process. As future research line, would be interesting study the causal relationship between the learning styles and the use of Social Media technologies in their learning processes. It is important to know if the students who have a learning style more active use these new technologies, or as they usually the new technologies are more active in their
1290
Carlota Lorenzo-Romero et al. / Procedia - Social and Behavioral Sciences 141 (2014) 1281 – 1290
learning process. References Moreno, A.J. (2012). Web 2.0 - Recurso Educativo, Ministerio de educación y Cultura. Observatorio tecnológico. Available: http://recursostic.educacion.es/observatorio/web/es/internet/web-20/1060-la-web-20-recursoseducativos Cabero, J., & Llorente, M.C. (2007). La interacción en el aprendizaje en red: uso de herramientas, elementos de análisis y posibilidades educativas. Revista Iberoamericana de Educación a Distancia RIED, 10, 2, 97-123. Cobo, C., & Pardo, H. (2007). Planetaweb 2.0. Inteligencia colectiva o medios fast food. Grup de Recerca d'Interaccions Digitals, Universitat de Vic. Flacso México: Barcelona / México DF. García, J., & García, J.N. (2013). Patterns of Web 2.0 tool use among young Spanish people. Computers & Education, 67, 105–120. AIMC (2013). Navegantes en la red. 15º encuesta AIMC a usuarios de Internet, Asociación para la Investigación de Medios de Comunicación, (marzo). Madrid: Sersa. Alonso, C.M., Gallego, D.J., & Honey, P. (1995). Los estilos de aprendizaje: procedimientos de diagnóstico y mejora (2ª edición), Mensajero, Bilbao. Martín, F., & Camarero, F. (2001). Diferencias de género en los procesos de aprendizaje en universitarios, Psicothema, 13, 4, 598-604. Castro, S., & Guzmán de Castro, B. (2005). Los estilos de aprendizaje en el enseñanza y el aprendizaje: una propuesta para su implantación, Revista de Investigación, 58, 83-102. García, J.L., Santizo, J.A., Alonso, C. (2009). Instrumentos de Medición de Estilos de Aprendizaje, Revista Estilos de Aprendizaje, 4, 4, 1-20. Kolb, D. (1984). Experiential Learning: Experience as the source of Learning and Development, Prentice-Hall, Englewood Cliffs: New Jersey. Honey, P., & Mumford, A. (1986). The manual of learning styles, P. Honey, Ardingly House, Maidenhead: Berkshire, England. Bahamón, M.J., Vianchá, M.A., Alarcón, L.L., & Bohórquez, C. (2012). Estilos y estrategias de aprendizaje: una revisión empírica y conceptual de los últimos diez años, Pensamiento Psicológico, 10, 1, 129-144. García-Fuentes, C.D., Múñoz, J.M., & Abalde, E. (2002). Universitarios y profesionales, diagnóstico de estilos de aprendizaje, Revista de Investigación Educativa, 20, 2, 339-356. Dillon, W.R., & Kumar, A. (1994). Latent Structure and Other Mixture Models in Marketing: An Integrative Survey and Overview. In: Bagozzi RP, ed. Advanced Methods of Marketing Research (pp. 259-351). Blackwell Business: Cambridge. McLachlan, G.J., & Basford, K.E. (1988). Mixture Models: Inference and Applications to Clustering. Nueva York: Marcel Dekker. McCutcheon, A.L. (1987). Latent Class Analysis. Newbury Park, CA: Sage Publications. Hagenaars, J.A. (1993). Loglinear models with Latent Variables. Sage University Paper Series on Quatitative Applications in the Social Sciencices, 07-094. Newbury Park, CA: Sage. Vermunt, J.K., & Magidson, J. (2005). Latent GOLD 4.0 User’s Guide. Belmont, Massachusetts: Statistical Innovations Inc. Barron, H. (1996). Stregths and limitations of ipsative measurement. Journal of Occupational and Organizational Psychology, 69, 49-56. Kolb, A.Y., & Kolb D.A. (2005). The Kolb Learning Style Inventory – Version 3.1. 2005 Technical specifications. MA: Hay Resource Direct. Vermunt, J.K., & Magidson, J. (2002). Latent class cluster analysis. In: Hagenaars J, McCutcheon A, eds. Applied Latent Class Models (pp. 89-106). New York: Cambridge University Press. Esteve, F. (2009). Bolonia y las TIC: de la docencia 1.0 al aprendizaje 2.0, La Cuestión Universitaria, 5, 59-68.