Scientific Computing with Multicore and Accelerators ... used in many different scientific disciplines, and illustrates how auto-tuning ..... Of course, this also.
Jack Dongarra, David A. Bader, Jakub Kurzak
Scientific Computing with Multicore and Accelerators
2
List of Figures
1.1 1.2 1.3 1.4 1.5 1.6 1.7 1.8
7- and 27-point Stencils . . . . . . . . . . . Roofline-based Performance Predictions . . Problem Decomposition . . . . . . . . . . . Common Subexpression Elimination . . . . 7-point Stencil Performance . . . . . . . . . 27-point Stencil Performance . . . . . . . . Architectural Performance Comparison . . . Architectural Energy Efficiency Comparison
. . . . . . . .
. . . . . . . .
. . . . . . . .
. . . . . . . .
. . . . . . . .
. . . . . . . .
. . . . . . . .
. . . . . . . .
. . . . . . . .
. . . . . . . .
3 10 13 17 22 23 29 29
i
ii
List of Tables
1.1 1.2 1.3
Architectural Descriptions . . . . . . . . . . . . . . . . . . . . Stencil Characteristics . . . . . . . . . . . . . . . . . . . . . . Optimizations Employed . . . . . . . . . . . . . . . . . . . . .
6 8 18
iii
iv
Contents
1 Auto-tuning Stencil Computations on Multicore and Accelerators 1 Kaushik Datta, Samuel Williams, Vasily Volkov, Jonathan Carter, Leonid Oliker, John Shalf, and Katherine Yelick 1.1 Introduction . . . . . . . . . . . . . . . . . . . . . . . . . . . 2 1.2 Stencil Overview . . . . . . . . . . . . . . . . . . . . . . . . . 3 1.3 Experimental Testbed . . . . . . . . . . . . . . . . . . . . . . 4 1.4 Performance Expectation . . . . . . . . . . . . . . . . . . . . 5 1.4.1 Stencil Characteristics . . . . . . . . . . . . . . . . . . 5 1.4.2 A Brief Introduction to the Roofline Model . . . . . . 7 1.4.3 Roofline Model-based Performance Expectations . . . 9 1.5 Stencil Optimizations . . . . . . . . . . . . . . . . . . . . . . 12 1.5.1 Parallelization and Problem Decomposition . . . . . . 13 1.5.2 Data Allocation . . . . . . . . . . . . . . . . . . . . . . 14 1.5.3 Bandwidth Optimizations . . . . . . . . . . . . . . . . 15 1.5.4 In-core Optimizations . . . . . . . . . . . . . . . . . . 16 1.5.5 Algorithmic Transformations . . . . . . . . . . . . . . 17 1.6 Auto-Tuning Methodology . . . . . . . . . . . . . . . . . . . 18 1.6.1 Architecture-Specific Exceptions . . . . . . . . . . . . 19 1.7 Results and Analysis . . . . . . . . . . . . . . . . . . . . . . 21 1.7.1 Nehalem Performance . . . . . . . . . . . . . . . . . . 21 1.7.2 Barcelona Performance . . . . . . . . . . . . . . . . . 24 1.7.3 Clovertown Performance . . . . . . . . . . . . . . . . . 25 1.7.4 Blue Gene/P Performance . . . . . . . . . . . . . . . . 25 1.7.5 Victoria Falls Performance . . . . . . . . . . . . . . . 26 1.7.6 Cell Performance . . . . . . . . . . . . . . . . . . . . . 27 1.7.7 GTX280 Performance . . . . . . . . . . . . . . . . . . 28 1.7.8 Cross Platform Performance and Power Comparison . 28 1.8 Conclusions . . . . . . . . . . . . . . . . . . . . . . . . . . . . 31 1.9 Acknowledgments . . . . . . . . . . . . . . . . . . . . . . . . 32 Bibliography
33
v
vi
Chapter 1 Auto-tuning Stencil Computations on Multicore and Accelerators Kaushik Datta University of California, Berkeley Samuel Williams Lawrence Berkeley National Laboratory Vasily Volkov University of California, Berkeley Jonathan Carter Lawrence Berkeley National Laboratory Leonid Oliker Lawrence Berkeley National Laboratory John Shalf Lawrence Berkeley National Laboratory Katherine Yelick Lawrence Berkeley National Laboratory 1.1 1.2 1.3 1.4
1.5
1.6 1.7
Introduction . . . . . . . . . . . . . . . . . . . . . . . . . . . . . . . . . . . . . . . . . . . . . . . . . . . . . . . . . . . . . . . Stencil Overview . . . . . . . . . . . . . . . . . . . . . . . . . . . . . . . . . . . . . . . . . . . . . . . . . . . . . . . . . . Experimental Testbed . . . . . . . . . . . . . . . . . . . . . . . . . . . . . . . . . . . . . . . . . . . . . . . . . . . . . Performance Expectation . . . . . . . . . . . . . . . . . . . . . . . . . . . . . . . . . . . . . . . . . . . . . . . . . 1.4.1 Stencil Characteristics . . . . . . . . . . . . . . . . . . . . . . . . . . . . . . . . . . . . . . . . . . . . 1.4.2 A Brief Introduction to the Roofline Model . . . . . . . . . . . . . . . . . . . . . . 1.4.3 Roofline Model-based Performance Expectations . . . . . . . . . . . . . . . . . Stencil Optimizations . . . . . . . . . . . . . . . . . . . . . . . . . . . . . . . . . . . . . . . . . . . . . . . . . . . . . 1.5.1 Parallelization and Problem Decomposition . . . . . . . . . . . . . . . . . . . . . . 1.5.2 Data Allocation . . . . . . . . . . . . . . . . . . . . . . . . . . . . . . . . . . . . . . . . . . . . . . . . . . . 1.5.3 Bandwidth Optimizations . . . . . . . . . . . . . . . . . . . . . . . . . . . . . . . . . . . . . . . . . 1.5.4 In-core Optimizations . . . . . . . . . . . . . . . . . . . . . . . . . . . . . . . . . . . . . . . . . . . . . 1.5.5 Algorithmic Transformations . . . . . . . . . . . . . . . . . . . . . . . . . . . . . . . . . . . . . Auto-Tuning Methodology . . . . . . . . . . . . . . . . . . . . . . . . . . . . . . . . . . . . . . . . . . . . . . . . 1.6.1 Architecture-Specific Exceptions . . . . . . . . . . . . . . . . . . . . . . . . . . . . . . . . . . Results and Analysis . . . . . . . . . . . . . . . . . . . . . . . . . . . . . . . . . . . . . . . . . . . . . . . . . . . . . . 1.7.1 Nehalem Performance . . . . . . . . . . . . . . . . . . . . . . . . . . . . . . . . . . . . . . . . . . . . . 1.7.2 Barcelona Performance . . . . . . . . . . . . . . . . . . . . . . . . . . . . . . . . . . . . . . . . . . . .
2 3 4 5 5 7 9 12 13 14 15 16 17 17 19 21 21 24
1
2
1.8 1.9
1.1
Scientific Computing with Multicore and Accelerators 1.7.3 Clovertown Performance . . . . . . . . . . . . . . . . . . . . . . . . . . . . . . . . . . . . . . . . . . 1.7.4 Blue Gene/P Performance . . . . . . . . . . . . . . . . . . . . . . . . . . . . . . . . . . . . . . . . 1.7.5 Victoria Falls Performance . . . . . . . . . . . . . . . . . . . . . . . . . . . . . . . . . . . . . . . . 1.7.6 Cell Performance . . . . . . . . . . . . . . . . . . . . . . . . . . . . . . . . . . . . . . . . . . . . . . . . . . 1.7.7 GTX280 Performance . . . . . . . . . . . . . . . . . . . . . . . . . . . . . . . . . . . . . . . . . . . . . 1.7.8 Cross Platform Performance and Power Comparison . . . . . . . . . . . . . Conclusions . . . . . . . . . . . . . . . . . . . . . . . . . . . . . . . . . . . . . . . . . . . . . . . . . . . . . . . . . . . . . . . . Acknowledgments . . . . . . . . . . . . . . . . . . . . . . . . . . . . . . . . . . . . . . . . . . . . . . . . . . . . . . . . .
24 25 26 27 28 28 31 32
Introduction
The recent transformation from an environment where gains in computational performance came from increasing clock frequency and other hardware engineering innovations, to an environment where gains are realized through the deployment of ever increasing numbers of modest performance cores has profoundly changed the landscape of scientific application programming. This exponential increase in core count represents both an opportunity and a challenge: access to petascale simulation capabilities and beyond will require that this concurrency be efficiently exploited. The problem for application programmers is further compounded by the diversity of multicore architectures that are now emerging [4]. From relatively complex out-of-order CPUs with complex cache structures, to relatively simple cores that support hardware multithreading, to chips that require explicit use of software controlled memory, designing optimal code for these different platforms represents a serious impediment. An emerging solution to this problem is auto-tuning: the automatic generation of many versions of a code kernel that incorporate various tuning strategies, and the benchmarking of these to select the highest performing version. Typical tuning strategies might include: maximizing in-core performance with loop unrolling and restructuring; maximizing memory bandwidth by exploiting non-uniform memory access (NUMA), engaging prefetch by directives; and minimizing memory traffic by cache blocking or array padding. Often a key parameter is associated with each tuning strategy (e.g. the amount of loop unrolling or the cache blocking factor), and these parameters must be explored in addition to the layering of the basic strategies themselves. This study focuses on the key numerical technique of stencil computations, used in many different scientific disciplines, and illustrates how auto-tuning can be used to produce very efficient implementations across a diverse set of current multicore architectures. In Section 1.2, we give an overview of the two stencils studied, followed by a description of the multicore architectures that form our testbed in Section 1.3. This is followed, in Section 1.4, by our performance expectations across the testbed based on the computational characteristics of the stencil kernels coupled with a Roofline model analysis. We summarize the applied optimizations and the parameter search in Sections 1.5
Auto-tuning Stencil Computations on Multicore and Accelerators
z
3
weight point by α
z
weight point by β weight point by γ
y
weight point by δ
y x
(a)
x
(b)
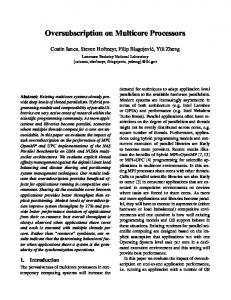
FIGURE 1.1: Visualization of the two stencils used in this work. (a) 7-point stencil (b) 27-point stencil. Note: color represents the weighting factor for each point in the linear combination stencils. and 1.6. Finally, we present performance results followed by conclusions in Sections 1.7 and 1.8.
1.2
Stencil Overview
Partial differential equation (PDE) solvers are employed by a large fraction of scientific applications in such diverse areas as heat diffusion, electromagnetics, and fluid dynamics. These applications are often implemented using iterative finite-difference or similar techniques that sweep over a spatial grid, performing nearest neighbor computations called stencils. In the simplest stencil operations, each point in the grid is updated with a linear combination of its neighbors in both time and space. These operations are then used to build solvers that range from simple Jacobi iterations to complex multigrid and adaptive mesh refinement methods [5]. Stencil calculations perform global sweeps through data structures that are typically much larger than the capacity of the available data caches. In addition, the degree of data reuse is limited to the number of points in a stencil, typically less than 30. As a result, these computations generally achieve a low fraction of theoretical peak performance on modern microprocessors as data cannot be transferred from main memory fast enough to avoid stalling the computational units. Reorganizing these stencil calculations to take full advantage of memory hierarchies has been the subject of much investigation over the years. These have principally focused on tiling optimizations [19, 22, 23] that attempt to exploit locality by performing operations on cache-sized blocks of data before moving on to the next block. As seen in Chapter 11 it is possible to block explicit stencil methods in the time dimension in addition to the three spatial dimensions. Such strategies can dramatically improve performance by
4
Scientific Computing with Multicore and Accelerators
increasing arithmetic intensity. A study of stencil optimization [16] on (singlecore) cache-based platforms found that tiling optimizations were primarily effective when the problem size exceeded the on-chip cache’s ability to exploit temporal recurrences. A more recent study of lattice-Boltzmann methods [28] employed auto-tuners to explore a variety of effective strategies for refactoring lattice-based problems for multicore processing platforms. This study expands on prior work by developing new optimization techniques and applying them to a broader selection of processing platforms including accelerators like the Cell Broadband Engine and GPUs. In this work, we explore the performance of a single Jacobi (out-of-place) iteration of the 3D 7-point and 27-point stencils. In Jacobi method, we maintain two separate double-precision (DP) 3D arrays. In a given iteration, one array is only read from and the second is only written to. This avoids all data dependencies and maximizes parallelism. The 7-point stencil, shown in Figure 1.1(a), weights the center point by some constant α and the sum of its six neighbors (two in each dimension) by a second constant β. Na¨ıvely, a 7-point stencil sweep can expressed as a triply nested ijk loop over the following computation: Bi,j,k
= αAi,j,k + β(Ai−1,j,k + Ai,j−1,k + Ai,j,k−1 + Ai+1,j,k + Ai,j+1,k + Ai,j,k+1 ) (1.1)
where each subscript represents the 3D index into array A or B. The 27-point 3D stencil, as shown in Figure 1.1(b), is similar to the 7-point stencil, but with additional points to include the edge and corner points of a 3×3×3 cube surrounding the center grid point. It also introduces two additional constants — γ, to weight the sum of the edge points, and δ, to weight the sum of the corner points. Across all machines and experiments we preserve the stencil functionality and mandate a common, albeit parameterized, data structure.
1.3
Experimental Testbed
Although all multicore processor computers implement a cache-based shared memory architecture, their microarchitectural implementations are extremely diverse. As such, the work required to attain good performance and efficiency varies dramatically among them. Programming heterogeneous, accelerator-based computers compounds this challenge as there is no consensus on the broader question of memory hierarchy. To fully appreciate and understand the effects of architectural decisions and to demonstrate the ability of our auto-tuner to provide performance portability, we use one of the broadest set of computers imaginable. Although the node architectures are
Auto-tuning Stencil Computations on Multicore and Accelerators
5
diverse, they represent the building-blocks of current and future ultra-scale supercomputing systems. The key architectural features of these systems appears in Table 1.1. The details of these machines can be found in the literature [1, 2, 8–11, 13–15, 20, 21, 24]. In addition to using the recent evolution of commodity x86 processor architectures (Intel’s Core2, AMD’s Barcelona, Intel’s Nehalem) which represent the addition of integrated memory controllers and multithreading, we also examine IBM’s Blue Gene/P compute node, as well as the Sun’s chip multithreaded (CMT) dual-socket Niagara2 (Victoria Falls). Although the in-order BGP will deliver rather low per-node performance, because it is optimized for power-efficiency, its value in ultra scale systems is immense. Unlike the other architectures, Niagara2 uses CMT to solve the instruction- and memory-level parallelism challenges with a single programming paradigm. To explore the advantages of using accelerators, we explored both performance and efficiency for both the QS22 PowerXCell 8i enhanced double precision Cell blade as well the GTX280 GPU. Cell uses a shared memory programming model in which all threads, regardless of the core they run on, may access a common pool of DRAM. Cell exploits heterogeneity (essentially productivity vs. efficiency) in that the PowerPC cores use caches, but the SPE’s use disjoint, DMA-filled, local stores. Conversely, the GPU employs a partitioned DRAM memory. GPU cores may directly address the GPU DRAM, but may not address CPU DRAM. Such an architecture allows specialization in the form of optimization for capacity or performance; the GPU DRAM bandwidth is far greater than any other architecture. We obviate the complexity of this architecture (shuffling data between the CPU and GPU) by assuming the problems of interest fit within GPU DRAM. The GPU cores use a local store architecture similar to Cell, but fill it via multithreaded vector loads rather than DMA.
1.4
Performance Expectation
Before discussing potential optimizations or performance results, we first perform some basic kernel analysis to set realistic performance expectations. We commence with some analysis of the two kernels (and a substantive optimization to the latter) and proceed to analyzing their performance on each of our seven architectures of interest.
1.4.1
Stencil Characteristics
Consider the 7-point stencil. We observe that in the na¨ıve implementation each stencil presents 7 reads and 1 write to the memory subsystem. In the 27point stencil, the number of reads per stencil increases to 27, but the number
6
Scientific Computing with Multicore and Accelerators
Intel AMD Core Nehalem Barcelona Clock (GHz) 2.66 2.30 type OoO1 OoO threads 2 1 per core DP (GFlop/s) 10.7 9.2 local store — — L1 D$ 32KB 64KB private L2$ 256KB 512KB
Intel Core2 2.66 OoO
Intel AMD Nehalem Barcelona
Intel Core2
Socket cores per socket shared LL$ memory parallelism
Node sockets per SMP Peak DP (GFlop/s) DRAM Pin BW (GB/s) Flop:Byte DRAM size (GB) DRAM type System Power (W)4 Threading Compiler STREAM (GB/s)
IBM Sun STI Cell NVIDIA PPC450d Niagara2 eDP SPE GT200 SM 0.85 1.16 3.20 1.30 in-order in-order in-order vector
1
1
8
1
82
10.7 — 32KB —
3.4 — 32KB —
1.16 — 8KB —
12.8 256KB — —
2.6 16KB3 — —
IBM Sun STI Cell NVIDIA BGP chip Niagara2 Processor GT200 8 SPEs 4 4 4 (MCM) 4 8 30 + 1 PPE 2×4MB 8MB 2MB 8MB 4MB — — (2 cores/$) HW HW HW HW MT w/ MT DMA prefetch prefetch prefetch prefetch coalescing
Xeon Opteron Xeon BGP UltraSparc QS22 GeForce X5550 2356 E5355 Compute T5140 Cell Blade GTX280 Nehalem Barcelona Clovertown Node VF 1 GPU 2 2 2 1 2 2 (+CPU) 85.3
73.6
85.3
13.6
18.7
204.8
78.0
51.2
21.33
21.33(Rd) 10.66(Wr)
13.6
42.66(Rd) 21.33(Wr)
51.2
141
1.66
3.45
2.66
1.00
0.29
4.00
0.55
32
16
16
12
DDR31066
DDR2800
FBDIMM667
375
350
530
315
610
2655
POSIX Threads icc 10.0
POSIX Threads xlc 9.0
POSIX Threads gcc 4.0.4
libspe 2.1 gcc 4.1.1
1 (device) 4 (host) GDDR31100 450 (236)6 CUDA 2.0 nvcc 0.2.1221
7.16
12.8
24.9
37
127
POSIX POSIX Threads Threads icc icc 10.0 10.0 35.3
15.2
2
32
DDR2- FBDIMM425 667
DDR2800
TABLE 1.1: Architectural summary of evaluated platforms. 1 Superscalar Out-of-Order (OoO). 2 Concurrent CUDA thread blocks (max 8) per SM. 3 16 KB local-store partitioned among concurrent thread blocks. 4 System power was measured with a digital power meter while under full computational load. 5 Power running Linpack averaged per blade. (www.top500.org) 6 GTX280 system power shown for the entire system under load (450W) and GTX280 card itself (236W).
Auto-tuning Stencil Computations on Multicore and Accelerators
7
of writes remains 1. However, when one considers adjacent stencils, we observe substantial reuse. Thus, to attain good performance, a cache (if present) must filter the requests and present only the two compulsory (in 3C’s parlance) requests per stencil to DRAM [12]. There are two compulsory requests per stencil because every point in the grid must be read once and written once. One should be mindful that many caches are write allocate. That is, on a write miss, they first load the target line into the cache. Such an approach implies that writes generate twice the memory traffic as reads even if those addresses are written but never read. The two most common approaches to avoiding this superfluous memory traffic are write through caches or cache bypass stores. Table 1.2 shows the per stencil average characteristics for both the 7and 27-point stencils as well as the highly optimized common subexpression elimination (CSE) version of the 27-point stencil (discussed in detail in Section 1.5.4). Observe that all three stencils perform dramatically different numbers of floating-point operations and loads. Although an ideal cache would distill these loads and stores into 8 bytes of compulsory DRAM read traffic and 8 bytes of compulsory DRAM write traffic, caches are typically not write through, infinite in capacity, or fully associative. As na¨ıve codes are not cache blocked, we expect an additional 8 bytes of DRAM write allocate traffic, and another 16 bytes of capacity miss traffic (based on the caches found in superscalar processors and the reuse pattern of these stencils) — a 2.5× increase in memory traffic. Auto-tuners for structured grids will actively or passively attempt to elicit better cache behavior and less memory traffic on the belief that reducing memory traffic and exposed latency will improve performance. If the auto-tuner can eliminate all cache misses, we can improve performance by 1.65×, but if the auto-tuner also eliminates all write allocate traffic, then it may improve performance by 2.5×. Arithmetic intensity is a particularly useful term in bounding performance expectations. For our purposes, we define arithmetic intensity as the ratio of floating-point operations to DRAM bytes transferred (i.e. the memory traffic not filtered by the cache). High arithmetic intensities suggest high temporal locality and thus a propensity to achieve high performance. Low arithmetic intensities imply very little computation per memory transaction and thus performance limited by memory bandwidth. In the latter case, performance is bounded by the product of arithmetic intensity and DRAM bandwidth.
1.4.2
A Brief Introduction to the Roofline Model
The Roofline model [27, 29, 30] provides a visual assessment of potential performance and impediments to performance constructed using bound and bottleneck analysis [18]. Each model is constructed using a communicationcomputation abstraction where data is moved from a memory to computational units. This “memory” could be registers, L1, L2, or L3, but is typically DRAM. Computation for our purposes will be the floating-point datapaths. We use arithmetic intensity as a means of expressing the balance between
8
Scientific Computing with Multicore and Accelerators Memory Traffic (Bytes) Arithmetic (per stencil) Compulsory Write Capacity Intensity Type flops $ refs Reads WB’s Allocate Misses Na¨ıve Optimized 7-pt
8
8
8
8
8
16
0.20
0.33 (0.50)
27-pt
30
28
8
8
8
16
0.75
1.25 (1.88)
27-pt (CSE)
18
10
8
8
8
16
0.45
0.75 (1.13)
TABLE 1.2: Average stencil characteristics. Arithmetic Intensity is Total Flops Total DRAM Bytes . WB is an abbreviation for write back. Numbers in parentheses assume exploitation of cache bypass. Capacity misses are estimated based on capturing only the temporal recurrence within a plane. The potential benefit from auto-tuning (elimination of write allocations and capacity misses) is about 1.65× and 2.5× using cached and cache-bypass stores respectively.
computation and communication. Often a first order model (e.g. DRAM–FP) is sufficient for a given architecture for a range of similar kernels. However, for certain kernels, depending on the degree of optimization, bandwidth from the L3 could be the actual bottleneck. For purposes of this paper, we will only use a DRAM–FP Roofline model. The Roofline Model defines three types of potential bottlenecks: computation, communication, and locality (arithmetic intensity). Evocative of the roofline analogy, these are labeled as ceilings and walls. The in-core ceilings (or computation bounds) are perhaps the easiest to understand. To achieve peak performance, a number of architectural features must be exploited — threadlevel parallelism (e.g. multicore), instruction-level parallelism (e.g. keep functional units busy by unrolling and jamming loops), data-level parallelism (e.g. SIMD), and proper instruction mix (e.g. balance between multiplies and adds or total use of fused multiply add). If one fails to exploit one of these (either a failing of the compiler or programmer), the performance is diminished. We define ceilings as impenetrable impediments to improved performance without the corresponding optimization. Bandwidth ceilings are similar but are derived from incomplete expression and exploitation of memorylevel parallelism. As such we often define ceilings such as no NUMA, or no prefetching. Finally, locality walls represent the balance between computation and communication. For many kernels the numerator of this ratio is fixed (i.e. the number of floating-point operations is fixed), but the denominator varies as compulsory misses are augmented with capacity or, conflict misses, as well as speculative or write allocation traffic. As these terms are progressively added they define a new arithmetic intensity and thus a new locality wall. Moreover, for each of these terms there is a corresponding optimization which must be applied (e.g. cache blocking for capacity misses, array padding for
Auto-tuning Stencil Computations on Multicore and Accelerators
9
conflict misses, or cache bypass for write allocations) to remove this potential impediment to performance. It should be noted that the ordering of ceilings is based on the perceived abilities of compilers. Those ceilings least likely to be addressed by a compiler are placed at the top. One may use the Roofline model to identify potential bottlenecks for each architecture. Given an arithmetic intensity, one may simply scan upward from the x-axis. Performance may not exceed a ceiling until the corresponding optimization has been implemented. For example, with cache bypass, the 27-point stencil on Nehalem requires full instruction-level parallelism (ILP) including unroll and jam, full data-level parallelism using SSE instructions (SIMDization), and NUMA-aware allocation to have any hope of achieving peak performance. Conversely, without cache bypass, the 7-point will not even require full thread-level parallelism (TLP), that is using all cores, to achieve peak performance.
1.4.3
Roofline Model-based Performance Expectations
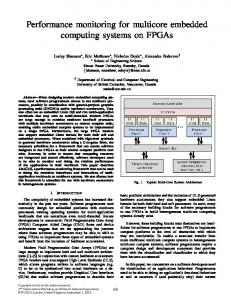
Figure 1.2 presents a Roofline Model for each of our seven computers. The table in the legend describes the parallelism mix for each in-core ceiling and defines a circular symbol (A,B,C,D) for cross-referencing the figure. The incore ceilings are based on theoretical architectural capabilities. Similarly, we define a series of bandwidth ceilings based on empirical performance obtained via an optimized version of the STREAM benchmark that can be configured not to exploit NUMA or cache-bypass [6]. These are denoted by diamonds X, Y, and Z. Hashed bars represent the expected per-architecture range in ideal arithmetic intensity for the 7- and 27-point (non-CSE) stencils differentiated by use of cache-bypass instructions (see Section 1.5.3) or a local store architecture. Although cache-bypass behavior can improve arithmetic intensity by 50%, depending on the implemented optimizations and the underlying architecture, commensurate improvements in performance may not be attainable. Please note, there is a range in arithmetic intensity due to explicit array padding, speculative loads from hardware prefetchers, implicit ghost zones arising from cache blocking, and potential conflict misses. Although on a local store architecture like Cell, DMA provides us the ability to more precisely set a tighter upper limit to arithmetic intensity, the obscurities of memory coalescing and minimum memory quanta (opaque microarchitectural issues) on the GTX280 results in a somewhat larger range in arithmetic intensity. Moreover, only a CSE version of the 27-point stencil was implemented on the GTX280. Finally, for clarity we express roofline-predicted performance in GFlop/s. To convert to GStencil/s, divide the 7-point stencil by 8, and the 27-point (non-CSE) stencil by 30. Using the Roofline models for the architectures in Figure 1.2, combined with the knowledge of each kernel’s arithmetic intensity and instruction mix, we may not only bound ultimate performance for each architecture, but also broadly enumerate the optimizations required to achieve it.
Scientific Computing with Multicore and Accelerators
8
D
4
8
8
1/
11/
2 4 8 16 4 2 1 Arithmetic Intensity
1/
BlueGene/P
128
64 32
16
A
57% of peak
8
B
4
GFlop/s
64
8
1/
50% FP 25% FP
4
12% FP
11/
1/ 1/ 2 4 8 16 4 2 1 Arithmetic Intensity
128 Cell Blade 64
B
128
C
64
D
8
GFlop/s
16
A
Expected Range in Arithmetic Intensity
25% FP
4
8
1/
1/
2 4 8 16 4 2 1 Arithmetic Intensity
100% FP
8 2 11/
Ceilings
A 100% 0% 100% max max
70% of peak
50% FP
4
1/ 1/ 2 4 8 16 4 2 1 Arithmetic Intensity
Roofline Performance Envelope
GTX280
16
2
8
Expected Range in Arithmetic Intensity with Cache Bypass
1/ 1/ 2 4 8 16 4 2 1 Arithmetic Intensity
32
32
11/
8
A 57% of peak
D
Legend
Victoria Falls
2 8
8
11/
2 4 8 16 4 2 1 Arithmetic Intensity
8
C
C
4
1/
16
2
B
2
128
32 GFlop/s
D
4
A
57% of peak
16
2
11/
GFlop/s
32
C
16
2
11/
B
TLP
16
32
64
ILP
C
57% of peak
Clovertown
128 A
FMA
GFlop/s
32
64
SIMD
B
Barcelona
128
FPAdd
64
A
57% of peak
GFlop/s
Nehalem
128
GFlop/s
10
A B
B
0% 100%100% max max
C
0% 100% 0%
D
0% 100% 0% none max
max max
STREAM Peak STREAM w/out NUMA 8
1/
1/
2 4 8 16 4 2 1 Arithmetic Intensity
STREAM w/out movntpd
FIGURE 1.2: Roofline model-predicted performance (in GFlop/s) for both the 7- and the (non-CSE) 27-point stencils with and without write allocate. Notes: The table in the legend provides a symbol and definition for each type of ceiling. The ceilings for Victoria Falls and the GTX280 are the fraction of the dynamic instruction mix that is floating-point. Victoria Falls and Blue Gene/P do not exploit cache bypass (they always use write allocate).
Nehalem: For the 7-point stencil, Nehalem will ultimately be memorybound with or without cache-bypass. Given the STREAM bandwidth and ideal arithmetic intensity, 17 GFlop/s (2.1 GStencil/s) is a reasonable performance bound. To achieve it, some instruction-level parallelism or data-level parallelism coupled with correct NUMA allocation is required. However, as we move to the 27-point stencil, we observe that Nehalem will likely become compute limited; likely achieving between 40 and 49 GFlop/s (1.3–1.6 GStencil/s). There is some uncertainty here due to the confluence of a broad
Auto-tuning Stencil Computations on Multicore and Accelerators
11
range in arithmetic intensity at a point on the roofline where computation is nearly balanced with communication. The transition from memory-bound to compute-bound implies that the benefits of cache-bypass will be significantly diminished as one moves from the 7-point to the 27-point stencil. Barcelona: When one considers Barcelona, a processor architecturally similar to Nehalem but built on a previous generation’s technology, we see that although it exhibits similar computational capability, its substantially lower memory bandwidth mandates that all stencil kernels be memory-bound. Barcelona should be limited to 7.3 GFlop/s (0.9 GStencil/s) and 29 GFlop/s (0.98 GStencil/s) for the 7- and 27-point stencils respectively. However, to achieve high performance on the latter, SIMD (DLP), substantial unrolling (ILP), and proper NUMA allocation will be required. Clovertown: Our third x86 architecture is Intel’s Clovertown; an even older, front side bus (FSB) based architecture. It too has similar computational capabilites to Nehalem and Barcelona, but has even lower memory bandwidth. As such, all kernels will be memory-bound. Interestingly, although the STREAM benchmark time-to-solution is superior using the cache-bypass store (movntpd instruction), the observed STREAM bandwidth (based on total bytes including those from write allocations) is substantially lower than the standard bandwidth (movpd instruction). As such, the benefit of exploiting cache bypass on stencil operations is muted to perhaps 20% instead of the ideal 50%. Clovertown will be so heavily memory-bound that simple parallelization should be enough to achieve peak performance on the 7-point, where only moderate unrolling is sufficient on the 27-point. We expect Clovertown performance to be limited to 2.9 GFlop/s (0.36 GStencil/s) and 12 GFlop/s (0.39 GStencil/s) for the 7- and 27-point stencils respectively Blue Gene/P: Architectures like the chip used in Blue Gene/P are much more balanced, dedicating a larger fraction of their power and design budget to DRAM performance. This is not to say they have higher absolute memory bandwidth, but rather the design is more balanced given the low frequency quad core processors. As we were not able to exploit cache bypass we see substantially lower arithmetic intensity than the x86 architectures. This simple, first order model suggests that if we were able to perfectly SIMDize and unroll the code, we would expect the 7-point stencil to be memory bound, yielding 4.1 GFlop/s or 0.5 GStencil/s, but the 27-point to be compute-bound limited by the relatively small fraction of multiplies in the code to 7.8 GFlop/s or 0.26 GStencil/s. This may be difficult to achieve given the limited issue-width and in-order PPC450 architecture. Victoria Falls: Although Victoria Falls uses a dramatically different mechanism for expression of memory-level parallelism (massive thread-level parallelism), its performance characteristics should be similar to Blue Gene/P in that it will be memory bound for the 7-point stencil, and compute-bound for the 27-point with performances of 7.5 GFlop/s (0.94 GStencil/s) and 18.6 GFlop/s (0.6 GStencil/s) respectively. We did not exploit any form of cache-bypass on Victoria Falls. As multithreading provides an attractive so-
12
Scientific Computing with Multicore and Accelerators
lution to avoiding the ILP pitfall, our primary concern after proper NUMA allocations is that floating-point instructions dominate the instruction mix on the 27-point stencil. As such, the Victoria Falls Roofline is shown with computational ceilings corresponding to various ratios of floating-point instructions. Cell: Although Cell is a local store-based architecture, we may seamlessly analyze it using the Roofline model. DMA obviates the need for write allocate behavior, but comes with a severe alignment penalty. With proper array padding and blocking for a rather small local store, we may achieve 78% of the ideal x86 arithmetic intensity. More succinctly, Cell will certainly generate more compulsory and capacity memory traffic than its x86 counterparts. Unfortunately, this is a rather unattractive situation given the QS22’s DDR2-based memory bandwidth is now no higher than the top-of-the-line x86 Nehalem processor. As such, we expect Cell to be memory-bound on both stencils, delivering up to 17.6 GFlop/s (2.2 GStencil/s) and 70.6 GFlop/s (2.35 GStencil/s). NUMA and appropriate loop unrolling will be required for both, and SIMDization for the latter. GTX280: Although one could ostensibly classify the GTX280 as a local store-based architecture, the lack of documentation on the memory subsystem behavior results in a wide range of possible arithmetic intensities. Overall, the shape of the roofline for the GTX280 is much more in line with Blue Gene/P (albeit a much higher roofline) than with Cell. Unfortunately, for the 7-point stencil to achieve peak performance (52 GFlop/s or 6.5 GStencil/s), we would require 100% of the dynamic instructions to be floating-point. As a large fraction will need to be loads and address calculations, we expect performance to be significantly lower. It should be noted that just as cache based microarchitectures must access DRAM in full cache lines, the GPU microarchitecture must access DRAM in units of the memory quanta. This complexity is hidden from programmers, but the performance impacts may come as a surprise. That is, if the memory quanta were large, arithmetic intensity would be so depressed (lack of spatial locality on certain accesses) that the 7-point stencil might become memory bound. Due to the complexity of GPU programming, only the common subexpression elimination (CSE) version of the 27-point stencil was implemented. Given user and compiler elimination of floatingpoint operations, the number of operations per stencil was reduced to about 17. Although this pushes the kernel toward the memory-bound region, it can significantly improve performance to about 3.2 GStencil/s. Of course, this also assumes the unrealistic 100% floating-point instruction mix.
1.5
Stencil Optimizations
Compilers utterly fail to achieve satisfactory stencil code performance (even with manual pthread parallelization) because implementations optimal
Auto-tuning Stencil Computations on Multicore and Accelerators
13
Stream in planes from source grid TX
TY
NZ
CZ
RX RY RZ
CZ
+Z
+Y NY
+X NX
(unit stride)
(a) Decomposition of a Node Block into a Chunk of Core Blocks
CY
CX
(b) Decomposition into Thread Blocks
TY
TX
(c) Decomposition into Register Blocks
Stream out planes to target grid
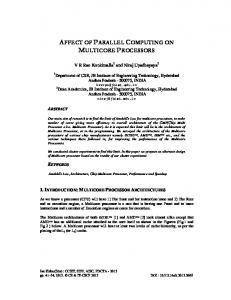
FIGURE 1.3: (LEFT) Four-level problem decomposition: In (a), a node block (the full grid) is broken into smaller chunks. One core block from the chunk in (a) is magnified in (b). A single thread block from the core block in (b) is then magnified in (c) and decomposed into register blocks. (RIGHT) Circular queue optimization: planes are streamed into a queue containing the current time step, processed, written to out queue, and streamed back.
for one microarchitecture may deliver suboptimal performance on another (an artifact perhaps eventually mitigated by incorporating auto-tuning into compilers). Moreover, their ability to infer legal domain-specific transformations, given the freedoms of the C language, is limited and permanent. To that end, we discuss a number of optimizations at the source level to improve stencil performance, including: NUMA-aware data allocation, array padding, multilevel blocking, loop unrolling and reordering, common subexpression elimination, as well as prefetching for cache-based architectures and DMA for local-store based architectures. Additionally, we present two novel stencil optimizations: circular queue and thread blocking. The optimizations can roughly be divided into five categories: problem decomposition (parallelization), data allocation, bandwidth optimizations, in-core optimizations, and algorithmic transformations. In this section, we discuss each of these techniques in greater detail. Then, in Section 1.6, we cover our overall auto-tuning strategy, including architecture-specific exceptions. These optimizations are an extension of those used in our previous work [7].
1.5.1
Parallelization and Problem Decomposition
In this work, we examine parallelization through threading and geometric problem decomposition. Across all architectures, we applied a four-level geometric decomposition strategy, visualized in Figure 1.3(left), that simultaneously implements parallelization, cache blocking, and loop unrolling. This multilevel decomposition encompasses three separate optimizations: core blocking, thread blocking, and register blocking. Note that the nature of out-of-place it-
14
Scientific Computing with Multicore and Accelerators
erations implies that all blocks are independent and can be computed in any order. This greatly facilitates parallelization. We now discuss the decomposition strategy from the largest structures to the finest. First, a node block (the entire problem) of size NX × NY × NZ is partitioned in all three dimensions into smaller core blocks of size CX × CY × CZ , where X is the unit stride dimension. This first step is designed to avoid last level cache capacity misses by effectively cache blocking the problem. Each core block is further partitioned into a series of thread blocks of size TX × TY × CZ . Core blocks and thread blocks are the same size in the Z (least unit stride) dimension, so when T X = CX and T Y = CY , there is only one thread per core block. This second decomposition is designed to exploit the common locality threads may have within a shared cache or local memory. Then, our third decomposition partitions each thread block into register blocks of size RX ×RY ×RZ . The dimensions of the register block indicate how many times the inner loop has been unrolled in each of the three dimensions. This allows us to explicitly express data- and instruction-level parallelism rather that assuming the compiler may discover it. To facilitate NUMA allocation, core blocks are grouped together into chunks of size ChunkSize and assigned in bulk to an individual core. The CY number of threads in a core block (Threads core ) is simply CX T X × T Y , so we then assign these chunks to groups of Threads core threads in a round-robin fashion (similar to the schedule clause in OpenMP’s parallel for directive). Note that all the core blocks in a chunk are processed by the same subset of threads. When ChunkSize is large, concurrent core blocks may map to the same set in cache, causing conflict misses. However, we do gain a benefit from diminished NUMA effects. In contrast, when ChunkSize is small, concurrent core blocks are mapped to contiguous set addresses in a cache, reducing conflict misses. This comes at the price of magnified NUMA effects. We therefore tune ChunkSize to find the best tradeoff of these two competing effects. In general, this decomposition scheme allows us to explain shared cache locality, cache blocking, register blocking, and NUMA-aware allocation within a single formalism.
1.5.2
Data Allocation
The layout of our data array can significantly affect performance. As a result, we implemented a NUMA-aware allocation to minimize inter-socket communication and array padding to minimize intra-thread conflict misses. Our stencil code implementation allocates the source and destination grids as separate large arrays. On non-uniform memory access (NUMA) systems that implement a “first touch” page mapping policy, a memory page will be mapped to the socket where it is initialized. Na¨ıvely, if we let a single thread fully initialize both arrays, then all the memory pages containing those arrays will be mapped to that particular socket. Then, if we used threads across
Auto-tuning Stencil Computations on Multicore and Accelerators
15
multiple sockets to perform array computations, they would perform expensive inter-socket communication to retrieve their needed data. Since our decomposition strategy has deterministically specified which thread will update each array point, a better alternative is to let each thread initialize the points that it will later be processing. This NUMA-aware allocation correctly pins data to the socket tasked to update it. This optimization is only expected to help when we scale from one socket to multiple sockets, but without it, performance on memory-bound architectures could easily be cut in half. The second data allocation optimization that we utilized is array padding. Some architectures have relatively low associativity shared caches, at least when compared to the product of threads and cache lines required by the stencil. On such computers, conflict misses can significantly impair performance. In other cases, some architectures prefer certain alignments for coalesced memory accesses; failing to do so can greatly reduce memory bandwidth. To avoid these pitfalls, we pad the unit-stride dimension (N X ← N X + pad).
1.5.3
Bandwidth Optimizations
For stencils with low arithmetic intensities, the 7-point stencil being an obvious example, memory bandwidth is a valuable resource that needs to be managed effectively. As a result, we introduce three bandwidth optimizations: software prefetching to hide memory latency and thereby increase effective memory bandwidth, circular queue to minimize conflict misses, and the cache bypass instruction to dramatically reduce overall memory traffic. The architectures used in this paper employ four principal mechanisms for hiding memory latency: hardware prefetching, software prefetching, DMA, and multithreading. The x86 architectures use hardware stream prefetchers that can recognize unit-stride and strided memory access patterns. When such a pattern is detected successive cache lines are prefetched without first being demand requested. Hardware prefetchers will not cross TLB boundaries (only 512 consecutive doubles), and can be easily halted by either spurious memory requests or discontinuities in the address stream. The former demands the hardware prefetcher be continually prodded to prefetch more. The latter may arise when CX < N X. That is, when core blocking results in stanza access patterns and jumps in the address stream. Although this is not an issue on multithreaded architectures, they may not be able to completely cover all cache and memory latency. In contrast, software prefetching, which is available on all cache-based processors, does not suffer from either limitation. However, it can only express a cache line’s worth of memory level parallelism. In addition, unlike a hardware prefetcher (where the prefetch distance is implemented in hardware), software prefetching must specify the appropriate distance to effectively hide memory latency. DMA is only implemented on Cell, but can easily express the stanza memory access patterns. DMA operations are de-
16
Scientific Computing with Multicore and Accelerators
coupled from execution and are implemented as double buffered reads of core block planes. The circular queue implementation, visualized in Figure 1.3(right), is a technique that allows efficient parallelization, eliminates conflict misses, and allows efficient expression of memory-level parallelism. This approach allocates a shadow copy of the planes of a core block in local memory or registers. The seven-point stencil requires three read planes to be allocated, which are then populated through loads or DMAs. However, it can often be beneficial to allocate an output plane and double buffer reads and writes as well (6 cache blocked planes). The advantage of the circular queue is the potential avoidance of lethal conflict misses. We currently explore this technique only on the local-store architectures but note that future work will extend this to the cache based architectures. So far we have discussed optimizations designed to hide memory latency to improve memory bandwidth, but we can extend this discussion to optimizations that minimize memory traffic. As described in Section 1.4.1 we may eliminate 33% of the memory traffic and thus increase arithmetic intensity by 50% by bypassing any write-allocate cache. If bandwidth bound, this can also increase performance by 50%. This benefit is clearly implicit on the cache-less Cell and GT200 architectures. However, this optimization is not supported on either Blue Gene/P or Victoria Falls.
1.5.4
In-core Optimizations
For stencils with higher arithmetic intensities, the 27-point stencil being a good example, computation can often become a bottleneck. To address this issue, we perform register blocking to effectively utilize a given platform’s registers and functional units. Although superficially simple, there are innumerable ways of optimizing the execution of a 7-point or 27-point stencil. After tuning for bandwidth and memory traffic, it often helps to explore the space of inner loop transformations to find the fastest possible code. To this end, we wrote a code generator that could generate any unrolled, jammed and reordered version of the stencil. Register blocking is, in essence, unroll and jam in X, Y , and Z. This creates small RX × RY × RZ blocks that sweep through each thread block. Larger register blocks have better surface-to-volume ratios and thus reduce the demands for L1 cache bandwidth whilst simultaneously expressing instructionand data-level parallelism. However, in doing so, they may significantly increase register pressure. Although the standard code generator produces portable C code, compilers often fail to effectively SIMDize the resultant code. As such, we created several instruction set architecture (ISA) specific variants that produce explicitly SIMDized code for x86, Blue Gene/P, and Cell using intrinsics. These versions will deliver much better in-core performance than a compiler. How-
Auto-tuning Stencil Computations on Multicore and Accelerators
z
z
z
x
(a)
z
y
y
y
y
x
(b)
17
x
(c)
x
(d)
FIGURE 1.4: Visualization of common subexpression elimination. (a) Reference 27-point stencil. (b)-(d) decomposition into 7 simpler stencils. As one loops through x, 2 of the stencils from both (b) and (c) will be reused for x + 1.
ever, as one might expect, this may have a limited benefit on memory-bound stencils like the 7-point.
1.5.5
Algorithmic Transformations
Our final optimization involves identifying and eliminating common expressions across several points. This type of common subexpression elimination can be considered to be an algorithmic transformation because of two reasonsthe flop count is being reduced, and the flops actually being performed may be performed in a different order than our original implementation. Due to the non-associativity of floating point operations, this may well produce results that are not bit-wise equivalent to those from the original implementation. For the 7-point stencil, there was very little opportunity to identify and eliminate common subexpressions. Hence, this optimization was not performed, and 8 flops are always performed for every point. The 27-point stencil, however, presents such an opportunity. Consider Figure 1.4. If one were to perform the reference 27-point stencil for successive points in x, we perform 30 flops per stencil. However, as we loop through x, we may dynamically create several temporaries (unweighted reductions) — Figure 1.4(b) and (c). For 27-point stencils at x and x + 1, there is substantial reuse of these temporaries. On FMA-based architectures, we may implement the 27-point stencil by creating these temporaries and performing a linear combination using 2 temporaries from Figure 1.4(b), two from Figure 1.4(c) and the stencil shown in Figure 1.4(c). This method requires about 15 instructions. On the x86 architectures, we create a second group of temporaries by weighting the first set. With enough loop unrollings in the inner loop, the CSE code has a lower bound of 18 flops/point. Disappointingly, neither the gcc nor icc compilers were able to apply this optimization automatically. However, on the GTX280, a combination of a 24-flop hand-coded CSE implementation and the nvcc compiler was able to produce a 17-flop implementation.
18
Scientific Computing with Multicore and Accelerators
Optimization parameter tuning range by architecture Parameter Name x86 BGP VF Cell GTX280 NUMA Aware X N/A X X N/A Data Pad (max): 32 32 32 15 15 Alloc Pad (multiple of): 1 1 1 16 16 CX NX NX {8...NX} {64...NX} {16...32} Core Block Size CY {4...NY} {4...NY} {4...NY} {8...NY} CX CZ {4...NZ} {4...NZ} {4...NZ} {128...NZ} 64 Domain Thread Block Size TX CX CX {8...CX} CX 1 Decomp TY CY CY {8...CY} CY CY/4
Category
Chunk Size RX Register Block Size RY RZ Low (SIMDized) Level Prefetch Distance DMA Size Cache Bypass Circular Queue Search Strategy Tuning Data-aware
N X×N Y ×N Z } {1... CX×CY ×CZ×N T hreads
N/A
{1...16}†
{1...8} {1...8} {1...8} TX {1...4} {1...4} {1...4} {1...8}† TY {1...4} {1...4} {1...4} 1 1 X X N/A X N/A {0...64} {0...64} {0...64} N/A N/A N/A N/A N/A CX×CY N/A X — N/A implicit implicit — — — X X Iterative Greedy Exhaustive Hand X X X X N/A
TABLE 1.3: Attempted optimizations and the associated parameter spaces explored by the auto-tuner for a 2563 stencil problem (N X, N Y, N Z = 256). All numbers are in terms of doubles. † On Cell, the 7-point stencil only used 2×8 register blocks.
1.6
Auto-Tuning Methodology
Thus far, we have described our applied optimizations in general terms. In order to take full advantage of the optimizations mentioned in Section 1.5, we developed an auto-tuning environment [7] similar to that exemplified by libraries like ATLAS [26] and OSKI [25]. To that end, we first wrote a Perl code generator that produces multithreaded C code variants encompassing our stencil optimizations. This approach allows us to evaluate a large optimization space while preserving performance portability across significantly varying architectural configurations. The parameter space for each optimization individually, shown in Table 1.3, is certainly tractable — but the parameter space generated by combining these optimizations results in a combinatorial explosion. Moreover, these optimizations are not independent of one another; they can often interact in subtle ways that vary from platform to platform. Hence, the second component of our auto-tuner is the search strategy used to find a high-performing parameter configuration. For this study, we afforded ourselves the luxury of spending many hours tuning a single node, since large scale stencil applica-
Auto-tuning Stencil Computations on Multicore and Accelerators
19
tions may be scaled to thousands of nodes and run many times. At this level of parallelism, it is vital to ensure that the software is as efficient as possible. To find the best configuration parameters, we employed an iterative “greedy” search on the cache-based machines. First, we fixed the order of optimizations. Generally, they were ordered by their level of complexity, but there was some expert knowledge employed as well. This ordering is shown in the legends of Figures 1.5 and 1.6; the relevant optimizations were applied in order from bottom to top. Within each individual optimization, we performed an exhaustive search to find the best performing parameter(s). These values were then fixed and used for all later optimizations. We consider this to be an iterative greedy search. If all applied optimizations were independent of one another, this search method would find the global performance maxima. However, due to subtle interactions between certain optimizations, this usually will not be the case. Nonetheless, we expect that it will find a good-performing set of parameters after doing a full sweep through all applicable optimizations. In order to judge the quality of the final configuration parameters, two metrics can be used. The more useful metric is the Roofline model, which provides an upper bound on kernel performance. If our fully tuned implementation approaches this bound, then further tuning will not be productive. The second metric is the performance improvement obtained from doing a second pass through our greedy iterative search. This is represented by the topmost color in the legends of Figures 1.5 and 1.6. If this second pass improves performance substantially, then our initial greedy search obviously was not effective. For the local-store architectures, two other search strategies were used. On the Cell, the size of the local store sufficiently restricted the search space so that an exhaustive search could be performed. For the GTX280 GPU, a CUDA code generator was not written; instead, since the code was only being deployed on a single architecture, it was hand-tuned (manual-search) by a knowledgeable programmer.
1.6.1
Architecture-Specific Exceptions
Due to limited potential benefit and architectural characteristics, not all architectures implement all optimizations or explore the same parameter spaces. Table 1.3 details the range of values for each optimization parameter by architecture. In this section, we explain the reasoning behind these exceptions to the full auto-tuning methodology. To make the auto-tuning search space tractable, we typically explored parameters in powers of two. The x86 architectures, Barcelona and Clovertown, rely on hardware stream prefetching as their primary means for hiding memory latency. The Nehalem architecture adds multithreading as another mechanism to tolerate memory latency and improve instruction scheduling. As previous work [17] has shown that short stanza lengths severely impair memory bandwidth, we prohibit core blocking in the unit stride (X) dimension, so CX = N X. Thus, we expect
20
Scientific Computing with Multicore and Accelerators
the hardware stream prefetchers to remain engaged and effective. Although we utilized both Nehalem threads for computation, we did not attempt to perform thread blocking on this architecture. Further, neither of the two other x86 architectures support multithreading. Thus, the thread blocking search space was restricted so that T X = CX, and T Y = CY . As x86 processors implement SSE2, we implemented a special SSE SIMD code generator for the x86 ISA that would produce both explicit SSE SIMD intrinsics for computation as well as the option of using a non-temporal store movntpd to bypass the cache. On these computers, the threading model was Pthreads. For the BG/P architecture, the optimization and parameter space restrictions are mostly the same as those for x86. Hardware stream prefetch is implemented on this processor, so again we prohibit blocking in the unit stride dimension. We also implemented a BG/P-specific SIMD code generator, but did not use any cache bypass feature. Although Victoria Falls is also a cache-coherent architecture, its multithreading approach to hiding memory latency is very different than out-oforder execution coupled with hardware prefetching. As such, we allow core blocking in the unit stride dimension. Moreover, we allow each core block to contain either 1 or 8 thread blocks. In essence, this allows us to conceptualize Victoria Falls as either a 128 core machine or a 16 core machine with 8 threads per core. In addition, there are no supported SIMD or cache bypass instrinsics, so only the portable pthreads C code was run. Unlike the previous four computers, Cell uses a cache-less local-store architecture. Moreover, instead of prefetching or multithreading, DMA is the architectural paradigm utilized to express memory level parallelism and hide memory latency. This has a secondary advantage in that it also eliminates superfluous memory traffic from the cache line fill on a write miss. The Cell code generator produces both C and SIMDized code. However, our use of SDK 2.1 resulted in poor double-precision code scheduling as the compiler was scheduling for a QS20 rather than a QS22. Unlike the cache-based architectures, we implement the dual circular queue approach on each SPE. Moreover, we double buffer both reads and writes. For optimal performance, DMA must be 128 byte (16 doubles) aligned. As such, we pad the unit stride (X) dimension of the problem so that N X + 2 is a multiple of 16. For expediency, we also restrict the minimum unit stride core blocking dimension (CX) to be 64. The threading model was IBM’s libspe. The GT200 has architectural similarities to both Victoria Falls (multithreading) and Cell (local-store based). However, it differs from all other architectures in that the device DRAM is disjoint from the host DRAM. Unlike the other architectures, the restrictions of the CUDA programming model constrained optimization to a very limited number of cases. First, we only explore only two core block sizes: 32×32 and 16×16. We depend on CUDA to implement the threading model and use thread blocking as part of the tuning strategy. The thread blocks for the two core block sizes are restricted to 1×8 and 1×4 respectively. Since the GT200 contains no automatically-
Auto-tuning Stencil Computations on Multicore and Accelerators
21
managed caches, we use the circular queue approach that was employed in the Cell stencil code. However, the register file is four times larger than the local memory, so we chose register blocks to be the size of thread blocks (RX = T X, RY = T Y, RZ = 1) and chose to keep some of the planes in the register file rather than shared memory.
1.7
Results and Analysis
To understand the performance of the 7-point and 27-point stencils detailed in Section 1.2, we apply one out-of-place stencil sweep at a time to a 2563 grid. The reference stencil code uses only two large flat 3D scalar arrays as data structures, and that is maintained through all subsequent tuning. We do increase the size of these arrays with an array padding optimization, but this does not introduce any new data structures nor change the array ordering. In addition, in order to get accurate measurements, we report the average of at least 5 timings for each data point, and there was typically little variation among these readings. Below we present and analyze the results from auto-tuning the two stencils on each of the seven architectures. Please note, in all figures, we present performance as GStencil/s (109 stencils per second), to allow a meaningful comparison between CSE and non-CSE kernels, and we order threads to first exploit all the threads on a core, then populate all cores within a socket, and finally use multiple sockets. We stack bars to represent the performance as the auto-tuning algorithm progresses through the greedy search i.e. subsequent optimizations are built on best configuration of the previous optimization.
1.7.1
Nehalem Performance
Figure 1.5 shows 7-point stencil performance, and we observe several interesting features. First, if we only examine the reference implementation, performance is fairly constant regardless of core count. This is discouraging news for programmers; the compiler, even with all optimization flags set, cannot take advantage of the extra resources provided by more cores. The first optimization we applied was using a NUMA-aware data allocation. By correctly mapping memory pages to the socket where the data will be processed, this optimization provides a speedup of 2.5× when using all 8 cores of the SMP. Subsequently, core blocking and cache bypass also produced performance improvements of 74% and 37%, respectively. Both of these optimizations attempt to reduce memory traffic (capacity misses), suggesting that performance was bandwidth-bound at high core counts. By looking at the Roofline model for the Nehalem (shown in Figure 1.2), we see that this is indeed the case. The model predicts that if the stencil calculation can achieve
Scientific Computing with Multicore and Accelerators 2.2
1.0
Xeon X5550 (Nehalem) 10
2.0 1.8
GStencils/s
5
1.2 1.0 0.8
3
0.6
0.7 0.6 0.4 0.3 0.2
0.2
0.1
0.0
0.0 1 2 4 8 Fully Threaded Cores
6
0.15 0.10 0.05
2 Cores
8
UltraSparc T2+ T5140 (Victoria Falls)
12 8 5
0.6
0.3
3
9
1
2 4 8 SPEs (cores)
2
16
5.5 5.0 4.5 4.0 3.5 3.0 2.5 2.0 1.5 1.0 0.5 0.0
0.10
2
Cores
4
8
12
2nd pass through greedy search
11
+Common Subexpression Elimination (another register and core blocking search)
10
+Cache Bypass (i.e. movntpd) +Explicit SIMDization (another register and core blocking search)
0.4
8
+Thread Blocking
7
+Explicit SW Prefetching
6
+Register Blocking
4 6
(portable C code)
1 2 4 8 16 Fully Threaded Cores
QS22 Blade (Cell Broadband Engine)
0.15
1
9
0.5
4
GStencils/s
GStencils/s
4
0.0 1
2.4 2.2 2.0 1.8 1.6 1.4 1.2 1.0 0.8 0.6 0.4 0.2 0.0
Cores
0.1
0.00
0.20
0.00 2
0.7
0.2
5
0.25
0.05
0.8
9
0.25
GStencils/s
GStencils/s
1.0 0.9
0.20
3
1
BlueGene/P
0.30
5
0.5
0.4
0.35
7
NVIDIA GTX280 (GPU) 8
5
+Core Blocking
4
+Array Padding
3
+NUMA-aware allocation
2
Reference Local Store Implementation
1
Reference (cache) Implementation
1 2 4 8 16 32 64 128 256 512 1024
GStencils/s
1.4
Xeon X5355 (Clovertown)10
0.30
10
0.8
1.6
0.35
Opteron 2356 (Barcelona)
0.9
GStencils/s
22
CUDA "Thread Blocks"
FIGURE 1.5: 7-point Stencil performance. In all of the graphs above, “GStencil/s” can be converted to “GFlop/s” by multiplying by 8 flops/stencil.
STREAM bandwidth, while minimizing non-compulsory cache misses, then the 7-point stencil will attain a maximum of 2.1 GStencil/s (16.8 GFlop/s). In actuality, we achieve 2.0 GStencil/s (15.8 GFlop/s). As this is acceptably good performance, we can stop tuning. Overall, auto-tuning produced a speedup of 4.5× at full concurrency and also showed an improvement of 4.5× when scaling from 1 to 8 cores. Observe that register blocking and software prefetching ostensibly had little performance benefit — a testament to icc and hardware prefetchers. Remember, the auto-tuning methodology explores a large number of optimizations in the hope that they may be useful on a given architecture–compiler combination. As it is difficult to predict this beforehand, it is still important to try each relevant optimization.
Auto-tuning Stencil Computations on Multicore and Accelerators
11
1.0
5
0.8
3
0.6
5
0.4
0.4
0.0
0.0 2
4
3
0.2 0.1
8
0.00 2
4
11 6
0.04
1
8
2
4
UltraSparc T2+ T5140 (Victoria Falls)
12
11
0.4
6 5
0.3
12
2nd pass through greedy search
11
+Common Subexpression Elimination (another register and core blocking search)
10 9
+Cache Bypass (i.e. movntpd) +Explicit SIMDization (another register and core blocking search)
0.2
8
+Thread Blocking
0.02
0.1
7
+Explicit SW Prefetching
0.00
0.0
6
+Register Blocking
1
2
4
1
Cores
2.8
11
1.8 1.4 1.2 1.0 0.8
6
4
8
16
(portable C code)
Fully Threaded Cores
5
+Core Blocking
NVIDIA GTX280 (GPU)
4
+Array Padding
3
+NUMA-aware allocation
2
Reference Local Store Implementation
1
Reference (cache) Implementation
2.4
9
1.6 GStencils/s
3.2
2
2.0
11
1.6 1.2 0.8
0.6 0.4
2
0.2
0.4 0.0
0.0 1
2
4
8
SPEs (cores)
16
1 2 4 8 16 32 64 128 256 512 1024
2.0
QS22 Blade (Cell Broadband Engine)
GStencils/s
2.2
8
Cores
0.5 GStencils/s
GStencils/s
0.6
0.06
0.15
Cores
12
0.08
0.20
0.05 1
BlueGene/P
0.10
0.25
0.10
Fully Threaded Cores 0.12
10
0.30
5
0.3
Xeon X5355 (Clovertown)
0.35
11
0.5
0.2
1
0.40
Opteron 2356 (Barcelona)
0.6 GStencils/s
GStencils/s
0.7
Xeon X5550 (Nehalem)
1.2
GStencils/s
1.4
23
CUDA "Thread Blocks"
FIGURE 1.6: 27-point Stencil performance. Before the Common Subexpression Elimination optimization is applied, “GStencil/s” can be converted to “GFlop/s” by multiplying by 30 flops/stencil. Note, explicitly SIMDized BG/P performance was slower than the scalar form both with and without CSE. As such, it is not shown.
The 27-point stencil performs 3.8× more flops per grid point than the 7point stencil (before application of CSE), so a very different set of bottlenecks may ultimately limit performance. We see in Figure 1.6 that the performance of the reference implementation improves by 3.3× when scaling from 1 to 4 cores, but then drops slightly when we use all 8 cores across both sockets. This performance quirk is eliminated when we apply the NUMA-aware optimization. There are several indicators that strongly suggest that it is compute-bound — core blocking shows less benefit than for the 7-point stencil, cache bypass
24
Scientific Computing with Multicore and Accelerators
does not show any benefit, performance scales linearly with the number of cores, and the CSE optimization is successful across all core counts. Again, this is correctly predicted by the Roofline model; however, due to the arithmetic intensity uncertainty factors mentioned in Section 1.4.3, the model is overly optimistic in predicting performance as 1.6 GStencil/s (49.1 GFlop/s) when 0.95 GStencil/s (28.5 GFlop/s) is actually achieved. Nonetheless, after tuning, we see a 3.6× speedup when using all 8 cores. Moreover, we also see parallel scaling of 8.1× when going from 1 to 8 cores — the ideal multicore scaling.
1.7.2
Barcelona Performance
In many ways, the performance of the 7-point stencil on Barcelona is very similar to that of Nehalem (no surprise given the very similar architecture). In Figure 1.5, we again see that the reference implementation shows no parallel scaling at all. However, the NUMA-aware version increased performance by 115% when both sockets are engaged. Like the 7-point stencil on Nehalem, the optimizations that made the biggest impact are cache bypass and core blocking. The cache bypass (streaming store) intrinsic provides an additional improvement of 55% when using all eight cores — indicative of its importance when the machine is memory bound. Unlike the 27-point stencil on Nehalem, the sub-linear scaling of Barcelona in Figure 1.6 seems to indicate that the kernel is constrained by memory bandwidth. However, the fact that cache bypass did not improve performance, while the CSE optimization improves performance by 18% at maximum concurrency, hints that it is close to being compute-bound. Overall, auto-tuning was able to produce a 4.1× speedup using all 8 cores. In addition, scaling from 1 to 8 cores now produces a speedup of 5.7×. The Roofline model for Barcelona, shown in Figure 1.2(b), again predicts that both the 7-point and 27-point stencils will be bandwidth-bound. For the 7-point stencil (shown in Figure 1.5), this is likely true, as the Roofline predicts 0.91 GStencil/s (7.3 GFlop/s), which reconciles well with the 0.86 GStencil/s (6.9 GFlop/s) we actually attained. The fact that the cache bypass instruction produced speedups commensurate with the reduction in memory traffic further corroborates this idea. Similar to the Nehalem predictions, the 27-point stencil (without CSE) predictions for Barcelona are looser than for the 7-point stencil. The Roofline model predicts an upper bound of about 0.98 GStencil/s (29.3 GFlop/s), but our attained performance, as seen in Figure 1.6, is 0.51 GStencil/s (15.4 GFlop/s). This suggests that as one approaches a compute-bound state, one should employ multiple Roofline models per architecture. On might infer that the 27-point stencil is likely compute-bound on Barcelona as cache bypass was not beneficial where CSE optimization was.
Auto-tuning Stencil Computations on Multicore and Accelerators
1.7.3
25
Clovertown Performance
Unlike the Nehalem and the Barcelona computers, the Clovertown is a Uniform Memory Access (UMA) machine with an older front side bus architecture. This implies that the NUMA-aware optimization will not be useful and that both stencil kernels will likely be bandwidth-constrained. If we look at Figure 1.5, both these predictions are true for the 7-point stencil. Only memory optimizations like core blocking and cache bypass seem to be of any use. After full tuning, we attain a performance of 0.32 GStencil/s (2.54 GFlop/s), which aligns well with the Roofline upper bound of 0.36 GStencil/s (2.9 GFlop/s) shown in Figure 1.2. Due to the severe bandwidth limitations on this machine, auto-tuning had diminished effectiveness; using all 8 cores, performance improves by only 1.9×. In addition, Clovertown’s single-core performance of 0.17 GStencil/s (1.37 GFlop/s) grows only by 1.9× when using all eight cores, resulting in aggregate node performance of only 0.32 GStencil/s (2.54 GFlop/s). Clovertown’s poor multicore scaling indicates that the system rapidly becomes memory-bound. Given the snoopy coherency protocol overhead, it is not too surprising that the performance only improves by 38% between the four-core and eight-core experiment (when both FSBs are engaged), despite the doubling of the peak aggregate FSB bandwidth. For the 27-point stencil, shown in Figure 1.6, memory bandwidth is again an issue at the higher core counts. When we run on 1 or 2 cores, cache bypass is not helpful, while the CSE optimization produces speedups of at least 30%, implying that the lower core counts are compute-bound. However, as we scale to 4 and 8 cores, we observe a transition to being memory-bound. The cache bypass instruction improves performance by at least 10%, while the effects of CSE are negligible. This behavior is well explained by the different streaming bandwidth ceilings on Clovertown’s Roofline model. The Roofline model also predicts a performance upper bound of approximately 0.39 GStencil/s (11.8 GFlop/s), while we actually attained 0.32 GStencil/s (9.7 GFlop/s) — hence, further tuning will have diminishing returns. All in all, full tuning for the 27-point stencil resulted in a 1.9× improvement using all 8 cores, as well as a 2.7× speedup when scaling from 1 to 8 cores.
1.7.4
Blue Gene/P Performance
Unlike the three previous architectures, the IBM Blue Gene/P implements the PowerPC ISA. In addition, the xlc compiler does not generate or support cache bypass at this time. As a result, the best arithmetic intensity we can achieve is 0.33 for the 7-point stencil and 1.25 for the 27-point stencil. The performance of a Blue Gene/P node is an interesting departure from the bandwidth-limited x86 architectures, as it seems to be compute-bound both for the 7-point and 27-point stencils. As seen in Figure 1.5 and 1.6, in neither case do memory optimizations like padding, core blocking, or software
26
Scientific Computing with Multicore and Accelerators
prefetching make any noticeable difference. The only optimizations that help performance are computation-related, like register blocking, SIMDization, and CSE. After full tuning, both stencil kernels show perfect multicore scaling. Interestingly, when we modified our stencil code generator to produce SIMD intrinsics we observed very different results on the 7- and 27-point stencils. We observe nearly a 30% increase in performance when using SIMD intrinsics on the 7-point, but a 10% decrease in performance on the 27-point CSE implementation using SIMD. One should note that unlike x86, Blue Gene does not support an unaligned SIMD load. As such, to load an unaligned stream of elements (and write to aligned), one must perform permutations and asymptotically require two instructions for every two elements. Clearly this is no better than a scalar implementation of one load per element. If we look at the Roofline model in Figure 1.2, we would conclude both stencils are likely compute-limited, although further optimization will quickly make the 7-point memory-limited. After full tuning of the 7-point stencil, we see an improvement of 4.4× at full concurrency. Similarly, for the 27-point stencil, performance improves by a factor of 2.9× at full concurrency.
1.7.5
Victoria Falls Performance
Like the Blue Gene/P, the Victoria Falls does not exploit cache bypass. Moreover, it is a highly multi-threaded architecture with low-associativity caches. Initially, if we look at the performance of our reference 7-point stencil implementation in Figure 1.5, we see that the we attain 0.16 GStencil/s (1.29 GFlop/s) at 4 cores, but only 0.09 GStencil/s (0.70 GFlop/s) using all 16 cores! Clearly the machine’s resources are not being utilized properly. Now, as we begin to optimize, we find that properly-tuned padding improves performance by 4.8× using 8 cores and 3.4× when employing all 16 cores. The padding optimization produces much larger speedups on Victoria Falls than for all previous architectures, primarily due to the low associativity of its caches.The highly multithreaded nature of the architecture results in each thread receiving only 64 KB of L2 cache. Consequently, core blocking also becomes vital, and, as expected, produces large gains across all core counts. A new optimization that we introduced specifically for Victoria Falls was thread blocking. In the original implementation of the stencil code, each core block is processed by only one thread. When the code is thread blocked, threads are clustered into groups of 8; these groups work collectively on one core block at a time. When thread blocked, we see a 3% performance improvement with 8 cores and a 12% improvement when using all 16 cores. However, the automated search to identify the best parameters was relatively lengthy, since the parameter space is larger than conventional threading optimizations. Finally, we also saw a small improvement when we performed a second pass through our greedy algorithm. For the higher core counts, this improved performance by about 0.025 GStencil/s (0.20 GFlop/s). Overall, the tuning
Auto-tuning Stencil Computations on Multicore and Accelerators
27
for the 7-point stencil resulted in a 8.7× speedup at maximum concurrency and a 8.6× parallel speedup as we scale to 16 cores. For the 27-point stencil, shown in Figure 1.6, the reference implementation scales well. Nonetheless, auto-tuning was still able to achieve significantly better results than the reference implementation alone. Many optimizations combined together to improve performance, including array padding, core blocking, common subexpression elimination, and a second sweep of the greedy algorithm. After full tuning, performance improved by 1.8× when using all 16 cores, and we also see parallel scaling of 13.1× when scaling to 16 cores. The fact that we almost achieve linear scaling strongly hints that it is computebound. This is confirmed by examining the Roofline model in Figure 1.2. The Victoria Falls performance results are even more impressive considering that one must regiment 128 threads to perform one operation; this is 8 times as many as the Nehalem, 16 times more than either the Barcelona or Clovertown, and 32 times more than the Blue Gene/P.
1.7.6
Cell Performance
The Cell blade is the first of two local store architectures discussed in this study. Recall that generic microprocessor-targeted source code cannot be na¨ıvely compiled and executed on the SPE’s software controlled memory hierarchy. Therefore, we use a local-store implementation as the baseline performance for our analysis. It should be noted this baseline implementation na¨ıvely blocks the code for the local store. Our Cell-optimized version utilizes an auto-tuned circular queue algorithm that searches for the optimal local store and register blockings. For both local store architectures, data movement to and from DRAM is explicitly controlled through DMAs, so write allocation is neither needed nor supported. Therefore, the ideal arithmetic intensity for the local store architectures is 0.50 for the 7-point stencil and 1.88 for the 27-point stencil. In practice, however, the Cell’s arithmetic intensity is significantly below this ideal due to extra padding for the DMA operations. Examining the behavior of the 7-point stencil on Cell (shown in Figure 1.5) reveals that the system is clearly computationally bound for the baseline stencil calculation when using 1 or 2 cores. In this region, there is a significant performance advantage in using hand optimized SIMD code. However, at concurrencies greater than 4 cores, there is essentially no advantage — the machine is clearly bandwidth-limited. The only useful optimization is NUMAaware data placement. Exhaustively searching for the optimal core blocking provided no appreciable speedup over the na¨ıve approach of maximizing local store utilization. Although the resultant performance of 15.6 GFlop/s is a low fraction of peak performance, it achieves about 90% of the streaming memory bandwidth, as evidenced in Roofline model in Figure 1.2. Unlike for the 7-point stencil, register blocking becomes useful for the 27point stencil (shown in Figure 1.6). As evidenced by the linear scaling across
28
Scientific Computing with Multicore and Accelerators
SPEs, this kernel is limited by computation until common subexpression elimination is applied. After CSE is applied, it is compute-bound from 1 to 4 cores, but likely bandwidth-bound when utilizing 8 cores on a single socket or all 16 cores across the SMP. Clearly, like the x86 version of gcc, the Cell version of gcc is incapable of SIMDization or CSE. Overall, full tuning allowed us to achieve a 4.8× speedup at full concurrency and an improvement of 9.9× when scaling from 1 to 16 SPEs. Although this Cell blade does not provide a significant performance advantage over the previous incarnation for memory intensive codes, it provides a tremendous productivity advantage by ensuring double-precision performance is never the bottleneck — one only need focus on DMA and blocking.
1.7.7
GTX280 Performance
The NVIDIA GT200 GPU (GeForce GTX280) is our other local store architecture. As an accelerator, the GTX280 links its address space to the disjoint CPU address space via the PCIExpress bus. However, for this study, we assume that the grids being operated on are already present in the local GPU memory, thus ignoring the data transfer time from CPU memory. In addition, our GTX280 27-point implementation only exploits a 24-flop CSE implementation. The compiler further reduced the flop count to approximately 17 per stencil, so this platform is performing slightly more than half of the 30 flops typically performed by the non-CSE kernel on other machines. For the 7-point and 27-point stencils, presented in Figures 1.5 and Figure 1.6, we manually select the appropriate decomposition and number of threads. Unfortunately, the problem decomposes into a power-of-two number of CUDA thread blocks which we must run on 30 streaming multiprocessors. Clearly, when the number of CUDA thread blocks is less than 30, there is a linear mapping without load imbalance. However, at 32 thread blocks the load imbalance is maximal (two cores are tasked with twice as many blocks as others). As concurrency increases beyond 32 thread blocks, load imbalance diminishes and performance saturates at 4.56 GStencil/s (36.5 GFlop/s). Our 27-point stencil implementation, shown in Figure 1.6, only exploits CSE. The performance profile still looks similar to the 7-point stencil, however — performance monotonically increases as we scale from 1 to 1024 CUDA thread blocks, and at maximum concurrency we peak at 2.64 GStencil/s (45.5 GFlop/s) — a compute-bound result.
1.7.8
Cross Platform Performance and Power Comparison
At ultra scale, power has become a severe impediment to increased performance. Thus, in this section not only do we normalize performance comparisons by looking at entire nodes rather than cores, we also normalize performance with power utilization. To that end, we use a power efficiency metric defined as the ratio of sustained performance to sustained system power —
Auto-tuning Stencil Computations on Multicore and Accelerators
1.5 1.0 0.5
Nehalem
GTX280
Cell Blade
Victoria Falls
BlueGene/P
Barcelona
Nehalem
Clovertown
0.0
GTX280
2.0
Cell Blade
2.5
auto-tuned reference auto-tuned CSE
BlueGene/P
3.0
27pt Performance
Victoria Falls
3.5
GStencils/s
GStencils/s
4.0
3.00 2.75 2.50 2.25 2.00 1.75 1.50 1.25 1.00 0.75 0.50 0.25 0.00
Clovertown
7pt Performance
4.5
Barcelona
5.0
29
FIGURE 1.7: A performance comparison for all architectures at maximum concurrency after full tuning. The left graph shows auto-tuned 7-point stencil performance, while the right graph displays performance for the auto-tuned 27-point stencil with and without common subexpression elimination. 8.0
7pt Power Efficiency
7.0
9.0
GStencils/s/kW
8.0 7.0 6.0 5.0 4.0 3.0 2.0
6.0
27pt Power Efficiency auto-tuned reference auto-tuned CSE
5.0 4.0 3.0 2.0 1.0
1.0
GTX280
Cell Blade
Victoria Falls
BlueGene/P
Clovertown
GTX280
Cell Blade
Victoria Falls
BlueGene/P
Clovertown
Barcelona
0.0 Nehalem
0.0
Barcelona
GStencils/s/kW
10.0
Nehalem
11.0
FIGURE 1.8: A power efficiency comparison for all architectures at maximum concurrency after full tuning. The left graph shows auto-tuned 7-point stencil power efficiency, while the right graph displays power efficiency for the auto-tuned 27-point stencil with and without common subexpression elimination. GStencil/s/kW. This is essentially the number of stencil operations one can perform per Joule of energy. Although manufactured by different companies, the evolution of x86 multicore chips from the Intel Clovertown, through the AMD Barcelona, and finally to the Intel Nehalem is an intriguing one. The Clovertown is a UMA architecture that uses an older front-side bus architecture and supports only a single hardware thread per core. In terms of DRAM, it employs FBDIMMs running
30
Scientific Computing with Multicore and Accelerators
at a relatively slow 667 MHz. Consequently, it is not surprising to see in Figure 1.7 that the Clovertown is the slowest x86 architecture for either stencil. In addition, due in part to the use of power-hungry FBDIMMs, it is also the least power efficient x86 platform (as evidenced in Figure 1.8). The AMD Barcelona has several significant upgrades over the Clovertown. It employs a modern multisocket architecture, meaning that it is NUMA with integrated on-chip memory controllers and an inter-chip network. It also uses standard DDR2 DIMMs (half the power, two thirds the bandwidth). These features allow for noticeably better effective memory bandwidth, resulting in a 2.7× speedup for the 7-point stencil over Clovertown. The 27-point stencil, which is less likely to be constrained by memory, still produces a 1.9× speedup over the Clovertown (with CSE). As previously mentioned, Intel’s new Nehalem improves on previous x86 architectures in several ways. Notably, Nehalem features an integrated on-chip memory controller, the QuickPath inter-chip network, and simultaneous multithreading (SMT). It also uses three channels of DDR3 DIMMs running at 1066 MHz. These enhancements are reflected in the bandwidth-intensive 7-point stencil performance, which is 6.2× better than Clovertown and 2.3× better than Barcelona. On the compute-intensive 27-point stencil (with CSE), we still see a 3.7× improvement over Clovertown and a 2.0× speedup over Barcelona. The IBM Blue Gene/P was designed for large-scale parallelism, and one consequence is that it is tailored for power efficiency rather than performance. This trend is starkly laid out in Figures 1.7 and 1.8. For both stencil kernels, the Blue Gene/P delivered the lowest performance per SMP among all architectures. Despite this, it attained the best power efficiency among the cachebased processors, and even bested Cell on the 7-point. It should be noted that Blue Gene/P is two process technology generations behind Nehalem. Victoria Falls’ chip multithreading (CMT) mandates one exploit 128-way parallelism. We see that Victoria Falls achieves performance close to that of Barcelona, but certainly better than either Clovertown or Blue Gene/P. However, in terms of power efficiency, it is second to last, besting only Clovertown — no surprise given they both use power-inefficient FBDIMMs. Finally, the STI Cell blade and NVIDIA’s GTX280 GPU are the two localstore architectures that we studied. They are different from the cache-based architectures in two important ways. First, they are both heterogeneous; the Cell has a PowerPC core as well as 8 SIMD SPE units per socket, while the GTX280 is an accelerator that links to a disjoint CPU. For this study, we did not exploit heterogenity. All the computation for the Cell was conducted on the SPEs, and all the computation on the GTX280 system was performed on the GPU. Second, they employ different programming models that render our portable C code useless; the Cell’s SPEs require DMA operations to move data between main memory and each SPE’s local store, while the GTX280 uses the CUDA programming language. Nonetheless, the potential productivity loss may be justified by the performance and power efficiency numbers attained using these two architectures. We see that Cell’s performance is at
Auto-tuning Stencil Computations on Multicore and Accelerators
31
least as good as any of the cache-based processors, while the GTX280’s performance is at least twice as good. Moreover, the power efficiency of both these architectures is significantly better than any of the cache-based architectures on the 27-point stencil. Nevertheless, it is important to note that neither the data transfer time between CPU and GPU, nor any impacts from Amdahl’s law [3] were included in our performance results.
1.8
Conclusions
In this work, we examined the application of auto-tuning to the 7- and 27-point stencils on the widest range of multicore architectures explored in the literature. The chip multiprocessors examined in our study lie at the extremes of a spectrum of design trade-offs that range from replication of existing core technology (multicore) to employing large numbers of simpler cores (manycore) and novel memory hierarchies (streaming and local-store). Results demonstrate that parallelism discovery is only a small part of the performance challenge. Of equal importance is selecting from various forms of hardware parallelism and enabling memory hierarchy optimizations, made more challenging by the separate address spaces, software-managed memory local stores, and NUMA features that appear in multicore systems today. Our work leverages the use of auto-tuners to enable portable, effective optimization across a broad variety of chip multiprocessor architectures, and successfully achieves the fastest multicore stencil performance to date. Analysis shows that every optimization was useful on at least one architecture (Figures 1.5 and 1.6), highlighting the importance of optimization within an auto-tuning framework. A key contribution to our study is the Roofline model, which effectively provides a visual assessment of potential performance and bottlenecks for each architectural design. Using this model allowed us to access the impact of our auto-tuning methodology, and determine that overall performance was generally close to its practical limit. Clearly, among the cache-based architectures, auto-tuning was essential in providing substantial speedups for both numerical kernels regardless of whether the computational balance ultimately became memory or compute-bound; on the other hand, the reference implementation often showed no (or even negative) scalability. Overall results show substantial benefit in raw performance and power efficiency for novel architectural designs, which use a larger number of simpler cores and employing software controlled memories (Cell and GTX280). However, the software control of local-store architectures results in a difficult trade-off, since it gains performance and power efficiency at a significant cost to programming productivity. Conversely the cache-based CPU architectures offer a well-understood and more productive programming paradigm. Results show that Nehalem delivered the best performance of any of the cache-based
32
Scientific Computing with Multicore and Accelerators
systems, achieving more than 2× improvement versus Barcelona, and more than a 6× speedup compared the previous generation Intel Clovertown — due, in-part, to the elimination of the front-side bus in favor of on-chip memory controllers. However, the low-power BG/P design offered one of the most attractive power efficiencies in our study, despite its poor single node performance; this highlights the importance of considering these design tradeoffs in an ultrascale, power intensive environment. Due to the complexity of reuse patterns endemic to stencil calculations coupled with relatively small perthread cache capacities, Victoria Falls was perhaps the most difficult machine to optimize — it needed virtually every optimization. Now that power has become the primary impediment to future processor performance improvements, the definition of architectural efficiency is migrating from a notion of “sustained performance” towards a notion of “sustained performance per watt.” Furthermore, the shift to multicore design reflects a more general trend in which software is increasingly responsible for performance as hardware becomes more diverse. As a result, architectural comparisons should combine performance, algorithmic variations, productivity (at least measured by code generation and optimization challenges), and power considerations. We believe that our work represents a template of the kind of architectural evaluations that are necessary to gain insight into the tradeoffs of current and future multicore designs.
1.9
Acknowledgments
The authors acknowledge Georgia Institute of Technology, its SonyToshiba-IBM Center of Competence, and the National Science Foundation for the use of Cell resources. We would like to express our gratitude to Sun and NVIDIA for their machine donations. We also thank the Argonne Leadership Computing Facility for use of their Blue Gene/P cluster. ANL is supported by the Office of Science of the U.S. Department of Energy under contract DEAC02-06CH11357. This work and its authors are supported by the Director, Office of Science, of the U.S. Department of Energy under contract number DE-AC02-05CH11231 and by NSF contract CNS-0325873. Finally, we express our gratitude to Microsoft, Intel, and U.C. Discovery for providing funding (under Awards #024263, #024894, and #DIG07-10227, respectively) and for the Nehalem computer used in this study.
Bibliography
[1] Software Optimization Guide for AMD Family 10h Processors, May 2007. [2] AMD64 Architecture Programmers Manual Volume 2: System Programming, September 2007. [3] Gene M. Amdahl. Validity of the single processor approach to achieving large scale computing capabilities. In AFIPS ’67 (Spring): Proceedings of the April 18-20, 1967, spring joint computer conference, pages 483–485, New York, NY, USA, 1967. ACM. [4] Kevin Barker, Kei Davis, Adolfy Hoisie, Darren Kerbyson, Michael Lang, Scott Pakin, and Jose Carlos Sancho. Entering the Petaflop Era: The Architecture and Performance of Roadrunner. In SC ’08: Proceedings of the 2008 ACM/IEEE conference on Supercomputing, Piscataway, NJ, USA, 2008. IEEE Press. [5] M. Berger and J. Oliger. Adaptive mesh refinement for hyperbolic partial differential equations. Journal of Computational Physics, 53:484–512, 1984. [6] Kaushik Datta. Auto-tuning Stencil Codes for Cache-Based Multicore Platforms. PhD thesis, EECS Department, University of California, Berkeley, Dec 2009. [7] Kaushik Datta, Mark Murphy, Vasily Volkov, Samuel Williams, Jonathan Carter, Leonid Oliker, David Patterson, John Shalf, and Katherine Yelick. Stencil Computation Optimization and Auto-Tuning on State-of-the-art Multicore Architectures. In SC ’08: Proceedings of the 2008 ACM/IEEE conference on Supercomputing, pages 1–12, Piscataway, NJ, USA, 2008. IEEE Press. [8] J. Doweck. Inside intel core microarchitecture. In HotChips 18, 2006. [9] B. Flachs, S. Asano, S.H. Dhong, et al. A streaming processor unit for a cell processor. ISSCC Dig. Tech. Papers, pages 134–135, February 2005. [10] M. Gschwind. Chip Multiprocessing and the Cell Broadband Engine. In CF’06: Proceedings of the 3rd conference on Computing frontiers, pages 1–8, New York, NY, USA, 2006. 33
34
Scientific Computing with Multicore and Accelerators
[11] M. Gschwind, H. P. Hofstee, B. K. Flachs, M. Hopkins, Y. Watanabe, and T. Yamazaki. Synergistic Processing in Cell’s Multicore Architecture. IEEE Micro, 26(2):10–24, 2006. [12] M. D. Hill and A. J. Smith. Evaluating Associativity in CPU Caches. IEEE Trans. Comput., 38(12):1612–1630, 1989. [13] Intel64 and IA-32 Architectures Optimization Reference Manual, May 2007. [14] Intel 64 and IA-32 Architectures Software Developer’s Manual, September 2008. [15] J. A. Kahle, M. N. Day, H. P. Hofstee, C. R. Johns, T. R. Maeurer, and D. Shi ppy. Introduction to the cell multiprocessor. IBM J. Res. Dev., 49(4/5):589–604, 2005. [16] S. Kamil, K. Datta, S. Williams, L. Oliker, John Shalf, and K. Yelick. Implicit and explicit optimizations for stencil computations. In ACM SIGPLAN Workshop Memory Systems Performance and Correctness, San Jose, CA, 2006. [17] S. Kamil, P. Husbands, L. Oliker, John Shalf, and K. Yelick. Impact of modern memory subsystems on cache optimizations for stencil computations. In 3rd Annual ACM SIGPLAN Workshop on Memory Systems Performance, Chicago,IL, 2005. [18] Edward D. Lazowska, John Zahorjan, G. Scott Graham, and Kenneth C. Sevcik. Quantitative System Performance: Computer System Analysis using Queueing Network Models. Prentice-Hall, Inc., Upper Saddle River, NJ, USA, 1984. [19] A. Lim, S. Liao, and M. Lam. Blocking and array contraction across arbitrarily nested loops using affine partitioning. In Proceedings of the ACM SIGPLAN Symposium on Principles and Practice of Parallel Programming, June 2001. [20] D. Pham, S. Asano, M. Bollier, et al. The design and implementation of a first-generation cell processor. ISSCC Dig. Tech. Papers, pages 184–185, February 2005. [21] S. Phillips. Victoria falls: Scaling highly-threaded processor cores. In HotChips 19, 2007. [22] G. Rivera and C. Tseng. Tiling optimizations for 3D scientific computations. In Proceedings of SC’00, Dallas, TX, November 2000. Supercomputing 2000.
Auto-tuning Stencil Computations on Multicore and Accelerators
35
[23] S. Sellappa and S. Chatterjee. Cache-efficient multigrid algorithms. International Journal of High Performance Computing Applications, 18(1):115–133, 2004. [24] The SPARC Architecture Manual Version 9, 1994. [25] R. Vuduc, J. Demmel, and K. Yelick. OSKI: A library of automatically tuned sparse matrix kernels. In Proc. of SciDAC 2005, J. of Physics: Conference Series. Institute of Physics Publishing, June 2005. [26] R. C. Whaley, A. Petitet, and J. Dongarra. Automated Empirical Optimization of Software and the ATLAS project. Parallel Computing, 27(12):3–35, 2001. [27] S. Williams. Auto-tuning Performance on Multicore Computers. PhD thesis, EECS Department, University of California, Berkeley, December 2008. [28] S. Williams, J. Carter, L. Oliker, J. Shalf, and K. Yelick. Lattice Boltzmann simulation optimization on leading multicore platforms. In Interational Conference on Parallel and Distributed Computing Systems (IPDPS), Miami, Florida, 2008. [29] S. Williams, D. Patterson, L. Oliker, J. Shalf, and K. Yelick. The roofline model: A pedagogical tool for auto-tuning kernels on multicore architectures. In IEEE HotChips Symposium on High-Performance Chips (HotChips 2008), August 2008. [30] S. Williams, A. Watterman, and D. Patterson. Roofline: An insightful visual performance model for floating-point programs and multicore architectures. Communications of the ACM, April 2009.