SCPSE: Security-Oriented Cyber-Physical State ... - PERFORM Group
Recommend Documents
a security-oriented cyber-physical state estimation (SCPSE) sys- tem, which, at each ..... and anomalies based on limited available information obtained from the ...
F30602-96-C-0315 and F30602-97-C-0276. ments of the application. The QuO framework provides an environment in which a programmer can specify contract.
William H. Sanders. â. â . Informatik IV, TU Dortmund ...... Douglas Maughan, Director of the Cyber Security Division in the Homeland Security Advanced ...
Malicious Data Detection in State Estimation Leveraging. System Losses & Estimation of Perturbed Parameters. William Niemira. Rakesh B. Bobba. Peter Sauer.
state-space generation is introduced below, after the formal definition of an attack step. A is the set of attack steps
The GUI serves as a central manage- ment console from which a user can define the attributes of each replica node (Figure 2) and the network topology.
1980s for performance, dependability, and performability evaluation. They have been used ..... One can immediately see the utility of a graphical representation.
tribute spam email, to extort money from businesses wish- ing to avoid .... servers, hosting the exploits and binaries used to infect new machines, and as SMTP ..... the growth of the botnet, security researchers have good motivation for devel-.
Mouna Seri and William H. Sanders. University of Illinois at Urbana-Champaign. Urbana, IL 61801, USA .... Addison-Wesley Longman, 2003. [7] F. B. Schneider.
single modeling formalism or solution method is best in all circumstances. ... modeling paradigms such as networks of queues and stochastic Petri nets (SPNs), ...
X-window based software tool for evaluating systems that are represented as ... considered for analytic solution, as well as the number of event types that are ...
Abstract. Stochastic activity networks have been used since the mid-. 1980s for performance, dependability, and performability evaluation. They have been used ...
I also want to acknowledge Bill Sanders for his patience and his willingness to ... I did not have a car, so I am grateful to Alex for the many rides to Meijer and.
for server/desktop computing with key architectural driving factors such as ...... and sensors, sensing and network efficiency, colocation/coex- istence with on-chip ...
a constant â â in dom( ) or a wild card â â. For a rule. , we use LHS( ) to denote ...... Studio 2005 and QT4 library. We run our algorithms on. Windows 7 ...
CNet O Q D C I. = .... user's smartphone has a special client to interact with the ..... Transactions Best Application Paper Prize in scheduling and logistics, and.
orous development and certification processes such as the. DO-178B [1]. ... untenable for several other industries including automotive, agriculture, and off-road ...
Objects (SOs) promotes an high-level architectural organization of the future IoT designed around ..... 467, pp. 111â128. Springer Berlin Heidelberg (2013). 17.
George Hurlburt, Change Index. Jeffrey Voas. Clouds offer a novel way to revitalize .... ing of applied graph mathe- matics across related networked phenomena.
Dept of EECS, Vanderbilt University, Nashville, TN 37235. Contact: [email protected]. Abstract: ... At one extreme are the âPer-vehicle CPSâ, which are ...
May 9, 2014 - crete manufacturing (e.g., automotive, aerospace, and durable goods). .... ment assess vulnerability of the ICS and test the security of the hardware .... d measures sp ecific to each energ y subsecto r availab le fo r b ase linin g.
tion functionality to the cloud could affect security and com- pliance [17]. We argue that we .... titioners may use a spreadsheet or a ticketing system to store the relevant .... We want to support a variety of operations that utilities can use on t
that a subdirectory of the file system and the subdirectory's contents form a volume. The servers that host a replica of a particular volume form a volume storage ...
to replica failures and transient overload on the server. To ad- dress this ... Our work targets a system in which the machines hosting replicated services ..... setup is composed of a set of uniprocessor Linux machines ..... Nearby Web Servers.
SCPSE: Security-Oriented Cyber-Physical State ... - PERFORM Group
of hosts in the cyber network and the maliciously modified set of measurements .... During the operational mode, SCPSE monitors the physical power and ...... (IP, HOST) MAPPINGS FROM FIGURE 4(B) TO FIGURE 6. Host. IP Address. Host.
IEEE TRANSACTIONS ON SMART GRID
1
SCPSE: Security-Oriented Cyber-Physical State Estimation for Power Grid Critical Infrastructures Saman Zonouz, Katherine M. Rogers, Robin Berthier, Rakesh B. Bobba, William H. Sanders, Thomas J. Overbye
Abstract—Preserving the availability and integrity of the power grid critical infrastructures in the face of fast-spreading intrusions requires advances in detection techniques specialized for such large-scale cyber-physical systems. In this paper, we present a security-oriented cyber-physical state estimation (SCPSE) system, which, at each time instant, identifies the compromised set of hosts in the cyber network and the maliciously modified set of measurements obtained from power system sensors. SCPSE fuses uncertain information from different types of distributed sensors, such as power system meters and cyber-side intrusion detectors, to detect the malicious activities within the cyber-physical system. We implemented a working prototype of SCPSE and evaluated it using the IEEE 24-bus benchmark system. The experimental results show that SCPSE significantly improves on the scalability of traditional intrusion detection techniques by using information from both cyber and power sensors. Furthermore, SCPSE was able to detect all the attacks against the control network in our experiments. Index Terms—Cyber-physical systems, maliciously corrupted data detection, security-state estimation, intrusion detection.
I. I NTRODUCTION The power grid is a large interconnected system whose reliable operation depends critically on its cyber infrastructure. A taxonomy of major cyber-physical interdependencies in the power grid is explored in [1]. For reliable operation of such a cyber-physical system, it is necessary to be aware of the state of both the physical and cyber infrastructures and their interdependencies. Today, the reliability of the interdependent power and cyber infrastructures making up the grid is largely managed through employment of redundant components and communication pathways that make it possible to operate through failures and faults that occur naturally. However, such an approach does not adequately protect against cyber adversaries. Until recently, perimeter security controls and lack of connectivity of power control networks to external networks were considered sufficient barriers against cyber adversaries. The increasing connectivity of power grid control networks to and through corporate and enterprise networks, and the advent of malware (e.g., Stuxnet) that can jump air gaps, call for more holistic solutions. This paper presents a securityoriented cyber-physical state estimation solution SCPSE that uses information from both power and cyber sensors to identify cyber attacks and potential compromises of power system measurement data for improved situational awareness. From a data perspective, power systems consist of data acquisition, transmission, and processing. The information path Saman Zonouz ([email protected]) is with the University of Miami. Katherine M. Rogers ([email protected]) is with PowerWorld Corporation. Robin Berthier, Rakesh B. Bobba, William H. Sanders, and Thomas J. Overbye {rgb, rbobba, whs, overbye}@illinois.edu, are with the University of Illinois at Urbana-Champaign.
from the field to end-point applications in the electric power grid is enabled by measurement devices and communication systems. The data integrity within the information path may be low for many reasons, including misconfigurations, sensor or communication failures, or coordinated false data injection attacks. Indeed, noisy data are constantly present in the system because of failures and misconfigurations, yet the system maintains a high level of reliability due to mechanisms put in place to detect and deal with such data. However, recent research [2] has shown that maliciously coordinated false data injection attacks may be able to bypass traditional mechanisms put in place to detect noisy data, and that such attacks may impact power system applications, such as optimal generation dispatch and real-time prices, as operators and applications respond to the manipulated system state estimate [3]–[5]. Arguably, false data injection attacks and their impacts need to be studied further and validated in realistic environments. However, it is important to design effective defenses against this threat. Further, anytime cyber intruders are in the system, even if they are not altering values to cause malicious consequences, the fact that they possess the access and the ability to make such modifications is a threat. The presence of such adversaries in the system needs to be resolved immediately. SCPSE has been designed for that purpose. Contribution: We propose SCPSE, a cyber-physical datafusion framework that uses stochastic information fusion algorithms and merges sensor information from both the cyber and electrical infrastructures that comprise the power grid to detect intrusions and malicious data, and to assess the cyber-physical system state. SCPSE exploits the interrelation among the cyber and physical components of the power grid by leveraging information about both the cyber and electrical infrastructures, and offers more complete situational awareness than is currently possible with existing solutions. Specifically, SCPSE utilizes information provided by alerts from intrusion detection systems (IDSes) that monitor the cyber infrastructure for malicious or abnormal activity, in conjunction with knowledge about the communication network topology and the output of a traditional state estimator (which leverages physical power system topology and power system measurements). Thus, SCPSE is able to provide meaningful feedback on the cyber-physical state of the system, leading to improved situational awareness and the ability to respond. While the focus of this work is on maliciously altered data, SCPSE is agnostic to the specific form of the attack. Section II describes SCPSE functionality and how it addresses the needs of the power industry. Details of the SCPSE cyber and power state estimation are presented in Sections III
and IV. The computational efficiency of SCPSE is discussed in Section V. A prototype implementation and its experimental results are presented in Section VI. Sections VII and VIII review past related work and conclude the paper. II. SCPSE A RCHITECTURE SCPSE data flow. Figure 1 presents a high-level overview of SCPSE and how its components are interconnected. Before SCPSE begins its online operation, it uses the power network’s access control policies, e.g., firewall rules, and automatically generates an attack graph, called an attack graph template (AGT). The state transitions in an AGT encode all possible attack paths that an attacker can traverse by sequences of vulnerability exploitations. Furthermore, SCPSE takes an underlying power system model and calculates a base-case power flow solution (Figure 1), which reveals how power system measurements should be correlated. During the operational mode, SCPSE monitors the physical power and communication networks, detects and analyzes attacks based on the attack graph, and then probabilistically determines the set of computer systems and power system measurements that are likely to have been maliciously compromised. SCPSE then uses that probabilistic information to flag and handle suspicious measurements in order to protect the power system from the potentially malicious data. In particular, SCPSE uses the past sequence of triggered IDS alerts to estimate the attack path in the AGT that has been traversed by the adversary. Because of inherent uncertainties in the reported IDS alert notifications, it is not always feasible to determine the exact attack path traversed. Instead, at each time instant, a posterior probability distribution over the AGT’s state space is calculated according to the false positive and negative rates of the triggered and non-triggered IDS alerts, respectively. That estimated probabilistic state knowledge reveals the set of privilege domains, i.e., host systems, believed to be compromised in the control network. Potentially modified power measurements are identified based on the given topological information regarding which power sensors are managed or processed by the estimated set of compromised hosts. The IDS reports and the correspondingly updated power system state estimator outputs enable SCPSE to provide situational awareness by continuously presenting operators with clear and complete information on the cyber-physical state of the power grid. The combined security state of the power grid is defined in this work as a binary vector that consists of information related to two types of malicious events. First, there are vulnerability exploitations, in which the adversary works to obtain specific privileges in the system. The first set of bits in a state indicates whether a particular privilege domain, e.g., the root domain on the historian server, has been compromised. Second, there are
malicious consequences of the attack after a privilege has been obtained. Specifically, we define consequences as violations of the CIA criteria (i.e., confidentiality, integrity, and availability) applied to critical assets in the power grid. For example, the integrity of a file relay.cfg, which is used to control a power relay, is compromised if the file is maliciously modified, leading to a status change of the underlying relay. The cyber-physical security state encodes the compromised host systems and the maliciously modified power measurements. By estimating the cyber-physical state and relaying it to operators, we are capable of responding to attacks. Network administrators should develop response strategies for security attacks that may occur. The strategies may include automated intrusion response systems. SCPSE neither proposes a new type of sensor nor presents an automated response mechanism. The main objective of SCPSE is to provide situational awareness of the power grid infrastructures to the operators and the response systems in charge of taking care of the detected problems. III. C YBER S ECURITY-S TATE E STIMATION As outlined in Section II, from the power network’s access control policies, SCPSE generates an AGT and uses it to estimate the compromised set of hosts, given the IDS alerts. The power network’s access control policies are composed of rules about sources (IP/port addresses) that are either allowed or not allowed to reach a destination. SCPSE parses the rulesets and creates a binary network connectivity matrix that is a Cartesian product of host systems. The [i, j] entry of the matrix takes on a true value if the traffic from host hi to host h j is allowed, and a false value if it is not allowed. The connectivity matrix always includes an Internet node representing a group of hosts outside of the network where attackers are assumed to initially reside. Attack graph template generation. Generally, every cyber attack path consists of an escalating series of vulnerability exploitations by the adversary, who initially has no access to the system (privilege) but then achieves the privilege required to reach his or her attack goals, e.g., modifying a power sensor measurement. Regardless of the type of the vulnerability, every vulnerability exploitation (e.g., a malicious buffer overflow against the human-machine interface (HMI) server in the power network) will provide the attacker with control on the corresponding host computer (e.g., the HMI server in the previous example). For instance, let us consider a host system H (e.g., an RTU) that is in charge of sending the sensor measurements on one of the power system buses to the state estimation server. To modify the sensor measurement data, the attacker needs to get control over H. For example, if the attacker has gotten control over the HMI server (from the above example), he or she further needs to exploit a
IEEE TRANSACTIONS ON SMART GRID
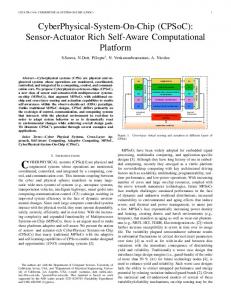
vulnerability in the system H so that he or she can modify the measurements. However, access from the HMI server to the system H should be allowed by the network firewall rules (socalled network global access control policies); otherwise, any attempt by the attacker on the HMI server to access the system H will be denied automatically by the firewalls. In particular, SCPSE takes into account the global access control policies that enumerate all possible attack paths that the attackers can traverse through the power grid network. We present the attack graph template (AGT), i.e., an extended attack graph, which represents all possible attack paths (unlike traditional attack graphs [6], which only address previously known paths). To further clarify, an AGT, by design, would address a zero-day (previously unknown) buffer overflow exploitation of a historian server process, while a traditional attack graph would be unaware of it. An AGT is a state-based directed graph, in which a state is defined as the set of compromised privilege domains. Therefore, the initial state is (∅), in which the attacker does not yet have any privileges over the power network. Each state transition represents a privilege escalation that is achieved through a vulnerability exploitation. Therefore, any path on the AGT graph represents an attack path in the power network. To generate an AGT, SCPSE pessimistically considers every host within the power network to be a single potentially vulnerable privilege domain. In particular, SCPSE automatically generates an AGT by traversing the connectivity matrix and concurrently updating the AGT. First, SCPSE creates the AGT’s initial state (∅) and starts the AGT generation with the network’s entry point (Internet) node in the connectivity matrix. Considering the connectivity matrix as a directed graph, SCPSE runs a depth-first search (DFS) on the graph. While the DFS is recursively traversing the graph, it keeps track of the current state in the AGT, i.e., the set of privileges already gained through the path traversed so far by the DFS. When the DFS meets a graph edge [i, j] that crosses over privilege domains hi to h j , a state transition in the AGT is created if the current state in the AGT does not include the privilege domain of the host to which the edge leads, i.e., h j . The transition in the AGT is between the current state and the state that includes exactly the same privilege set as the current state plus the host h j directed by the graph edge [i, j]. The AGT’s current state in the algorithm is then updated to the latter state, and the algorithm proceeds until no further updates to the AGT are possible according to the connectivity matrix. At that point, the offline AGT generation is complete, and by design, the AGT includes all possible attack paths launching from remote (Internet) host systems against the network. Figure 2 shows a highly simplified power network and its corresponding AGT model. Connectivity matrix elements are indicated with dashed arrows among network component pairs. AGT-to-HMM conversion. The AGT is converted to a hidden Markov model (HMM) [7], which will be used later to determine the attack path traversed by the attacker at each time instant, given the past set of triggered IDS alerts. To generate the HMM model, SCPSE enhances the AGT using the cyber network’s topology to encapsulate knowledge about deployed cyber-side IDSes. Specifically, each AGT edge
3
Ø Attack B
B: Data Historian
Attack A
A: Web server
B A Attack A Attack C
C: Relay Controller
Attack B A, B
B, C
Relay
Fig. 2.
Attack C A, B, C
A highly simplified power network and the corresponding AGT
is tagged by a (possibly empty) set of IDSes that monitor the edge’s corresponding network link within the power network. SCPSE later uses these tags to map IDS alerts (observations) to their corresponding state transitions to estimate the attack path traversed by the attacker. In practice, IDSes tend to report false positives and may also miss some incidents, i.e., false negatives. To account for the inherent uncertainties in IDS alert notifications, SCPSE labels the IDS tags on state transitions with their false positive and negative rates. Cyber security-state estimation. During its online operation, SCPSE makes use of the HMM model and online IDS alerts to probabilistically deduce the attacker’s previous actions (vulnerability exploitations), and hence the set of already compromised host systems. Indeed, IDS alerts provide SCPSE with the online information about the cyber-side security incidents and compromises. There are two major types of IDS solutions that can be used to pinpoint adversarial cyber penetrations: 1) host-based techniques that run and monitor for misbehaviors within host systems, such as file integrity checkers and CPU/memory overconsumption monitors; and 2) network-based solutions that run on network devices and hence are easier to deploy, and look for attack signatures and anomalies based on limited available information obtained from the packet headers and payloads, if the traffic is not encrypted. For SCPSE, the specific type of the IDS system is not relevant, and the only information needed is the intrusion detection accuracy level; that can be assigned by security admins or historical data analysis techniques [8]. SCPSE makes use of the HMM to track the attacker’s action sequence as the IDS alerts are sequentially triggered. To do so, SCPSE uses an HMM smoothing algorithm [7] to estimate the network’s current security state given the past triggered IDS alerts. In an HMM, unlike a regular Markov model, states are not directly visible, but observations (IDS alerts) are visible. The goal is to utilize the past observation sequence and probabilistically estimate the traversed state sequence (attack path) considering the false positive and negative rates of the monitoring IDS probes. Formally, SCPSE models each attack scenario as a discretetime hidden Markov process, i.e., event sequence Y = (y0 , y1 , · · · , yn−1 ) of arbitrary length. yi = (si , oi ), where si is
IEEE TRANSACTIONS ON SMART GRID
an HMM state at the ith step of the attack and is unobserved, and the observation oi is the set of triggered IDS alerts at that step. The initial state is defined as s0 = (∅), as discussed above. SCPSE’s main responsibility is to compute Pr(st | o0:t ), that is, the probability distribution over hidden states at each time instant, given the HMM model and the past IDS alerts o0:t = (o0 , · · · , ot ). In particular, SCPSE makes use of the forward-backward smoothing algorithm [7], which, in the first pass, calculates the probability of ending up in any particular HMM state given the first k IDS alerts in the sequence Pr(sk | o0:k ). In the second pass, the algorithm computes a set of backward probabilities that provide the probability of receiving the remaining observations given any starting point k, i.e., Pr(ok+1:t | sk ). The two probability distributions can then be combined to obtain the distribution over states at any specific point in time given the entire observation sequence, Pr(st | o0:t ) = Pr(sk | o1:k , ok+1:t ) ∝ Pr(ok+1:t | sk ) · Pr(sk | o1:k ) (1) where the last step follows from an application of Bayes’s rule and the conditional independence of ok+1:t and o1:k given sk . Having solved the HMM’s smoothing problem for Pr(st | o0:t ), SCPSE probabilistically knows about the current cyber security state, i.e., the set of compromised host systems. Next, our goal is to use the knowledge of current cyber security state to accurately estimate the underlying power system state. IV. P OWER S YSTEM S TATE E STIMATION As discussed before, the cyber-physical security state of the power grid is defined for SCPSE as the set of compromised host systems and maliciously modified power measurements. In Section III, we introduced an algorithm to probabilistically determine the set of compromised hosts at each time instant. This section explains how SCPSE uses the knowledge about compromised hosts to identify the set of maliciously modified power measurements, the so-called bad data. The bad-data detection enables SCPSE to estimate the underlying power system state correctly. Background. Before presenting the bad-data detection algorithm, we provide a brief review on the power system flow equations and state estimation. In a power grid infrastructure, the underlying power system is represented as a set of nonlinear AC equations that include active and reactive power flows, Pi j = V2i [−Gi j ] + Vi V j [Gi j cos(θi − θ j ) + Bi j sin(θi − θ j )] (2) Qi j = −V2i [−Bi j ] + Vi V j [Gi j sin(θi − θ j ) − Bi j cos(θi − θ j )] (3) where Pi j and Qi j are, respectively, active and reactive power flows from bus i to bus j. Gi j and Bi j denote the elements in the i, j position of the real and imaginary components of the system admittance matrix Ybus = G+ jB, which contains the network line parameters (I = Ybus V) [9]. The power system state estimation problem involves estimation of the present conditions in a power system based on snapshots of real-time measurements, i.e., real and reactive power. The estimated quantities include bus voltage magnitudes and angles that constitute the power system state variables. The
4
estimate is computed using known equations, which relate the power system measurements to the unknown states that are to be estimated. The estimates depend on the power flow equations that are derived from the power system topology. For example, in equations (2) and (3), the values of Pi j and Qi j are measured by the power sensors, and the values of the power system state vector (i.e., voltage magnitudes V and phase angles θ), are estimated using the iterative Newton-Raphson state estimation equations [9]. Once the state variables, i.e., bus voltage phasors, are known, all other quantities, such as currents and nonmeasured real and reactive line flows, can be computed [9]. In general, power system state estimation is typically an overdetermined problem, since there are more measurements available than are needed to solve for the unknown voltage magnitudes and angles. In other words, the power system state estimation server can still estimate the power state correctly if redundant measurements are ignored. However, in a practical attack-free situation, power measurements may include zeromean Gaussian noise due to natural and accidental faults. Therefore, deployment of redundant power sensors improves the accuracy of power system state estimation. In certain cases, it is possible for modified measurements to cause incorrect power system estimates without being detected. These unobservable attacks must satisfy the power balance equations. Bad-Data Detection. Many proposed schemes exist for bad-measurement identification [10]. In [2], [11], [12], and [13], it is shown that traditional detection schemes are ineffective against coordinated malicious false data injection. Residual-based approaches [9] are the most widely used techniques for handling nonmalicious accidental failures. In summary, those algorithms examine the L2 -norm of the measurement residual ||z − Hˆx||, i.e., the difference between the true measurements z and the estimated values of the measurements Hˆx, which are calculated using the power system state estimate xˆ and the system matrix H. The measurements whose L2 -norm is greater than a certain threshold τ are marked as bad data. However, unobservable false-data injection attacks [11] prove the inability of residual-based techniques to handle interacting or malicious bad-data modifications [14], as they can change the estimates without impacting the residual. The failure of such techniques results from their dependence on computation of an initial estimate xˆ using all the measurements, which may be affected by the bad data. To identify malicious data modifications, we present a new scalable and combinatorial-based bad-data detection (BDD) algorithm. The algorithm makes use of the power measurements as well as the cyber security state estimation result, i.e., the posterior distribution over the HMM’s state space Pr(st | o0:t ) (Section III). The main idea is to circumvent the problem of needing to compute the initial power system estimate xˆ from the full data set by initially throwing out the set of suspicious measurements. A trivial solution would be to blindly consider each combination of the sensors to be corrupted, then estimate the power system state for each combination without using measurements from those sensors, and finally calculate ||z − Hˆx|| to identify the true corrupted
IEEE TRANSACTIONS ON SMART GRID
measurements. However, that approach is not generally scalable for use in large-scale power systems, as M sensors yield 2M possible combinations. As discussed below, SCPSE uses the posterior distribution Pr(st | o0:t ) to order and limit the number of combinations to check. Algorithm 1: Power system BDD algorithm 1 2 3 4 5 6 7 8 9 10 11 12 13 14 15 16
Input: P(st | o0:t ), z, deadline Output: [pwr state, bad data] cybr state, pwr state, bad data; εm ← 0; List ← OrderP(st |o0:t ) (S); while get time() ≤ deadline do s ← List.pop(); c ← measurement combination(s); [zc , Hc ] ← Updatec (z, H); if Observable(zc , Hc ) then xˆ ← Newton Raphson(zc , Hc ); ε ← ||z − Hˆx||; if εm < ε then [pwr state, bad data] ← [ˆx, c]; ε ← εm ; end end end
SCPSE implements Algorithm 1 to detect maliciously bad power measurements. The main inputs (Line 1) are the cyber security state estimation result Pr(st | o0:t ), the power system measurements, and a timeout threshold for the algorithm. SCPSE initially orders the HMM states in descending order according to the estimated posterior probability P(st | o0:t ) (Line 3). Then, SCPSE iteratively checks combinations of measurements (Line 4). In particular, the most likely HMM state s is first picked from the list (Line 5). Using the power grid topology, SCPSE knows which measurements could or might have been corrupted, given the set of compromised hosts encoded by s. The set of potentially corrupted measurements is stored in a binary vector c (Line 6). To clarify, assuming that there are a total of m measurements, cm×1 is a binary vector in which 1s and 0s represent bad and good measurements, respectively. For instance, none of the measurements are marked as potentially corrupted in the measurement combination c = (0, 0, . . . , 0)T . The idea is to throw away the measurements that correspond to the 1 values in c, and proceed with the normal state estimation routine using the remaining measurements. Given the calculated c, rows of the z and H matrices that correspond to the 1 values in c are deleted, and the results are saved in zc and Hc (Line 7). Using the dimensionally reduced matrices zc and Hc , the power system state is then estimated (Line 9). The state estimate xˆ is used to reconstruct the estimated measurement vector zˆ = Hˆx, which is compared to the actual measurements z (Line 10). During each iteration of the algorithm, the most deviating zˆ so far and the related values are stored (Line 12). In essence, each iteration (Line 4) checks a specific set of potentially bad measurements to determine whether or not they differ significantly from the values they should have, which are computed based on the remaining (good) measurements. Finally, the procedure returns the best estimates for the power system state, and the set of measurements that were identified as corrupted (Line 1).
5
One main point in the algorithm is the observability condition (Line 8), which checks whether it is possible to estimate the power system state while ignoring a particular subset of measurements c. Otherwise, if too many measurements are compromised and must be removed, the system will no longer be observable, and the algorithm will not be able to proceed with that particular iteration (Line 8). In general, for a power system to be observable, it is necessary for the number of available measurements to be equal to or larger than the number of power system state variables. However, it may be that only parts of the network are observable and some other parts of the system are not observable, even if the total number of good measurements is sufficient. Hence, it is not only important that there be enough good measurements, but also that they come from well-distributed parts of the underlying power system. The entire power system is said to be observable if all state variables can be estimated based on the given measurements. Further discussion of observability analysis is beyond the scope of this paper. The interested reader is referred to the literature concerning measurement placement for observability [10]. It is worth stressing that Algorithm 1 provides bad-data detection mainly for malicious cases and is a supplement to, rather than a replacement for, residual-based approaches, which are suitable for detecting noninteracting and natural errors. The proposed algorithm is, in essence, a combinatorialbased solution that makes use of cyber-side IDS reports to improve its scalability. In the case of natural errors, IDS reports would not provide any useful information, and hence the proposed algorithm could not always identify corrupted measurements within a short amount of time. Consequently, the proposed approach and traditional residual-based techniques should be used together to achieve efficient detection of measurement corruptions due to both security attacks and accidental errors. V. C OMPUTATIONAL E FFICIENCY Power systems are large, sparse systems in which each bus is connected to at most a few other buses. Thus, power systems analysis takes advantage of sparsity in its computations of network solutions [15], [16]. Likewise, the same sparsity that permits the efficient solution of large-scale power networks also permits efficient solution of the possible communications attack paths. SCPSE takes advantage of the network’s topological sparsity and uses an approximation algorithm (discussed below) to ensure feasibility of the proposed estimation algorithms on large-scale power networks. SCPSE employs a modified version of the envelope [17] algorithm to concentrate computational resources on only the most relevant states. In particular, at each time instant t, given the HMM smoothing results Pr(st | o0:t ), SCPSE picks the state with the highest probability s∗ using the Most Likely State (MLS) [18] approximation technique s∗ = arg maxs Pr(st | o0:t ). Then, SCPSE partially generates the AGT, starting with the state s∗ and exploring all possible state sequences shorter than a predefined threshold α that are reachable from s∗ . The generated partial AGT is used by SCPSE to perform the next round of HMM smoothing
IEEE TRANSACTIONS ON SMART GRID
Power System Topology
6
Access Policies (Firewall Rules)
Control Network Topology
PowerWorld
NetAPT IDS Alerts AGT Generator and HMM Convertor
Power Measurements Power State Estimator (MATPOWER)
Algorithm 1
HMM Solver (UMDHMM)
Cyber-Physical Security-State Estimate Fig. 3.
SCPSE implementation setup
to update the Pr(st+1 | o0:t+1 ) distribution. Once the power system bad-data detection using Pr(st+1 | o0:t+1 ) has been accomplished, SCPSE starts the next iteration by updating the AGT using the updated distribution and waiting to receive the next sequence of observables. VI. E VALUATION Evaluation methodology. We implemented and evaluated a working prototype of SCPSE on the IEEE 24-bus power system benchmark. Our experimental results show that the generated attack graph and the underlying physical power system allow SCPSE to efficiently fuse sensor information and hence identify malicious activities accurately. In this section, we discuss our implementations and present the experimental results. All our experiments were on a 32bit system with an Intel Core 2 2.16 GHz CPU, 3.00 GB of memory, and the Windows 7 Professional operating system. Implementations. Figure 3 shows a high-level overview of our implementation setup. A unified XML format was used to describe the network topology and global access control policies. During the offline phase, SCPSE leverages the NetAPT tool [19] to connect to firewalls in the network using a secure SSL channel and perform a comprehensive security analysis of the access policy rules. It then produces the network connectivity matrix according to the control network topology input. The matrix is later translated into an HMM model through an AGT generation step (Section III). As illustrated in Figure 3, during the online phase, SCPSE feeds the previously triggered IDS alerts to an HMM solver (the UMDHMM tool [20]) to solve the HMM model for the posterior distribution and estimate the cyber security state of the system. On the power side, we employed PowerWorld Simulator [21] to simulate the underlying power system model, shown as the power system topology input in Figure 3. PowerWorld was used to produce online power measurements and to send them in real-time to the power state estimation component (the MATPOWER MATLAB toolbox [22]). To set up a realtime connection to MATLAB, PowerWorld used its SimAuto toolbox [23] via MATLAB. Finally, the power system state estimate from MATPOWER and the cyber security state estimate from UMDHMM were used by Algorithm 1 to determine the cyber-physical security state of the power grid. In our experiments, we evaluated SCPSE on a simulated power grid infrastructure. The underlying power system was the IEEE 24-bus reliability test system [24] (Figure 4(a)). The
power system consisted of 38 transmission lines, and each line had two power sensors on each of its ends, measuring real and reactive power. The power system was monitored and controlled by two control center networks with identical network topologies and access control policies. The simplified control network models were built based on the topology of a real power control network (which will remain anonymous because of a nondisclosure agreement). Figure 4(b) shows the topology of a single control center network that has 59 nodes, e.g., host systems and firewalls. As shown in the figure, the Internet connections come from the node marked as Internet Host (28.1.1.1), which is assumed to be where the attacker resides initially. The first control network monitors and controls buses 1 − 12 in the power system (Figure 4(a)), and the second network monitors and controls buses 13 − 24. In particular, each power bus is monitored and controlled by a single host system in the corresponding control network. That mapping is later used by the implementation of the proposed baddata algorithm to determine which measurements the attacker could have modified, given that he or she has compromised a particular host system. Performance Analysis. We evaluated SCPSE’s scalability for large-scale power grid networks with thousands of buses. Although network topology analysis and AGT model generation in SCPSE are performed during an offline phase, in practice, it is still important to complete those steps within a reasonable time interval. To validate SCPSE’s efficiency on various power grid networks with different sizes and topologies, we measured how long SCPSE takes to generate the AGT model for randomly generated power grid networks. Figures 5(a) and 5(b) show the AGT generation time requirement and the model’s size for power grid networks of various sizes. In particular, the sizes, shown on the horizontal axes, represent the number of power system buses and communication control network systems, as we used a one-to-one mapping between the communication network nodes and the power system buses. The threshold α (Section V) was set to 8, i.e., the generated AGT model took into account all possible adversarial future action sequences whose lengths were shorter than 9. As shown in the figures, the AGT model size and generation time grew as the network size reached around 1000 nodes, and remained stationary (|S| ∼ = 3500 and Generation time ∼ = 1200 ms) afterwards. We also evaluated the performance of the HMM solution component in SCPSE. As shown in Figure 5(c), initially, before the α finite horizon threshold was hit, the HMM solution time increased as the network size grew; however, it reached its steady state of about 2 seconds for larger networks. Figure 5(d) shows our performance analysis results for Algorithm 1. In particular, we measured how long it takes SCPSE to complete the baddata detection phase when different numbers of AGT states are chosen to be investigated (Line 5 in the algorithm). It takes about 8 seconds to initialize the algorithm, e.g., load the power grid case, and approximately 0.08 seconds on average for each state chosen from the list. AGT generation. Given the power network topology and the access policy rules, i.e., about 100 firewall rules, SCPSE constructed the network connectivity matrix and generated
4 7 10 13 16 19 #AGT States Chosen from the Ordered State Space
(d) BDD solution overhead
SCPSE’s performance analysis results
the corresponding AGT model. Figure 6 shows a simplified version of the generated AGT. For presentation clarity, only a single host in each network was considered during the AGT generation, and host names in Figure 6 are represented by hx encodings. Table I shows the mappings between the encodings in Figure 6 and the host systems in Figure 4(b). As shown in the generated AGT, the attacker initially resides remotely in the Internet, with no privileges in the power network (AGT state 0), and could traverse different attack paths to access a particular host, e.g., h8 , in the power network. Each AGT edge represents an allowed access (i.e., possibly a vulnerability exploitation) from a source to a destination host in the power network. Cyber security-state estimation. Our implementations then converted the generated AGT to its corresponding hidden Markov model (Section III) to allow probabilistic deduction of the attack path that would reveal the set of compromised
hosts. The generated HMM maintained the same state space and namings as the AGT illustrated in Figure 6. Then, we launched an attack to compromise the host system 101.10.0.3 within the power network. The attack caused the IDS, which was monitoring the host’s incoming traffic, to trigger an alert. The UMDHMM tool used the generated HMM and the triggered IDS alert to estimate the cyber security state. Table II shows the probability distribution over the HMM’s state space. The most likely current state in the HMM marks the host systems 28.1.1.1 and 101.10.0.3 as compromised. From the cyber-physical network’s topology input and given the compromised hosts, SCPSE marks the real and reactive power measurements on transmission lines 1 − 2 and 16 − 17 as potentially corrupted1 . Bad-data detection. We evaluated how efficiently the proposed bad-data detection algorithm performs compared to the traditional residual-based approaches. The first attack modified the measurements from a single real power sensor on the 1 − 2 line after compromising a critical power network host. Figure 7 shows different parameters observed after we ran both of the bad-data detection algorithms. The vertical axis shows the real power per-unit values for 16 of the 38 total power system sensors (indicated on the horizontal axis). For presentation clarity, not all 38 values are shown. For each of the 16 sensors, four values are reported. The first column shows the actual (correct) measurements from PowerWorld Simulator; maliciously modified values are shown in the second column. The third column shows the measurements estimated using the proposed framework, which used the cyber-side intrusion detection (ID) information. The last column reports the measurements estimated using the traditional residual-based approach. As shown in the figure, during the first scenario, only the measurement from the first sensor on the 1 − 2 line was corrupted 1 p.u. before being sent 1 “1 − 2”
denotes the power system line that connects bus 1 to bus 2.
IEEE TRANSACTIONS ON SMART GRID
Automatically generated AGT for the IEEE 24-bus power control networks TABLE I (IP, HOST ) M APPINGS FROM F IGURE 4( B ) TO F IGURE 6 Host IP Address Host IP Address h1 28.1.1.1 h2 101.10.0.3 h3 120.2.1.65 h4 172.16.101.122 h5 172.16.104.20 h6 172.16.201.45 h7 172.90.200.251 h8 101.11.0.3
TABLE II C YBER S ECURITY-S TATE E STIMATION R ESULTS Probability HMM’s State ID Compromised Hosts 0.032141 0 28.1.1.1 0.953099 1 28.1.1.1, 101.10.0.3 0.001001 15 28.1.1.1, 101.10.0.3, 101.11.0.3 0.016759 36 28.1.1.1, 101.11.0.3
to the estimation server. The proposed ID-based solution’s estimation of the first sensor’s measurement, 0.1224, was almost equal to its correct value, 0.1247 (i.e., with only 0.002 p.u. difference), and hence far from its modified value, resulting in a large measurement residual. The residual-based algorithm was also able to detect the data corruption, as its calculated measurement residual value, 0.502, was above the predefined threshold (τ = 0.1 p.u.). However, its estimated value was not as accurate as that of the ID-based algorithm. The estimated value was affected by the corrupted value that was wrongly considered good and used by the state estimator during the residual-based approach’s first power state estimation. The second attack aimed to cause noninteracting measurement modifications on two power sensors. In particular, measurements from the bus 1 sensor on the 1 − 2 line, and from the bus 16 sensor on the 16 − 17 line, were corrupted. The corruptions were both 1 p.u., and were intentionally designed not to match the underlying power system equations. In practice, such noninteracting bad data usually result from non-malicious natural and accidental failures. Figure 8 shows the measurement estimations resulting from the two algorithms. Much as in the case above, the proposed algorithm and the residual-based approach were both able to detect the data corruption. However, the residual-based approach did not estimate the power system measurements of the compromised sensors accurately. During a more complicated attack scenario, the attacker intentionally modified two measurements from sensors 1 (on bus 1) and 14 (on bus 2), which were monitoring the two ends of the 1 − 2 power line. The data modifications were intentionally designed in such a way that they still satisfied the power flow equations (i.e., an unobservable attack). In particular, the measurement corruptions on sensors 1 and
2.5% 2%
Real%
1.5% Real%Power%(p.u.)%
Fig. 6.
8
Corrupted%
Est.%SCPSE%
Est.%Residual%
1% 0.5% 0%
!0.5% !1%
!1.5% !2% !2.5%
Fig. 7.
1%
2%
3%
4%
5%
6%
7%
8%
9% 10% 11% 12% 13% 14% 15% 16%
Power%Sensors%
Single measurement (sensor 1) corruption
14 were +1 and −1 p.u., respectively. Figure 9 shows the results for the interacting measurement corruption scenario. The proposed ID-based algorithm was still able to detect the measurement corruption and correctly estimate the state by ignoring the set of bad measurements. In comparison, the locally consistent bad measurements deceived the residualbased approach into wrongly marking those measurements as correct, since the measurement residual value was 0.002, i.e., below the predefined threshold τ. That example shows that SCPSE is effective at detecting interacting malicious measurement corruption attacks and producing an accurate estimate of the system state, while residual-based approaches fail to detect such attacks and thereby can lead to a faulty estimate. We also evaluated SCPSE’s ability to detect maliciously altered power system measurements in our case study power grid in 30 different cyber-originated attack scenarios. SCPSE’s HMM smoothing component took 914 milliseconds on average to calculate the posterior distribution for each attack over the state space. SCPSE’s detection component was able to identify the exact subset of corrupted measurements in all the scenarios within 11.7 seconds by going through no more than the first 14 states (across the attack scenarios) on the ordered state list (Algorithm 1). That demonstrates that SCPSE has the potential to assess the cyber-physical state of a system in real-time and in the presence of adversaries. VII. R ELATED W ORK Recently, there has been increasing interest in security incident detection in power-critical infrastructures [25], including work on false data injection attacks [2] and defenses against them. However, most of the past work has focused on either cyber or power side solutions [26]–[28]. In this section, we
Multiple interacting measurement (sensors 1 and 14) corruption
discuss some closely related work and contrast it with our approach. We first discuss related work whose focus is on the dependability and security analysis of power systems. Volkanovski et al. [29] introduce a power system reliability analysis algorithm using fault trees generated for each load point of the system. The proposed method focuses only on accidental failures due to natural causes, and hence does not consider maliciously failed power components. Zhou et al. [30] present a sequential power system state estimation algorithm that uses reports from synchronized phasor measurement units. Lo et al. [31] propose a power system bad-data detection algorithm based on rotation of measurement order for sequential state estimation. [32], [33] focus on detecting corrupted measurements using only power sensors. Such bad-data detection techniques have two major limitations. Detection accuracy of some approaches, e.g., leastsquare error-based algorithms [33], is usually low against coordinated attacks, as they initially consider all the measurements good. Furthermore, some other approaches, e.g., combinational techniques [32], do not scale well. Their search space for detecting bad measurements grows exponentially with the number of measurements. Recent research has focused on false data injection attacks [2], [28], [34] on state estimation, where an adversary modifies multiple measurements in a coordinated fashion to influence the estimate of the state without being detected by traditional bad-data detection schemes, and on defenses against such attacks (e.g., [28], [34], [35]). The impact of such false data injections on power system operations, including power market operations, has been considered in [3]–[5]. Specifically, [3], [4] show that false data injection attacks can be used to manipulate real-time prices in the electricity markets, while [5] shows that they can cause operators to make suboptimal power dispatch decisions. Kosut et al. [28] introduce an algorithm to detect and
localize false data injection attacks using the generalized likelihood ratio test. However, that work does not take into account the cyber network topology or its current state, which might be the root cause of the problem; hence, it does not provide a complete cyber-physical picture. Bobba et al. [34] and Dan et al. [35] demonstrate how knowledge of power system topology and the correlation, present in power system measurement data can be leveraged to provide effective, cost-efficient solutions for detecting malicious false data injection, and also to provide insight into the nature of unobservable attacks. Giani et al. [36] provide further characterization of unobservable attacks. However, unlike SCPSE, those efforts only leverage power system measurements except for [35] which leverages communication infrastructure topology information as well. We now discuss related work that is focused on the security of cyber infrastructure. Cyber-based diagnostics mechanisms try to estimate the security state of a computer network [37]. Bothunter [38] extends ideas from multi-sensor data fusion to probabilistically correlate triggered alerts generated by intrusion detection systems (IDSes). The main goal is to identify the set of compromised hosts [39]; however, in a power grid context, the goal is the overall safety and reliability of the grid and not security of individual hosts. Such solutions, as they do not take the impact on the physical system into account, are thus unable to provide a complete picture. Ten et al. [40] propose a vulnerability assessment technique to evaluate the vulnerabilities of SCADA systems at three levels: system, scenarios, and access points. By calculating the risk of each asset’s compromise, Mohajerani et al. [41] introduce a method to detect and improve the vulnerability of power networks against the intrusions and malicious acts of cyber hackers. [40] and [41] both perform in an offline manner, and hence cannot monitor the system for malicious activities while it is in its operational mode. Wilken et al. [42] propose a software fault diagnosis solution that uses data redundancy to detect faults that have been caused by probabilistic system failures [43]. Therefore, software crashes that result from vulnerability exploitations cannot be completely detected using their proposed approach. For cyber systems, there have been extensive investigations into intrusion detection techniques such as anomalybased [44], signature-based [45], and (recently) specificationbased solutions [46]. However, those traditional cyber diagnostics solutions ignore the topology and configuration of the underlying physical power system [47]. In contrast, our framework leverages the topology and configuration of the underlying physical power system to validate the outcomes of traditional IDSes. For process control networks, Cardenas et al. [48] investigate an intrusion detection technique in which the attack’s final target is assumed to be given. That assumption could be exploited by attackers to further damage the process control network by targeting other critical goals. SCPSE, while generating the attack graph, considers all possible attack paths, even those that do not end up in critical assets, e.g., an internal Web server. In summary, unlike previous techniques, SCPSE leverages information from the cyber network (control network topology,
IEEE TRANSACTIONS ON SMART GRID
access policies, and sensory reports) along with information from the power system (network model and measurements) to detect false data and provide an improved estimate of the cyber-physical state. VIII. C ONCLUSIONS In this paper, we introduced SCPSE, a cyber-physical security state estimation framework that can identify malicious activities and accurately estimate the cyber-physical security state of a power grid. SCPSE exploits available offline information, like power network access policies, to create a comprehensive model of the cyber-physical system. During operational mode, SCPSE makes use of the available online information from both the cyber security sensors and the power measurements and efficiently fuses that information using the generated system model. The experimental results show that SCPSE can efficiently estimate the cyber security state of a system, identify malicious measurement corruptions, and, consequently, calculate a correct state estimate of the underlying system. ACKNOWLEDGMENT This material is based upon work supported by the Department of Energy under Award Number DE-OE0000097. Additionally, we would like to thank Sankalp Singh and Jenny Applequist for their invaluable technical comments and constructive revisions, respectively. R EFERENCES [1] S. Sridhar, A. Hahn, and M. Govindarasu, “Cyber-physical system security for the electric power grid,” Proceedings of the IEEE, vol. 100, no. 1, pp. 210–224, 2012. [2] Y. Liu, P. Ning, and M. K. Reiter, “False data injection attacks against state estimation in electric power grids,” ACM Trans. Inf. Syst. Secur., vol. 14, pp. 13:1–13:33, 2011. [3] L. Xie, Y. Mo, and B. Sinopoli, “Integrity data attacks in power market operations,” IEEE Trans. Smart Grid, vol. 2, no. 4, pp. 659–666, 2011. [4] L. Jia, R. J. Thomas, and L. Tong, “Impacts of malicious data on realtime price of electricity market operations,” in HICSS. IEEE Computer Society, 2012, pp. 1907–1914. [5] A. Teixeira, henrik Sandberg, G. Dan, and K.-H. Johansson, “Optimal power flow: Closing the loop over corrupted data,” in Proc. of American Control Conference, 2012. [6] B. Schneier, “Attack trees,” Dr. Dobb’s Journal, 1999. [7] L. Rabiner, “A tutorial on hidden Markov models and selected applications in speech recognition,” Proceedings of the IEEE, vol. 77, no. 2, pp. 257–286, 1989. [8] S. Terry and B. J. Chow, “An assessment of the DARPA IDS evaluation dataset using Snort,” Tech. Rep., 2005. [9] A. Monticelli, State Estimation in Electric Power Systems: A Generalized Approach. Kluwer Academic Publishers, 1999. [10] A. Wood and B. Wollenberg, Power Generation, Operation, and Control, 2nd ed. John Wiley and Sons, 1996. [11] Y. Liu, P. Ning, and M. K. Reiter, “False data injection attacks against state estimation in electric power grids,” in Conference on Computer and Communications Security. ACM, 2009, pp. 21–32. [12] L. Xie, Y. Mo, and B. Sinopoli, “False data injection attacks in electricity markets,” in IEEE International Conference on Smart Grid Communications, 2010, pp. 226–231. [13] A. Teixeira, S. Amin, H. Sandberg, K. Johansson, and S. Sastry, “Cyber security analysis of state estimators in electric power systems,” in IEEE Conference on Decision and Control, 2010, pp. 5991–5998. [14] A. Monticelli, F. F. Wu, and M. Yen, “Multiple bad data identification for state estimation by combinatorial optimization,” IEEE Power Engineering Review, vol. PER-6, no. 7, pp. 73–74, 1986. [15] W. Tinney and J. Walker, “Direct solutions of sparse network equations by optimally ordered triangular factorization,” Proceedings of the IEEE, vol. 55, no. 11, pp. 1801–1809, 1967. [16] W. Tinney, V. Brandwajn, and S. Chan, “Sparse vector methods,” IEEE Transactions on Power Apparatus and Systems, vol. PAS-104, no. 2, pp. 295–301, Feb. 1985. [17] T. Dean, L. Kaelbling, J. Kirman, and A. Nicholson, “Planning under time constraints in stochastic domains,” Artificial Intelligence, vol. 76, pp. 35–74, 1995. [18] A. Cassandra, “Exact and approximate algorithms for partially observable Markov decision processes,” Ph.D. dissertation, Brown University, 1998.
10
[19] D. M. Nicol, W. H. Sanders, S. Singh, and M. Seri, “Usable global network access policy for process control systems,” IEEE Security and Privacy, vol. 6, pp. 30–36, 2008. [20] UMDHMM Tool, available at: http://www.kanungo.com/software/ software.html. [21] J. Glover, M. Sarma, and T. Overbye, Power System Analysis and Design. Thomson, 2008. [22] R. Zimmerman, C. Murillo-Sanchez, and R. Thomas, “MATPOWER: Steady-state operations, planning, and analysis tools for power systems research and education,” IEEE Transactions on Power Systems, vol. 26, no. 1, pp. 12–19, 2011. [23] PowerWorld Corporation, “SimAuto Overview,” [Online]. Available: http://www.powerworld.com. [24] Reliability Subcommittee, “IEEE reliability test system,” IEEE Transactions on Power Apparatus and Systems, vol. PAS-98, no. 6, pp. 2047– 2054, 1979. [25] F. C. Schweppe and J. Wildes, “Power system static-state estimation, part i: Exact model,” IEEE Transactions on Power Apparatus and Systems, vol. PAS-89, no. 1, pp. 120–125, 1970. [26] S. A. Zonouz, H. Khurana, W. H. Sanders, and T. M. Yardley, “‘RRE: A game-theoretic intrusion response and recovery engine,” in IEEE/IFIP International Conference on Dependable Systems and Networks, 2009, pp. 439–448. [27] S. Zonouz and W. Sanders, “A Kalman-based coordination for hierarchical state estimation: Algorithm and analysis,” in Hawaii International Conference on System Sciences, 2008, p. 187. [28] O. Kosut, L. Jia, R. J. Thomas, and L. Tong, “Malicious data attacks on smart grid state estimation: Attack strategies and countermeasures,” in IEEE International Conference on Smart Grid Communications, 2010, pp. 220–225. [29] A. Volkanovski, M. Cepin, and B. Mavko, “Application of the fault tree analysis for assessment of power system reliability,” Reliability Engineering and System Safety, vol. 94, no. 6, pp. 1116–1127, 2009. [30] M. Zhou, V. Centeno, J. Thorp, and A. Phadke, “An alternative for including phasor measurements in state estimators,” IEEE Transactions on Power Systems, vol. 21, no. 4, pp. 1930–1937, 2006. [31] K. Lo, P. Zeng, E. Marchand, and A. Pinkerton, “New bad-data detection and identification technique based on rotation of measurement order for sequential state estimation,” IEE Proceedings C on Generation, Transmission and Distribution, vol. 139, no. 5, pp. 387–401, 1992. [32] A. Monticelli, F. F. Wu, and M. Yen, “Multiple bad data identification for state estimation by combinatorial optimization,” IEEE Pow. Eng. Rev., vol. PER-6, no. 7, pp. 73–74, 1986. [33] W. Peterson and A. Girgis, “Multiple bad data detection in power system state estimation using linear programming,” in Southeastern Symposium on System Theory, 1988, pp. 405–409. [34] R. B. Bobba, K. M. Rogers, Q. Wang, H. Khurana, K. Nahrstedt, and T. J. Overbye, “Detecting false data injection attacks on DC state estimation,” in Workshop on Secure Control Systems, Apr 2010. [35] G. Dan and H. Sandberg, “Stealth attacks and protection schemes for state estimators in power systems,” in Proc. of IEEE SmartGridComm, 2010. [36] A. Giani, E. Bitar, M. Garcia, M. McQueen, P. Khargonekar, and K. Poolla, “Smart grid data integrity attacks: characterizations and countermeasures;,” in IEEE International Conference on Smart Grid Communications, 2011, pp. 232 –237. [37] S. A. Zonouz, K. R. Joshi, and W. H. Sanders, “Cost-aware systemwide intrusion defense via online forensics and on-demand detector deployment,” in ACM Workshop on Assurable and Usable Security Configuration, 2010, pp. 71–74. [38] G. Gu, P. Porras, V. Yegneswaran, M. Fong, and W. Lee, “Bothunter: Detecting malware infection through IDS-driven dialog correlation,” in USENIX Security Symposium. USENIX Association, 2007. [39] A. Valdes and K. Skinner, “Probabilistic alert correlation,” in International Symposium on Recent Advances in Intrusion Detection, 2001, pp. 54–68. [40] C.-W. Ten, C.-C. Liu, and G. Manimaran, “Vulnerability assessment of cybersecurity for SCADA systems,” IEEE Transactions on Power Systems, vol. 23, no. 4, pp. 1836–1846, 2008. [41] Z. Mohajerani, F. Farzan, M. Jafary, Y. Lu, D. Wei, N. Kalenchits, B. Boyer, M. Muller, and P. Skare, “Cyber-related risk assessment and critical asset identification within the power grid,” in IEEE PES on Transmission and Distribution Conference and Exposition, 2010, pp. 1–4. [42] K. D. Wilken and T. Kong, “Concurrent detection of software and hardware data-access faults,” IEEE Transactions on Computers, vol. 46, pp. 412–424, 1997. [43] A. Avizienis, J.-C. Laprie, and B. Randell, “Dependability and its threats: A taxonomy,” in IFIP Congress Topical Sessions, 2004, pp. 91–120. [44] A. Patcha and J.-M. Park, “An overview of anomaly detection techniques: Existing solutions and latest technological trends,” Computer Networks, vol. 51, pp. 3448–3470, 2007. [45] H.-K. Pao, C.-H. Mao, H.-M. Lee, C.-D. Chen, and C. Faloutsos, “An intrinsic graphical signature based on alert correlation analysis for intrusion detection,” in International Conference on Technologies and Applications of Artificial Intelligence, 2010, pp. 102–109. [46] S. Niksefat, M. M. Ahaniha, B. Sadeghiyan, and M. Shajari, “Toward specification-based intrusion detection for web applications,” in International Conference on Recent Advances in Intrusion Detection, 2010, pp. 510–511. [47] C. V. Zhou, C. Leckie, and S. Karunasekera, “A survey of coordinated attacks and collaborative intrusion detection,” Computer Security, vol. 29, no. 1, pp. 124–140, 2010. [48] A. A. C´ardenas, S. Amin, Z.-S. Lin, Y.-L. Huang, C.-Y. Huang, and S. Sastry, “Attacks against process control systems: Risk assessment, detection, and response,” in ACM Symposium on Information, Computer and Communications Security, 2011, pp. 355–366.