International Journal of Industrial Engineering, 16(4), 364-369 2009.
SCRAP REDUCTION BY USING TOTAL QUALITY MANAGEMENT TOOLS Sanjay Kumar1, Dr. S.S. Mantha2 and Dr. Arun Kumar3 1
Senior Lecturer, Production Engg. Dept., M.H. Saboo Siddik College of Engineering, Byculla, Mumbai-400008. INDIA E-mail:
[email protected] 2
Prof. & Head, Mechanical Engg., VJTI, Matunga, Mumbai 3
Head, Production Engg. Dept., M.H. Saboo Siddik College of Engineering A case study was carried out in one of the leading Indian industries manufacturing pre-stressed concrete steel strands (PC wire). It has major applications in bridges and construction industry. During study, lot of scrap was observed. Reasons for scrap was found out by using total quality management tools (TQM). Such as brainstorming, cause & effect diagram and pareto analysis. Main reasons were left over rings, non-conformity, chheda and weld/wire breakage. In the present study, scraps due to left over rings were reduced gradually by taking suitable action.
SIGNIFICANCE This paper highlights the reduction in scrap by using TQM tools. Which can be used in any industry. Reduction in scrap means directly saving in cost and increase in productivity index.
KEY WORDS: LRPC, Cause & Effect diagram, Pareto analysis, left over rings. (Received 1 February 2007; Accepted in revised form 29 October 2009)
1. INTRODUCTION Pre-stressed concrete steel strands (PC wire) are produced in LRPC (Low relaxation pre stressed concrete wire) department. P.C. wire is used to neutralize tensile stress. When a rectangular concrete member is subjected to a vertical load, the upper half experiences compressive stress while lower half experiences tensile stress. Depending upon the magnitude of pre stressing, the tensile stress can be reduced to a greater extent or may even be eliminated by using P.C. wire. With the development of PC technology and its successful applications in the field of concrete construction, gradually it became necessary to use pre stressed tendons capable of developing and retaining large concrete pre-stressing forces. So, the strands were usually subjected to stress relieving so that cold working stresses (that were induced during drawing process) were removed. Stress relieving is done without any change in the microstructure. Process generates lot of scrap. To overcome this problem different TQM tools used to identify the reasons. Main reasons of scrap were found in the form of left over rings and non confirmatory rejection. Left over rings are those rings that are left on the bobbins after machine has been emptied out. Non confirmatory rejection includes rejection due to under size, over size, scratches and damage marks.
2. LITERATURE To reduce scrap in LRPC department exhaustive study was carried out. First it was decided to go for brainstorming session. It is a tool for generating as many ideas or solutions on ground rules i.e. no idea is a bad idea. This helps in generating ideas of a group. This does not determine the best solution to a problem. Brainstorming session provides the platform for person to person interaction, so entire team is involved. It is also not a platform for debate for criticize the ideas of other people. It only helps in building of ideas that leads to fantastic ideas. Once ideas are generated then it is displayed by using cause and effect diagram. It is also called Ishikawa diagram (after its creator, Kaoru IshiKawa of Japan) or fishbone diagram (due to its shape). To provide a pictorial display of a list, in which one can identify and organize possible causes of problems or factors needed to ensure success of some effort. It is an ISSN 1943-670X
! INTERNATIONAL JOURNAL OF INDUSTRIAL ENGINEERING
Scrap Reduction Using TQM effective tool that allows people to easily see the relationship between factors to study processes, situations and for planning. From this diagram, the user can define the most likely causes of a result. The diagram was adopted by Dr. W. Edwards Deming as a helpful tool in improving quality. Dr. Deming had taught TQM in Japan since world war I & II. Both Ishikawa and Deming use this diagram as one of the tools in the quality management process. Cause and effect helps in identifying the reasons, why a process goes out of control. Finally, pareto chart helps to display the relative importance of problems or conditions in the form of bar graph. It shows the distribution of items and arranges them from the most frequent to the least frequent. The tool is named after Wilfredo Pareto, the Italian economist, who determined that wealth is not evenly distributed. He studied the distribution of wealth in different countries and concluded that a fairly consistent minority about 20% of people controlled the large majority about 8% of a society’s wealth. This tool is a graphical picture of the most frequent causes of a particular problem. It shows where to put initial effort to get the maximum gain. It is a problem solving/statistical tool that ranks problem areas or sources of variation, according to their contribution to cost or to total variation. It is defined by J.M. Juran as the idea that 80%of all effects are produced by only 20% of the possible causes.
3. METHODOLOGY LRPC (Low relaxation pre stressed concrete wire) department is concerned with the production of the normally relaxed strand wires. Strand wire is produced by having input of six outer wire and one core wire in skip strander unit of the L.R. machine. The pre stressed strand loses a part of its applied stress over a passage of time due to phenomenon of creep. This loss of stress is called relaxation. To reduce the scrap brainstorming was done. Benefit of brainstorming is the power of the group in building ideas of each other’s ideas. Then cause and effect diagrams are used to assemble thoughts from the sessions. This tool is used during identification and implementation stages. Causes are broken down into the main categories of man, machine, material and method. Each major cause is further subdivided into minor causes. Once the diagram is completed it is used to evaluate the most likely causes. Cause & effect diagram is used to explain all potential or real causes (input) that result in a simple effect (output). The potential causes are reviewed and the major causes contributing to the problem were listed in the order of their relative importance. After plotting the diagram, major causes were analysed and root causes were found out using the validation theory. Finally, pareto analysis had been done to identify the most critical problems.
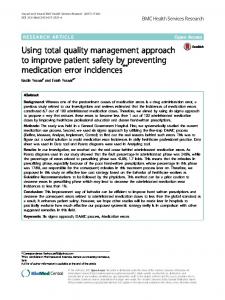
4. ANALYSIS After brainstorming session, causes and effects are represented in terms of lines and symbols in Ishikawa diagram (cause & effect diagram).
Figure 1. Cause and effect diagram
365
Kumar et al. Once fish bone diagram (cause & effect) was drawn, the major causes were analyzed and the root causes were found out using the validation theory. The following causes were listed as valid. Table 1. Validation theory Category
Man
Reason
Technique used
Carelessness
Observation
X
Less Experience
Data Collection
X
Absenteism
Observation
X
Unskilled
Machine
X
Furnace Temperature
Data Collection
Leftover rings
Data Collection
!
Weld/Wire Break
Data Collection
!
Raw Material defect
Data Collection Data Collection
(N-C-rejection)
X
X
!
Data Collection
Transverse Cracks
Method
Invalid
Observation & Test
Non confirmatory rejection Materials
Valid
X
& Observation
Top Paint
Data Collection
!
Short Bobbins
Data Collection
!
Chedda
Data Collection
!
Loading and Welding
Data Collection
!
Table 2. Data of scrap Wire/Weld
Chedda
Left Over Rings
June
.761
8.348
2.714
6.99
July
1.02
7.525
2.527
8.01
August
.815
5.697
2520
2.35
September
.819
7.36
3.09
8.81
October
.845
6.126
3.65
5.97
November
.75
7.22
2.396
8.22
Average
.85
7.21
2.82
6.73
366
break
N.C.Rejection
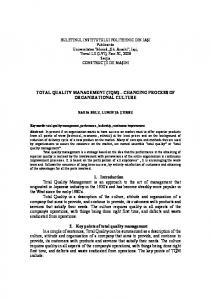
Scrap Reduction Using TQM Data was collected for a period of six months for the year 2004-05. Those data for various causes were analyzed and presented which gave rise to maximum scrap. All values are given in Tons. By using pareto analysis, those data are presented in graphical form in the descending order. Since graph has advantage of providing a visual impact showing those vital characteristics that need attention. Resources are then developed to take the necessary corrective actions. Thus the pareto diagram is a powerful quality improvement tool. It showed that scrap due to left over rings is the maximum.
20 18 16
14 12
TON S
10 8
6
4 2
0 Leftoevr rings
N.C.Rejectio n
REASON S
Weld/Wire Breakage
Chedd a
Figure 2. Pareto analysis showing reasons of scrap Seven bobbins were loaded on the stabilizing line at a time to form a seven ply strand. All the seven bobbins have to be filled to the same length. If the bobbins do not have the same length of wire filled, then many rings are left over resulting in scrap. Once the reason is identified, meter is replaced by a proximity sensor. This sensor is used to sense the rotation of the output shaft of the gear box. The count is fixed as per the program that is running on the machine. In case the bobbin has to be removed from the spool in between the length, just has to be reset and it will start counting the new length. The proximity senses the number of rotations of the drum and displays it on the electronic panel board. The length meter is calibrated depending upon the diameter of the drum.
5. RESULTS After taking corrective action from, December 2004 to March 2005, percentage left over rings per ton shows the remarkable reduction in scrap. Data are presented in tabular form.
6. CONCLUSIONS AND DISCUSSION For an organization, which strives to be extremely efficient in its endeavor to satisfy its production requirement, the consequence of having highly efficient time could not be understated. Performance of an organization is determined by the capability of its processes. High quality processes deliver high quality products, at the lowest possible cost and on time. By making certain minor changes in the existing process it can yield great benefits in terms of money.
367
Kumar et al. Table 3. Percentage reduction of scrap
Drawn Prod.
Month
(Tonnes)
Left Over
% Left Over Rings
Rings (Tonnes) Per Ton Production
Apr-04
1833
6.18
0.34
May-04
1819
6.711
0.37
Jun-04
1674
8.348
0.50
Jul-04
1722
7.525
0.44
Aug-04
1493
5.697
0.38
Sep-04
1710
7.36
0.43
Oct-04
1673
6.126
0.37
Nov-04
1773
7.22
0.41
Dec-04
2065
6.902
0.33
Jan-05
2279
9.149
0.40
Feb-05
1761
5.26
0.30
Mar-05
1920
5.09
0.27
21722
82
1810.17
6.85
TOTAL AVG./PM
0.37
Thus the quantity of left over rings has decreased significantly.
% Left Over Rings per Ton Production
0.6 0.5
% Pink sleeve/Ton Production
0.4 0.3 0.2
Figure 3. Decrease in percentage for left over rings
368
March-05
Fec-05
Jan-05
Dec -04
Mont h
Nov – 04
Sep -04
Aug – 04
July - 04
June -04
May 04
April -04
0.0
Oct – 04
0.1
Scrap Reduction Using TQM Specifically, the process of finding out loopholes of the process and reducing the scrap generated in the process and thereby improving the productivity index and performance of the process is very sophisticated task. Without techniques like cause & effect diagram, pareto analysis and actions taken towards the attainment of the final goal, any initiative would be a failure. Scrap reduction by reducing leftover rings brings forth importance of accurate measurement in any industry. This is true for all industries, be it finish process or intermediate one. Reduction in scrap means directly saving in cost. LRPC strand cost is very high. It costs Rs 30,000 per ton. Therefore annual saving will be too high. Scrap can be further reduced by looking other areas where scrap is generated. These areas include non confirmatory rejection, weld / wire breakage, chheda etc.
7. REFERENCES 1. 2. 3. 4. 5.
Chase, Aquilano, Jacobs (1999), “Production and operations Management”. Tata McGraw-Hill Publishing Company Ltd., New Delhi (India). Crosby, Phlip B. “Quality without Tears”, New York: Mc Graw Hill Book company, 1984. Dale H. Bester Field et. al , “ Total Quality Management ,” Second Edition, Person Education Asia , 2001. Deming, W. Edwards, “Quality Productivity and Competitive Position”, Cambridge, M.A. MIT, 1982. Juran , Joseph M., “ Quality Control Hand Book”, 4th edition, New York McGraw Hill Company, 1980 BIOGRAPHICAL SKETCH
Sanjay Kumar did B.Tech (Production Engineering) from Bihar Institute of Technology, Sindri, Jharkhand (India) and M.Tech (Industrial Engineering and Management) from Indian School of Mines, Dhanbad (India). Completed Ph.D. from, Mumbai University under the guidance of Dr. S.S. Mantha (now Vice-Chairman of All India Council of Technical Education – New Delhi). Dr. Kumar has been working on M.H.Saboo Siddik College of Engineering, Mumbai University for the last 17 years in different positions. Served as a member of Editorial Board of Industrial Engineering Journal, India. Also served as Hon. Secretary of Indian Institution of Industrial Engineers (Mumbai Chapter). Published and presented number of papers in International and Indian journals/conferences.
Dr. Mantha S S has been working as a professor of Robotics, AI and Control Theory for 25 years at the prestigious Institute, VJTI, in Mumbai and also been the Head, Department of Mechanical Engineering. He currently is on lien at the Institute, having been appointed as the Vice Chairman, All India Council for Technical Education (AICTE) in March this year. Currently he is the actg. Chairman AICTE having been appointed in July 2009. He also held the position of the Pro Vice Chancellor, SNDT University, Maharashtra. He is an academician of repute and an able administrator. He has over 160 publications in reputed Indian and international Journals and Conferences. He is also the recipient of the Prestigious best teacher award of the Government of Maharashtra. With the expertise in IT that he has, he has been appointed as an IT expert by the DIT, Govt. of Maharashtra and in the process has been instrumental in completing several IT projects for the State. He also is a reputed consultant in the area of Industrial Automation for several Industries in Mumbai and Pune including government organizations.
Dr. Arun Kumar is working as a principal of VIVA Institute of Technology, affiliated to Mumbai University. He has worked as Chairman, Board of Studies and Member of Academic Council in Mumbai University. His areas of interest are Total Quality Management, Human Resource Development and Materials Management.
369