automated acquisition of raw data, the distributed processing of this data, and the final archiving of ... Email: {mcann, yarrow, devivo, pm} @nas.nasa.gov ... ScyFlow: workflow editor, generator and execution engine (the focus of this paper); ...
ScyFlow: An Environment for the Visual Specification and Execution of Scientific Workflows Karen M. McCann* Maurice Yarrow* Adrian DeVivo* Piyush Mehrotra§
ABSTRACT With the advent of grid technologies, scientists and engineers are building more and more complex applications to utilize distributed grid resources. The core grid services provide a path for accessing and utilizing these resources in a secure and seamless fashion. However what the scientists need is an environment that will allow them to specify their application runs at a high organizational level, and then support efficient execution across any given set or sets of resources. We have been designing and implementing ScyFlow, a dual-interface architecture (both GUI and API) that addresses this problem. The scientist/user specifies the application tasks along with the necessary control and data flow, and monitors and manages the execution of the resulting workflow across the distributed resources. In this paper, we utilize two scenarios to provide the details of the two modules of the project, the visual editor and the runtime workflow engine.
INTRODUCTION NASA’s Earth and Space scientists are finding that the raw data being acquired and downloaded by satellites and deep-space missions is accumulating on data archive systems much faster than it can be transformed and processed for scientific experiments. In addition, scientists lack the visual tools that might allow them to rapidly design the appropriate transformation sequences for their data. The requirements for such a tool include: rapid visual prototyping of transformation sequences, the designation of processing pathology handling, the ability to automatically apply designated workflows to the processing of large sets of raw data files, the collation and post-processing of results, the advance and repeated scheduling of processing sequences, and the ability to easily modify these data transformation sequences: to accommodate changes in the intent of experiments, and to rapidly test new hypotheses. To provide scientists with a capability that addresses these needs, in this task we are building a GUI-enhanced tool, ScyFlow, that will allow flow-chart-like assembly of data acquisition and transformation steps, and will then instantiate this processing. This tool will support all stages: the automated acquisition of raw data, the distributed processing of this data, and the final archiving of results. In this paper, after a brief overview of the overall architecture, we describe two of the modules, the visual editor and the runtime engine, in more detail. We present two usage examples to describe the two modules.
*
Computer Sciences Corporation NASA Ames Research Center Mail: MS T27A-1, NASA Ames Research Center, Moffett Field, CA 94035 Email: {mcann, yarrow, devivo, pm} @nas.nasa.gov §
Motivating Scenarios In this section, we present two scenarios that represent typical problems faced by scientists who need to process large amounts of information, and/or execute large programs, in a distributed environment that might range from workstations to supercomputers. These two cases are modeled in a ScyFlow chart; see Figures 1 and 2 below. Scenario 1: Parametric Study: A CFD scientist wishes to vary the position of flaps on an aerospace vehicle geometry, and then apply a CFD flow solver code to the resulting geometry configurations for varying values of Reynolds number (aircraft speed) and alpha (angle of attack). The scientist may wish to run this workflow several times, changing configurations and parameter values; also, the scientist may wish to introduce some sort of test that will modify the parameter values themselves in order to “zero-in” on parameter sets of interest, or eliminate certain configurations that fail to meet specified criteria. Note that this represents 2 levels of parameterization: “i” geometry configurations, followed by (for each configuration) “j” (values of Reynolds number) times “k” (values of alpha), where total runs = i + (i * j * k); where there are i runs for the first level, then i * j * k runs for the second level, and the first level represents a meshing program that varies the flap positions, and the second level represents a computationintensive CFD flow solver to be run on a supercomputer system. In our example, let i = 3, j = 3 and k = 4, producing a total of 36 input data sets and 36 jobs, one for each input set. Scenario 2: Processing of Mars data: A scientist working on Mars mission data needs to download HDF files (latitude and longitude based) as they become available on agency web sites. These files typically contain some kind of gathered spectral data in twodimensions; where the first dimension is radar, light, or heat, etc., and the second dimension is a lat-long location for each of the first dimension values. In general, there will be many small HDF files, and a significant proportion of these HDF files will have problems or errors: for example, misaligned “corners” of lat-long sections, non-numerical values in numerical fields, or errors in data values that can be discovered and eliminated by some mathematical method, etc. After downloading, the files need to be examined for errors, and then each file with a particular error will need to be processed by the appropriate “fixer” code. Then the corrected files are “stitched” together into a single large file of corrected spectral data, which is then subjected to a compute-intensive spectral processing method. Typically, the results of the processing will be displayed as contours, or color-mapping, overlaid on a map of the area of interest, which is delimited by the composited set of lat-long values.
OVERALL ARCHITECTURE We are developing ScyFlow as part of a larger set of component applications. In order to allow our component applications to “talk” to each other, we have created a “container” application called ScyGate that manages and coordinates the interactions between the components. Initially, these contained applications will be: •
ScyFlow: workflow editor, generator and execution engine (the focus of this paper);
•
ScyLab: parameter study capability (next generation of ILab[1], with some additions so that it can be used by ScyFlow);
•
UniT: (Universal File Translator) program that generates translation code for transforming one data format into another data format;
•
FileTester: Perl/Tk utility that generates a Perl program that will parse any given ASCII data file and return designated values – can be used condition testing within a workflow.
•
ScySRB tool: getting SRB files into Experiments and WorkFlows, and putting output files from Experiments and WorkFlows back into the SRB.
•
Any additional modules: our architecture will allow additional component applications to be incorporated into the system at both an icon-based (data configuration) level and a programming-based level (use of a separate Registry API).
A ScyGate local server runs in the background and component applications open sockets to this server. Shared data is kept in a “ Registry” (which is both an data tree object and a data file) and is managed by the background server. Our aim in creating this application environment is to provide a framework for the deployment of several related applications, and to extend this framework in two ways: first, allow users to attach their own icons to the ScyGate “ icon corral” so that they can be launched from ScyGate (and, possibly, passed as input some file paths known to ScyGate); second, to allow developers to write code that attaches to the Registry server, so that the code produced by these developers can also “ talk” to other ScyGate applications. The framework also makes it easy for us to handle the updating of individual codes, since version information is one of the things handled by the Registry. Architecture of ScyFlow ScyFlow is an environment that supports the specification, execution and monitoring of workflows. It consists of two major components: •
ScyFlowVis provides the visual interface for specifying workflows. It also translates the visual flow graph into internal formats (XML, dependency list, pseudo-code) for storing and for communicating with the other components. The GUI can also be used as a visual interface to monitor the execution of workflows.
•
ScyFlowEngine provides the set of services required for the overall execution of the workflow across distributed grid resources, taking into account the specified control and data dependencies. A set of APIs will allow applications other than ScyFlowVis to also connect to the ScyFlowEngine in order initiate and monitor executions of workflows.
Definitions of ScyFlow Terminology
Below we define some terms that we use for data objects in the context of ScyFlow. Process: Basic unit of execution in any workflow; can be any type of script, or any type of compiled file, or a single command. The Process Object contains the data necessary to execute any given process - the type of Process, paths to necessary files and any other required data: command line arguments, special queue directives, etc. Experiment: A “ railroad” sequence of processes (no control structures) that is to be executed sequentially. Any process in an Experiment can be parameterized by a sequence of input values. The cross product of the input values gives rise to a set of independent input parameters that can be executed independently, essentially as “ job” units of an experiment in a parametric study. The Experiment Object contains pointers to the constituent Process objects, along with information about the parameterized inputs such as the input files, the locations within the files and the values to be used for these locations. For the purpose of explaining ScyFlow, an Experiment and a Process can be regarded as interchangeable, since an Experiment is just a set of Processes; we use the term "executable" to interchangeably refer to an Experiment or a Process. WorkFlow: A set of Experiments and/or Processes along with any control structures and data dependencies necessary for executing the subtasks. Workflow objects are really “ container” objects since they point to other Experiment and Process objects, but they also contain control flow information in the form of specific flow structures. All executable data, and control flow data, is represented as vertices in a directed graph, where each vertex is either an executable, or a control structure (SplitPath, Join, Cycle, or Pause). Job: A Job object represents a single input data set, attached to an associated workflow graph or Experiment object. Thus, an Experiment will result in multiple Jobs, one for each execution of the parameterized data set. A Workflow will have at least one Job, and each Job represents one traversal through the Workflow directed graph. A Workflow that has no Experiments (parameterized processes) will give rise to one Job in which (some sub-set) of Processes will be executed only once; a Workflow with Experiments will have many Jobs, and each Job will execute (some sub-set of) Workflow executable vertices once. (Note that in each case the sub-set of executed Experiments or Processes may include all Workflow vertices.) IMPORTANT: an Experiment object contains data flow information, i.e., information concerning parameterization, whereas a Process does not. ScyFlow’s data flow specification – as far as parameterization goes - takes place at the Experiment level. However, SplitPath and Join control structures at the ScyFlow level can cause data sets (jobs) to be multiplied or joined; when the workflow is executing, the ScyFlow execution manager keeps track of the data set totals, applying control flow variants to parameterized set specifications, in a manner completely transparent to users. The ScyFlow monitor display will feature data set totals, since these are determined at run time if any control structures are present in the directed graph.
SCYFLOW VISUAL INTERFACE: ScyFlowVis The ScyFlow system provides a visual interface for specifying the graph that represents the WorkFlow. Along with manipulating such graphs (e.g., creating, storing, modifying), a companion interface allows users to utilize the workflow graph to monitor the progress of the execution of the workflow. In this section we focus on the specification interface, providing details of the types of workflows that can be specified within ScyFlow. At the top level, the directed graph in ScyFlow has been designed to model the flow of operations only; data specification appears within the context of the Processes and Experiments (see below.) There are only 5 types of vertex, one for executables (Experiments or Processes), and 4 for control operations: SplitPath, Join, Cycle, and Pause; these are represented within the directed graph display by different icons. There are no vertices representing data, only one type of vertex which can represent operations upon data. Arrows indicate the flow of operations. Data Dependencies In order to minimize user input, data dependencies are handled in the following ways. First, data dependencies between Processes are specified within ScyLab merely by the order in which Processes are entered (this order can be easily modified by user.) If Process B is entered after Process A, ScyLab code “ assumes” that B is dependent on some files output by A, and the execution code handles output files from A accordingly. A similar model is followed by ScyFlow; whenever user adds a vertex to the directed graph, that vertex is either the first vertex (no dependencies), or is being added to a preexisting vertex. For example, if user adds vertex B to vertex A, ScyFlow also assumes that B is dependent upon A, and that A must be executed before B can be executed. Second, between executables in a Workflow, at the ScyLab level user must mark certain Process-specific files as “ Input to Next Experiment …” This information is used by the ScyFlow execution manager to assure that essential files are correctly copied and/or archived in the sequence of directed graph specified executions. For user’s convenience ScyFlow will include a data-dependency modeling display that will allow user to easily view and edit the data dependencies between portions of a Workflow; ScyLab will include a similar feature. The APIs for both ScyLab and ScyFlow will include functions that will return or change this information. Control Vertices in ScyFlow The small number of types of vertices in ScyFlow was achieved by making the control vertex types represent sets of similar operations. For instance, there is only one Cycle vertex, but the Cycle Properties contains options which can be set to execute different kinds of loops: counter loops, “ while” loops, and “ do … while” (or “ do … until” ) loops. A SplitPath vertex has similar options. It can have no test at all: this is an “ AND” condition that indicates that the output from the previous executable should be used as input for ALL the following executables. This option multiplies the Jobs (data sets) and may be set to execute simultaneously on different systems. Secondly, the SplitPath can
have a test based on either the return value of a program, or the existence or nonexistence of a file; this is an “ OR” condition. The return value of the specified OR condition test is then used to determine the following path, which will be the only path (out of all the possible paths) that gets executed for any given data set. Note that an “ AND” SplitPath introduced at any point in a workflow – including the beginning of a Workflow - can also have the effect of starting up separate simultaneous path(s) of execution at that point. The Join vertex is simpler: there are only two types of Join (1) an “ AND” Join, where execution at the Join must wait for input from all previous paths in order to continue; (2) an “ OR” Join, where input from any previous path can be passed to next executable, with no waiting. (Note in future we will probably add some Join options concerning file staging, depending on user requirements; for example, user may wish to copy/move/mark sets of files from previous executables in some way required by the executable following the Join vertex.) The Pause vertex is procedural only; it is intended to provide for cases where some data examination has to be performed before continuing the execution of the Workflow, or to provide for pathological cases, etc. Pause options include email, beep, etc.; a special Pause pop-up display will be provided so that users can examine paused data sets (Jobs) and mark these for discarding or continuing through the workflow. In ScyFlow, SplitPath and Join vertices are always labeled with their types: “ OR” or “ AND” , appearing in different colors. This disambiguates the meaning of these vertices, as far as control flow is concerned, in any given display. An alternative to the “ OR” and “ AND” labels might have been to have different types of vertices, drawn in different shapes, representing the varieties of Split and Join operations; but, this would have made the display more confusing, and would probably have required (in order to carry out such a design decision to its “ logical” conclusion) many more different shapes and types of icons in order to distinguish various operations. The Data Train Analogy The closest “ real-life” analogy to ScyFlow’s modeling notation is to compare the Workflow transit of the directed graph to the path a train would take through a series of railroad switches, while visiting several destinations before the end of its journey. Each separate train is a Job (or data set); each stop is an executable where data is unloaded and processed, and then different data is loaded back onto the train. SplitPath vertices are switches to several other tracks; Join vertices are switches that join two or more sets of tracks. Some options set by ScyFlow users can cause one train to get cloned (copied) into two or more trains; and, one or more trains can “ wait” at Join vertices until other trains arrive, so that all Join-specified trains can merge back into one train. In the simplest SplitPath case, with only OR conditions in any SplitPath vertices, a train sets out on a journey but its exact path and destination are not determined until each SplitPath test is done and the train is sent down one path instead of another. (Note that this presumes an exclusive OR only; ScyFlow does not currently model an inclusive OR, but this will be added.)
Design Motivation The motivation behind our design is as follows: it was important to create a notation system that was both easy to understand, and at the same time flexible and powerful enough to model complex workflows. As with most (if not all) directed graph problems, granularity is a very important issue; the ScyFlow design would not be successful if the ScyFlow workflow charts are ambiguous or too difficult to create and understand. The problem is that any representation of a complex real-life workflow problem will expand to be so visually complex as to be unsuitable for use and for visual “ cues” about structure. Even simple workflows can be very difficult to model. In terms of programming implementation this is an ongoing problem, made even worse by the graphical difficulties of creating a display where two or more vertices do not overlay each other. Our aim was to create a more visually intuitive display by simplifying the workflow representation: we have no data vertices and the number of vertex types has been minimized. We make the assumption that users will impose their own complexity on any given problem; it is important to keep the basic design as simple as possible in order to accommodate this. The “ collapse/expand” paradigm for a graphical interface needs to be used as much as possible, so that detail can be hidden in order to avoid a very large and overly complex display. ScyFlow implements this by allowing an executable vertex to “ expand” into a ScyLab Experiment which can be edited/created separately in ScyLab, then collapsed back into a ScyFlow executable vertex. ScyFlow Representations of the User Scenarios We now describe how the two scenarios presented earlier would be represented using the ScyFlow notation.
Figure 1: ScyFlow CFD user scenario Figure 1 shows the ScyFlow workflow representation of the first user scenario, multiple levels of parameterization. Note that this workflow is a “ railroad” , that is, a straight line: this is because there are no control structures in this workflow; no decisions are made at run time, and all possible data sets (Jobs) will be executed since there will be no tests
executed to eliminate any of them. The first executable, labeled “ Flaps” , would produce 3 geometries with varying flap positions; since this is not compute-intensive, user might run it locally, perhaps on a workstation. The following “ Pre-Processing” might involve fixes and/or changes to the geometry grids; also, local. The FlowSolver would probably be executed on a supercomputer; and the post-processing and graphics might run on some set of graphical systems.
Figure 2: ScyFlow Mars data user scenario Figure 2 illustrates the second user scenario. The user would construct a ScyFlow Workflow where the first executable is a “ web scraper” that will automatically download files from a site according to some constraints (e.g., all new files since a certain date, all files in some directory, etc.). Note that the ScyGate suite of utilities will contain a program that will generate this sort of program or script, either in Perl or in Korn shell.) The second vertex in user’s workflow would be a SplitPath control structure vertex, that will run a program that will apply several tests to each downloaded file, and return certain values indicating the appropriate “ fixer” program that should be run on each file. The SplitPath vertex will have several branches, one for each fixer program. Then, all paths leaving the SplitPath vertex will be followed by a Join control vertex with an “ OR” condition, indicating that any data set processed by any of the paths following the SplitPath vertex can then be passed to the next processing node following the Join control vertex. Following the Join vertex, the user would add an executable that would take all “ fixed” files as input, and use them to composite a large file. Adding another SplitPath test would determine whether the composition had accumulated a sufficient number of files to continue to the next executable. Once this test succeeds, the next executable would apply a compute-intensive spectral decomposition operation to the large data file, presumably on some available supercomputer resource. Finally, a graphics post-processor executable would get the results of the spectral program, and output graphics files for display. Each stage of this Workflow might or might not be accompanied by archiving instructions which will be performed at run-time by the Workflow execution manager. Note that the second SplitPath test has only one path, but, there is an “ implied” first path
which is to do nothing unless the SplitPath test succeeds. The first “ WebScraper” executable would continue to send data sets down the workflow, but the final spectral and graphics executables will not be executed until the final test succeeds. GUI vs. API Operation of ScyFlow and ScyLab: Automated Scripting Both ScyFlow and ScyLab will provide a data-file based API, plus the ability to generate this file from any GUI-constructed WorkFlow or Experiment object. This gives programmers/users the ability to “ script” any given execution of a WorkFlow or Experiment, since the generated data file – which will be used as input for the API - can be parsed, and re-run, by other programming modules.
SCYFLOW RUNTIME SYSTEM: ScyFlowEngine The workflow execution engine consists of two components. The first of these is the dependency handler, which expands compiled dependency data. The second component of the execution engine is the server/sub-server architecture, which spawns the work indicated by the directed graph and subsequently monitors the progress of jobs and determines which dependent work may be run from the completion-status information of finished dependencies.
GUI or API sends graph to server
ScyFlow WorkFlow Engine (server)
starts
Sub-Server
Machine A
Sub-Server
Machine A
Sub-Server
Machine B
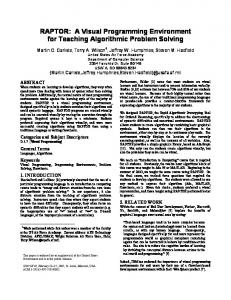
Figure 3: Operation of the WorkFlow Execution Manager The workflow execution engine is a server/sub-server architecture. It utilizes socket communications for the transfer of job instructions from the server to the sub-servers and for transfer of job completion information from the sub-servers to the server. The subservers are basically “ dumb” and do no dependency analysis or runtime decisions. The server contains the directed-graph compiler, which produces a dependency list. This list is used to determine which components of the user work may be processed (dependents) once any prior component (a dependency) has been successfully completed. Note that currently, control flow capability has been developed and is working, though both control and data flow specification are done in the GUI graph editing. Thus each graph traversal implies a single path of execution of user work through the graph. The server also contains the apparatus which spawns sub-servers onto user- or resource-brokerdesignated compute machines. The spawning of a process can be accomplished by either ssh, gsissh, or the NAS JobManager. Once a sub-server has been spawned onto a
designated resource, the sub-server will thereupon open a connection to the server’s listener-socket and request from it the instructions to be performed. The server is based on a multiplexing architecture and can simultaneously handle any number of user jobs flowing through any number of graphs whose vertices can be partitioned onto any number of remote resources. At this time, each user job is serviced by one sub-server, but our architecture will permit a single sub-server to service multiple jobs running on its particular resource. Because the sub-servers communicate back to the server immediately with any vertex completion statuses, monitoring of job status is real-time.
ScyFlow WorkFlow Engine (server)
ScyFlow WorkFlow Engine (server)
ScyFlow WorkFlow Engine (server)
Sub-server requests work Sub-Server Server issues instructions Sub-server forks/execs job handler, then enters Sub-Server drop-down listen-socket loop. When Job work done, job handler notifies sub-server, which exits listen-socket loop
Sub-Server
Sub-server reports job completion status, requests new work
Figure 4: WorkFlow Life Cycle Here is a detailed look at the life cycle of a workflow graph in our server/sub-server architecture. Once the graph has been constructed (either by the GUI or API) and userprocess attributes given appropriate values, the GUI/API will open a connection to the server listener-socket and pass to it a serialized graph object or graph file-package location. The server then compiles the graph and produces a dependency list for the graph vertices. Then, the first dependent with no dependencies is chosen and a "HostServer" is spawned onto the remote machine indicated for this vertex (chosen either by user designation or resource-broker). The HostServer opens a connection to the server, identifies itself by JobName and requests work to be performed. The server passes to it instruction(s) to perform. The sub-server chooses an appropriate "job handler" to perform the work and thereupon forks and execs this job handler, thereby allowing the sub-server to avoid blocking while the work is being performed. The sub-
server opens its own drop-down listener-socket loop and waits for either completion status from its job handler or for possible shutdown/discontinue requests from the server. When the job handler has completed the user work and notified the sub-server, the subserver exits its listener loop and reports completion status for this job to the server. The server updates its job/vertex data object with completion or failure status for the vertex, and then determines, using the dependency list, which next dependent task may be run, if any. If the next valid dependent vertex is on the same machine as last, the reporting subserver is given this work, otherwise the sub-server is given shutdown instructions, and a new sub-server is spawned onto the resource selected for this next vertex. Subsequently, this new sub-server will open a connection to the server and obtain the vertex work, etc. Related Work Some related projects are: SciRun, developed at the University of Utah and used for a variety of applications including molecular biology [2]; Cantata / Khoros, commerically developed in Utah and used for image processing[3]; UNICORE, developed in Germany as a generic workflow package[4]; and DAGman, part of the CONDOR project, developed by Myron Livny at the University of Chicago [5].
Conclusions The new ScyFlow system presents two innovations: a new design for workflow modeling, and the ability to handle both control flow and data flow within any given workflow. This powerful and flexible system provides generic capability for creating and running workflows, without being domain-specific; in addition, ScyFlow requires absolutely no “ instrumentation” of any participating codes, that is, users can run ScyFlow without doing any programming whatsoever. Our object oriented design restores state for workflow data sets, since WorkFlow objects are easily serialized to/from files, and transported over sockets. ScyFlow’s “ scripting” ability (the API, Applications Programming Interface) is not only convenient for users – since WorkFlow objects can be “ dumped” to a script file and used to re-run the workflow – but is also usable by external programming modules for deployment in many distributed environments.
References [1] Production-Level Distributed Parametric Study Capabilities for the Grid, M.Yarrow, K.M.McCann, E.Tejnil, A.DeVivo. Grid Computing - GRID 2001 Workshop proceedings, Denver, CO, November 2001. [2] software.sci.utah.edu/scirun.html [3] www.khoral.com [4] www.unicore.org [5] www.cs.wisc.edu/condor/dagman