State Key Laboratory of Software Development Environment. Beihang University ... age are first grouped using both matched visual features and their spatial ...
SEARCH BY MOBILE IMAGE BASED ON VISUAL AND SPATIAL CONSISTENCY Xianglong Liu, Yihua Lou, Adams Wei Yu, Bo Lang State Key Laboratory of Software Development Environment Beihang University, Beijing 100191, China ABSTRACT Performance of state-of-the-art image retrieval systems has been improved significantly using bag-of-words approaches. After represented by visual words quantized from local features, images can be indexed and retrieved using scalable textual retrieval approaches. However, there exist at least two issues unsolved, especially for search by mobile images with large variations: (1) the loss of features discriminative power due to quantization; and (2) the underuse of spatial relationships among visual words. To address both issues, considering properties of mobile images, this paper presents a novel method coupling visual and spatial information consistently: to improve discriminative power, features of the query image are first grouped using both matched visual features and their spatial relationships; Then grouped features are softly matched to alleviate quantization loss. Experiments on both UKBench database and a collected database with more than one million images show that the proposed method achieves 10% improvement over the approach with a vocabulary tree and bundled feature method. Index Terms— mobile image, feature group, spatial information, soft match 1. INTRODUCTION Recently there emerge a class of image search applications whose query images captured from a mobile device like a camera mobile phone (named mobile images). In daily life when people encounter objects (books, arts, etc.) that they are interested in, they would like to get information about these objects. Because mobile phones have become an important part of life, it would be an easy and useful way to take photos of these objects using mobile phones and then search the related information only by submitting these photos to the visual search engine. There are many applications for such a system, for example Google goggles and other applications like CD search and street search. In this paper, given a query image (mobile image) taken by the mobile phone, our goal is to retrieve its most similar image in a large scale image database where usually the most similar image is the original image taken photos of and are associated with their relevant information.
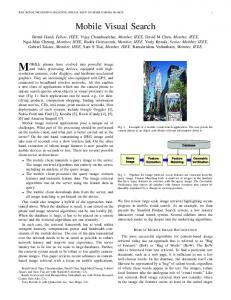
Fig. 1: Examples of mobile images. In the literature image search has been very extensively investigated. However in this paper, searching by mobile images differs from traditional image retrieval, due to image appearance variations caused by background clutter, foreground occlusion, and differences in viewpoint, orientation, scale and light conditions. Figure 1 illustrates some examples of images taken by the mobile phone. As it shows, users often take photos of different portions of the original image from different views or under different light conditions. Meantime the background clutter and foreground occlusion frequently occur. All these factors make mobile images differ from the original ones in appearance. State-of-the-art large scale image retrieval systems [5, 2, 6, 7] achieve efficiency by quantizing local features like Scale-Invariant Feature Transform (SIFT) [1] into visual words, and then applying scalable textual indexing and retrieval schemes [11]. However, there exist at least two issues unsolved from visual and spatial aspects, which have critical effect on search by mobile images with large variations: (1) The discriminative power of local features is limited due to quantization; (2) The spatial relationship between features are not exploited enough. For issue (1), researchers have developed techniques like soft assignment [4] and multitree scheme [7] for image representation using visual words. To address the second issue, the geometric verification [3, 8] is used as an important post-processing step for retrieval precision. But in practice full geometric verification is computationally expensive and can only be applied to the top-ranked
results. Moreover, most of previous research take these two issues into consideration independently, and till now there has been few work to couple both spatial and visual information together to alleviate these issues. In [6] Wu et al. have attempted by exploiting the geometric constraints using bundled features grouped by Maximally Stable Extremal Regions (MSERs) [10]. However, match between all regions is time consuming and no rotation assumption is not suitable for mobile images. More importantly, for mobile images, due to the variations derived from photography, some MSERs are not repeatable which degrades the match accuracy. Motivated by our observations on mobile images, in this paper we propose a novel method to group local visual features (SIFT) using the exactly matched visual words and their geometric relationships to improve features discriminative ability. Then we provide a soft match scheme for the grouped features to alleviate the loss of feature quantization. By feature grouping and soft match, visual and spatial information are coupled consistently. For efficient retrieval, we also design an efficient index scheme and score the search result using Term Frequency Inverse Document Frequency(TFIDF). Experiments on UKBench database [2] and a collected database of more than 1 million images, show that our method achieves at least 10% improvement over the method using vocabulary tree [2] and bundled features approach [6], while the time is increased slightly. The main contribution of our work is that we explore a novel scheme that achieves visual and spatial consistency and is proven to be effective in search by mobile images, especially when large variations exist. This paper is organized as follows. Section 2 describes feature grouping method combing both visual and spatial information. In Section 3 the score method using soft match is presented. Section 4 discusses experimental results. Finally we conclude in Section 5. 2. FEATURE GROUP BASED ON VISUAL AND SPATIAL CONSISTENCY Grouped features have been proven to be more discriminative than individual local features [6]. In this section first we introduce features we will use: SIFT and MSER. Then we will propose a novel schema to group SIFT features in query image according to MSERs detected in database images and exactly matched SIFT points between them. 2.1. Visual Features The SIFT feature is one of the most popular and robust point features [1], which is invariant to image variations like scale and rotation. Since SIFT features are of high dimension, to match them using similarity will be time consuming. The efficient way is bag-of-words which quantizes SIFT features into some visual words using the vocabulary tree [5, 2, 6].
Fig. 2: Grouping features using matched points. left: the original database image; right: the mobile image. Blue ”.” and green ”+” respectively mark SIFT points and exactly matched SIFT points. Points that fit affine transformation well are labeled by red circles near ”+” and connected by dot lines. In this paper, we extract SIFT features of each image including both database images and query images, and quantize them using the vocabulary tree as [2] did. The vocabulary tree, built by hierarchical k-means clustering, defines a hierarchical quantization. First, features of all the training data are extracted and clustered by an initial k-means process into k (we set k = 10) groups. Then the same clustering process is recursively applied to each group of the features and finishes when the tree goes up to the maximum level L (we use L = 6). For feature quantization, each feature is simply propagated down the tree by comparing the descriptor vector to the k children cluster centers at each level and choosing the closest one until the L level (or leaf node) is reached. Then features can be represented by corresponding leaf nodes (visual words) in the vocabulary tree. To enhance the discriminative ability of SIFT, region features like the Maximally Stable Extremal Region (MSER) [10] can be used to group SIFT features [6]. MSER performs better on detection of affine-covariant stable elliptical regions than other region features like Harris-affine and Hessian-affine [9]. However, MSER detector usually fails to work well on mobile images due to variations induced by different imaging noises like occlusion, viewpoint and lighting conditions. Figure 2 shows that the MSERs detected from the mobile image and the original image are quite different. In our work, database images are free of variations, so MSERs can be extracted well and indexed. For query images, the MSER detector cannot be applied directly to grouping features. Our observation, that usually corresponding regions of query images and original database images have more common SIFT features exactly matched, motivates us to detect the corresponding regions in mobile images using the information of these matched SIFT points. Then only features falling into the corresponding regions can be matched, which not only avoids wrong feature match, but also enables soft match between corresponding features that are quantized into
Fig. 3: Region Detection: (1) estimate affine transformation using x; (2) transform x0 to determine the corresponding region in query image. neighbor visual words in the vocabulary tree. 2.2. Features group Wu et al. used MSER to bundle features of both query and database images [6]. In Figure 2 show that the two MSERs of mobile image and database image are not well aligned, and SIFT points are not well matches. However, if we closely inspect the matching SIFT features in the figure we can observe that usually some points in the corresponding regions match very well. Figure 2 highlights the well matched SIFT points (green ”+” connected by dot lines). Furthermore it shows that in corresponding regions there exist more corresponding points quantized to their neighbor words (blue ”.”). So if we can accurately detect the region of the mobile image corresponding to MSER of the database image, then features in this region can be grouped and matched softly with those in the MSER of the database image. So we can enhance the discriminative power of features and thus improve the retrieval precision. The straightforward way to detect the corresponding region is that, since the local region are usually small, we can assume the region in query image is obtained by affine transformation of MSER in the original database image. Figure 2 shows that the matched points fit the affine transformation very well (red circles near ”+” connected by dot lines). Then in each MSER, some points are exactly matched (or common words). As Figure 3 shows, using these matched points x = (x, y)T and u = (u, v)T , we can estimate the affine transformation which can be written in the following form with six parameters: µ Ax =
a00 a10
a01 a11
tx ty
¶Ã x ! y 1
µ =
u v
¶ (1)
So we can randomly select 3 pairs of matched points satisfying simple geometric constraints and estimate the affine transformation from these matched points by solving linear equations as [1] did. After estimation, we can detect the corresponding region in the query image by affine transformation of the corresponding MSER (only three key points x0 ) in the original image as shown in Figure 3: Ax0 = u0 ,
(2)
Denote S = {pi } the SIFT features and R = {rk }, k > 0 both the MSER in the database image I and the detected region in the input mobile image Q. We define feature groups Gk to be: Gk = {pi |pi ∈ rk , pi ∈ S}, where pi ∈ rk means that the point feature pi falls inside the region rk . For each Gk , if its corresponding feature group G0k in query image Q can be detected through the above process, we denote Gk BQ. In practice the ellipse of the MSER is enlarged by factor 1.5 when computing pi ∈ rk [6], and rk is discarded if it is empty or its ellipse spans more than half the width or height of the image. Furthermore, SIFT features that do not belong to any Gk are treated to fall into the same region r0 and form G0 . Here, G0 unsatisfies G0 B Q because it is not a MSER of I. Since the feature group contains multiple SIFT features and the spatial corresponding information, we believe that they will be more discriminative than a single SIFT feature which will be verified by our experiments. These feature groups also allow us to utilize relationships between the neighbor visual words in the corresponding regions. We will discuss it in next section. 3. SOFT MATCH AND SCORE In the corresponding region detection, the matched features help to locate their positions fast and accurately. After corresponding regions are detected, features that fall into a same region are grouped and soft match can be made between points in them to enhance features discriminative power. 3.1. Soft match Due to different variations mentioned before, features of the mobile image are usually changed compared with corresponding ones of the original database image. Thus after feature quantization, the visual words of corresponding features may be different as Figure 2 shown. However, our observation indicates that these visual words are usually neighbors in the vocabulary tree. So in this paper, we softly match features in the corresponding regions to alleviate the quantization loss and thus improve the match accuracy. Compared to [4], this method works in word space and saves distance computation between features and several cluster centers. Let Gk = {pi }, (k > 0) feature group in database image I and G0k = {qj } its corresponding feature group in query image Q. Point features pi , qj are quantized and represented by visual words in our visual vocabulary W . If kpi − qj k ≤ D which means they are close in W , then we call that they are neighbors and denote NpDi (qj ). Note that when D = 0, namely pi = qj , the neighbor words are exactly matched. ½ 1, if kpi − qj k ≤ D; D Npi (qj ) = (3) 0,
if kpi − qj k > D
We use exponential weighting function to measure the importance of soft match. The weight decays as the distance of
two words in vocabulary tree increases: ωpDi ,qj = NpDi (qj )e−kpi −qj k
(4)
3.2. Score
(a) inverted file index for visual words
Then in retrieval, the TF-IDF score [11] is used to measure the similarity. For each visual word pi in the feature group Gk of database image I: If Gk BQ, then visual words of Gk and corresponding G0k detected in Q can be both exactly and softly matched; Otherwise, only exact match is operated on words of Gk and Q. Now, we define a matching score MQ (Gk ) for feature group Gk . The matched features are scored: X D λGk ,G0k ωpi ,qj υpi υqj , if Gk B Q; pi ∈Gk qj ∈G0k MQ (Gk ) = (5) X 0 ωpi ,qj υpi υqj , otherwise pi ∈Gk qj ∈Q
(b) region index
Fig. 4: Index structure. We can see that the matching score contains three terms: standard TF-IDF score for feature groups, score correction of wrong matches, and the score for soft match of local grouped features. In the second term, part of wrong matches in Gk satisfying Gk B Q are removed by feature grouping. For the N 0 (qj )
where υ· = tf· idf· is normalized, tf· is the word frequency and idf· is the inverse document frequency. We give a higher score for spatial matched regions with more common visual words using the term λGk ,G0k : X λGk ,G0k = ln Np0i (qj ). (6)
N ≥ 0. It third term, because λGk ,G0k > 1 and pNi p ≤ 1, SQ i means that for database images I that have more corresponding regions to the query image Q, more wrong matches would N be eliminated and additive positive score SQ will be added, and thus the last two terms will be very helpful for search by mobile images and especially partial ones.
pi ∈Gk ,qj ∈G0k
Here, because Gk B Q holds, P there exist at least three extactly matched points, namely pi ∈Gk ,qj ∈G0 Np0i (qj ) ≥ 3, k and thus λGk ,G0k > 1. Finally, a database image I is scored S for the query image Q: X SQ (I) = MQ (Gk ). (7) Gk
The score actually combines both spatial and visual match, and achieves a consistency between them by the region detection and soft match. This score is normalized, and regions with many common and neighbor words will be scored higher than regions with fewer matched words. To compute the score efficiently, we can rewrite it in the following form: X W N SQ (I) = Np0i (qj )υpi υqj − SQ + SQ , (8) pi ∈Gk ,qj ∈Q
where,
W SQ =
X X
Np0i (qj )υpi υqj ,
(9)
Gk BQ pi ∈Gk
qj ∈G / 0k
N SQ =
X X Gk BQ pi ∈Gk
P
qj ∈G0k
(λGk ,G0k −
Np0i (qj ) D )ωpi ,qj υpi υqj . (10) Npi
P Npi = Gk BQ pi ∈Gk ,qj ∈G0 Np0i (qj ). Then the score k can be calculated efficiently by traversing inverted file index as textual retrieval does.
3.3. Index The remaining challenge is how to efficiently search in a large scale image search system. We use an inverted file index [11] for large-scale indexing and retrieval, since it has been proved efficient for both text and image retrieval [5, 2, 6]. Figure 4(a) shows the structure of our index. Each visual word has an list in the index containing images and MSERs in which the visual word appears. So in addition to the image ID (ImgID, 32 bit) and MSER ID (RID, 8 bit), for each occurrence of a visual word, the word frequency (TF, 8 bit) is also stored as traditional inverted file index does. This format supports at most 4,294,967,296 images and 256 MSERs per image. Actually all images contains less regions than 256 in this paper. The traditional text index would contain the location of each word within the document, while in our index we stored positions of visual words in each database image. Also another table records central point coordinates, lengths of major and minor axis, and angles for MSERs of each database image with structure shown in Figure 4(b). After index has been built, the mobile image retrieval can be solved by scoring the database image through steps discussed above, and database images are ranked by their scores. 4. EXPERIMENTS We evaluate the proposed method by performing queries on a reference database and a collected database.
(a)
Fig. 5: Data set examples: database and mobile images 4.1. Data set and measurement First we crawled one million images including posters and CD covers of 4000 most popular singers in Google Music (http://www.google.cn/music/artistlibrary) to form our basic data set. Then, we manually take photos of sampled CD covers using camera phones (CHT9000 and Nokia 2700c, 2.0 Mega pixels cameras) with background cluttering, foreground blocking, and different light conditions, viewpoints, scale and rotations. Then 100 representative mobile images are selected and labeled as our queries in our experiments. Each of these mobile images is corresponding one original image in the data set. Figure 5 illustrates typical examples. Next SIFT features and MSERs are extracted and a vocabulary tree with 1 million words is used to quantize SIFT features as mentioned before. To evaluate the performance with respect to the size of the data set, we also build three smaller data sets (5K, 30K, and 100K) by sampling the basic data set which can be downloaded from http://www.nlsde.buaa.edu.cn/∼xlliu/icme2011. We also conduct experiments on full data set of UKBench [2]. In this paper, for mobile image search we concern whether the original database image is retrieved and ranked on the top, namely the rank of the correct answer, so we use mean reciprocal rank (MRR) as our evaluation metric following [12]. For each query image, its reciprocal rank is calculated and then averaged for all queries. The MRR is defined as follows: M RR =
1X 1 , n i ranki
(11)
where n is the query number and ranki stands for the position of the original database image in the retrieved list. We only consider the top 10 results in this paper. 4.2. Evaluation We compare our method with the recognition method with vocabulary tree (”voctree”) [2] and bundled features method (”bundle”) [6]. All methods are running without reranking using geometric verification. We use a vocabulary of 1M visual words following [2] and the maximum distance D of nearest neighbors in the soft match is set to 10. UKBench experiments. UKBench contains images with typical variations including changes of both viewpoint and orientation, while other noises (light conditions, foreground
(b)
Fig. 6: Performance comparison on different data sets: (a) UKBench data set; (b) collected data set Table 1: MRR performance of different values of D D 0 1 3 5 10 15 5K 0.836 0.854 0.862 0.873 0.877 0.854 30K 0.712 0.718 0.727 0.746 0.731 0.709 100K 0.632 0.641 0.651 0.652 0.665 0.645 1M 0.459 0.462 0.450 0.435 0.463 0.431 occlusion, complex background, etc.) are relatively slight. We first evaluate the image search performance of the three methods on it using mean Average Precision (mAP) as [6] did. The query images are sampled from the data set. Figure 6(a) 1 shows that the performance of the proposed method and ”voctree” are quit close, and both of them outperform ”bundle” significantly. Further experiments on our collected data sets, where MRRs of ”bundle” are lower than 20%, also verify this conclusion. The reasons why ”bundle” fails in these experiments include: (1) some MSERs and SIFT points are not repeatable due to variations which occur frequently in both the reference and our data sets (Figure 7 (a) and (b)); (2) the weak geometric verification is based on no rotation assumption, while usually the mobile images are rotated from original images more or less (Figure 1); (3) SIFT points that fall into no MSER are discarded, which loses much information in both query and database images (Figure 7(b)). Collected database experiments. Different to UKBench experiments above, experiments on our collected data set use mobile images, which are photographed from CD covers using mobile cameras in real environments like CD shops. These images contain much more variations like complex background and poor light conditions shown in Figure 1 and Figure 5. Performance comparison between the proposed method and ”voctree” is shown in Figure 6(b). On the 5K, 30K, 100K, and 1M data sets, the MRRs of the proposed method are around 10% higher than that of ”voctree”, which indicates that our method works much better on mobile images especially with large variations. This is because that the grouped features and their soft match in our method serve as a complement to the traditional visual TF-IDF by achieving visual and spatial consistency. All three methods are designed to work well on duplicate 1 error
correction of experimental results
6. ACKNOWLEDGMENT
(a)
(b)
(c)
Fig. 7: Comparison of feature groups : (a) SIFT (blue ”.” and green ”+”) and MSERs (red ellipses) of the original image; (b) Matched SIFT (green ”+”) and MSERs (yellow ellipses) of bundled method; (c) Matched SIFT (green ”+”) and detected regions (yellow ellipses) of the proposed method Table 2: Average query time voctree proposed time 0.87s 1.34s image search, however, based on visual and spatial consistency, our method can also work well on mobile images especially when large variations exist between mobile images and the original database images. Examples in Figure 7. Figure 7(b) and (c) demonstrate that our method can detect more corresponding regions than ”bundle”, which allows us to use soft match between feature groups to combine visual and spatial information together, and thus to alleviate problems of discriminative power loss and spatial relationships underuse. Impact of soft match. The D value in Eq.5 determines the weight in the soft match score. We test the performance of our method using different D on collected data sets. Because neighbors have high probabilities to be the same features, soft match tries to alleviate feature quantization loss. However, too large neighbor range will introduce much noise and computation, and thus degrade the performance. As Table 1 shows, the most effective value of D is around 10. Runtime. We perform experiments on a desktop with a single CPU of 2.5GHz and 16G memory. Table 2 shows the average query time for one image query on 1M data set. It indicates that the proposed approach takes no much more query time but achieves higher retrieval accuracy than ”voctree”. 5. CONCLUSION In this paper we have proposed a novel method for search by mobile images. With respect to properties of mobile images, features of query image are first grouped using matched ones and their spatial corresponding information; Then feature groups are softly matched. Our method exploits spatial relationships between features and combines them with visual matching information to improve features discriminative power. Experimental results make us believe that the performance may be improved further by exploiting better schemes that can utilize both visual and spatial information consistently.
We thank anonymous reviewers for their valuable comments. We also would like to thank Wei Su and Hao Su for discussion on spatial information and data collection. This work is supported by the National HighTechnology Research and Development Program (2009AA043303) and National Major Project of China ”Advanced Unstructured Data Repository” (2010ZX01042-002-001-00). 7. REFERENCES [1] D. Lowe, ”Distinctive image features from scaleinvariant keypoints,” IJCV, 20:91-110, 2003. [2] D. Nister and H. Stewenius, ”Scalable recognition with a vocabulary tree,” CVPR, 2006. [3] J. Philbin, O. Chum, M. Isard, J. Sivic, and A. Zisserman, ”Object retrieval with large vocabularies and fast spatial matching,” CVPR, 2007. [4] J. Philbin, O. Chum, M. Isard, J. Sivic, and A. Zisserman, ”Lost in quantization: Improving particular object retrieval in large scale image databases,” CVPR, 2008. [5] J. Sivic and A. Zisserman, ”Video Google: A text retrieval approach to object matching in video,” ICCV, 2003. [6] Z. Wu, Q.F. Ke, M. Isard, and J. Sun, ” Bundling features for large-scale partial-duplicate web image search,” CVPR, 2009. [7] Z. Wu, Q Ke, and J. Sun, ”A multi-sample, multi-tree approach to bag-of-words image representation for image retrieval,” CVPR, 2010. [8] S. Lazebnik, C. Schmid, and J. Ponce, ”Beyond Bags of Features: Spatial Pyramid Matching for Recognizing Natural Scene Categories,” CVPR, 2006. [9] K. Mikolajczyk, T. Tuytelaars, C. Schmid, A. Zisserman, J.Matas, F. Schaffalitzky, T. Kadir, and L. Van Gool, ”A comparison of affine region detectors,” IJCV, 65:43-72, 2005. [10] J. Matas, O. Chum, M. Urban, and T. Pajdla, ”Robust wide baseline stereo from maximally stable extremal regions,” BMVC, 2002. [11] G. Salton and C. Buckley, ”Term-weighting approaches in automatic text retrieval,” Information Processing and Management: an International Journal, v.24 n.5, p.513523, 1988. [12] E.M. Voorhees, ”TREC-8 Question Answering Track Report,” Proceedings of the 8th Text Retrieval Conference, pp. 77-82, 1999.