Diversity 2014, 6, 18-32; doi:10.3390/d6010018 OPEN ACCESS
diversity ISSN 1424-2818 www.mdpi.com/journal/diversity Article
Seasonal Changes in Microbial Community Structure in Freshwater Stream Sediment in a North Carolina River Basin John P. Bucci 1, †, Anthony J. Sze mpruch 1, ‡, Jane M. Caldwell 1 , Joseph C. Ellis 2 and Jay F. Levine 1,* 1
2
†
‡
Aquatic Epidemiology and Conservation Laboratory, Department of Population Health and Pathobiology, College of Veterinary Medicine, North Carolina Sta te University, 1060 William Moore Drive Raleigh, NC 27607, USA; E-Mails:
[email protected] (J.P.B.);
[email protected] (A.J.S.);
[email protected] (J.M.C.) In Silico LLC, 1634 Southcross Street, Fuquay-Varina, NC 27526, USA; E-Mail:
[email protected] Currently at the School of Marine Science and Ocean Engineering, University of New Hampshire, Durham, NH 03824, USA Currently at the Department of Biochemistry and Molecular Biology, University of Georgia, Athens, GA 30602, USA
* Author to whom correspondence should be addressed; E-Mail:
[email protected]; Tel.: +1-919-513-6368; Fax: +1-919-513-6464. Received: 27 October 2013; in revised form: 3 December 2013 / Accepted: 24 December 2013 / Published: 3 January 2014
Abstract: This study examined seasonal differences in microbial community structure in the sediment of three streams in North Carolina’s Neuse River Basin. Microbes that reside in sediment are at the base of the food chain and have a profound influence on the health of freshwater stream environments. Terminal-Restriction Fragment Length Polymorphism (T-RFLP), molecular fingerprint analysis of 16S rRNA genes was used to examine the diversity of bacterial species in stream sediment. Sediment was sampled in both wet and dry seasons from an agricultural (Bear), mixed urban (Crabtree) and forested (Marks) Creek, and the microbiota examined. Gamma, Alpha and Beta proteobacteria were prevalent species of microbial taxa represented among all sites. Actinobacteria was the next most prevalent species observed, with greater occurrence in dry compared to the wet season. Discernable clustering was observed of Marks and Bear Creek samples collected during the wetter period (September–April), which corresponded with a period of higher
Diversity 2014, 6
19
precipitation and cooler surface water temperatures. Although not statistically significant, microbial community structure appeared different between season (ANOSIM, R = 0.60; p < 0.10). Principal components analysis confirmed this pattern and showed that the bacterial groups were separated by wet and dry seasonal periods. These results suggest seasonal differences among the microbial community structure in sediment of freshwater streams and that these communities may respond to changes in precipitation during wetter periods. Keywords: microbial community analysis; T-RFLP; stream microbiome; seasonal variation
1. Introduction Microbial communities in freshwater streams are a diverse functional assemblage of bacteria that include prokaryotes, microeukaryotic phototrophs a nd heterotrophs that influence key processes in stream nutrient cycles [1]. These microbes are vital to the stream food web and changes in their structure or composition can vary on a temporal scale [2], which can have unintended consequences for stream biotic health. Low order streams are a primary link between aquatic and terrestrial systems [3]. Seasonal fluctuations in flow, temperature, the input of inorganic compounds and the suspension and deposition of allochthonous and autochthonous organic materials have the potential to alter microbial structure in freshwater streams within large urban watersheds [4]. Although temporal and spatial differences in bacterioplankton population structure have been observed in response to seasonal fluctuations in flow and related limnological conditions [5,6], stream sediment microbial structure is much less understood. Seasonal changes in rainfall can hydrologically fragment stream flow and bacterioplankton population dispersal, impacting the quality of dissolved organic matter that supports these bacterial populations [7]. Stream microorganisms that drive oxidation and nitrification are of importance to sediment habitat and benthic residents [8]. During the drier, warmer season, denitrification processes trigger microbe- mediated ecosystem processes in stream sediments and in turn can change community structure [4,9,10]. Although sediment microbial communities may demonstrate similar shifts in response to seasonal condition as those observed in bacterioplankton, few studies have linked variable seasonal influences with the microbial community structure of stream sediments. In one study, Hullar and coworkers (2006) observed seasonal changes in Gamma and Beta-proteobacteria populations in three streams over a four-year period in a Delaware drainage basin [2]. In this study we evaluated seasonal level comparisons of hyporheic microbial community structure using terminal restriction fragment length polymorphism (T-RFLP) analysis of 16S rRNA genes in sediment samples collected from three streams within North Carolina’s Neuse River Basin (NRB). Sampling was conducted across seasonal periods with the intent to characterize class level differences in bacterial community structure.
Diversity 2014, 6
20
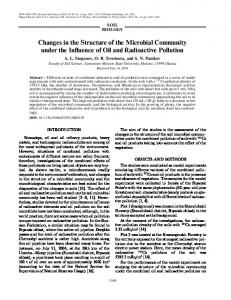
2. Methods 2.1. Study Area and Site Descriptions Stream sampling sites were located in the upper Neuse River Basin (NRB), which encompasses a large area (15 km2 ) including metropolitan Raleigh, North Carolina. A combination of residential septic, storm water, fertilizer and animal wastewater is considered to be a major source of nitrogen to NRB watershed streams [11,12]. Nitrogen inputs are transported from point and non-point sources via streams where inorganic compounds (i.e., aqueous nitrate) enter surface water and become incorporated into sediment organic matter [13]. Three sampling sites included first order streams: Bear Creek (N 35°16.5′ W 77°47.7′), Crabtree Creek (N 35°49.3′, W 78°38.0′), and Marks Creek (N 35°42.4′, W 78°25.9′) (Figure 1). Figure 1. Map of upper Neuse River Basin with study sites marked by star.
Bear Creek’s surrounding watershed includes drainage from crop and inte nsive animal farm operations where a high concentration of nitrate is associated with frequent surface water discharge runoff. The Crabtree Creek site is in an urban watershed exposed to a major point source contributor of nitrogen downstream from a municipal wastewater facility. In contrast, Marks Creek is a smaller tributary located in the Neuse River Basin. It is in a primarily forested watershed with residential and mixed-use lands less represented. Lower nitrate concentrations have been documented for this site compared to Bear and Crabtree creeks [14]. However, the entire watershed is influenced by non-point nitrogen sources such as failing septic systems, fertilizer waste and atmospheric deposition. 2.2. Sediment Microbial Sampling Surficial sediment (i.e., to a depth of 10 cm) was sampled at the three study sites for T-RFLP bacterial analysis during wet and dry seasons from 2007 to 2008. Seasonal periods corresponded to wetter/cooler and drier/warmer months annually. Samples were collected (in duplicate) at the shallow bank of each stream site using a hand-held PVC® coring device (JM Eagle™ , Los Angeles, CA, USA).
Diversity 2014, 6
21
Sample IDs corresponded to designated codes described in Table 1 and the same IDs were used throughout analyses. Each sample extended to approximately 2 cm below the benthic surface to capture the recent condition of the microbial community. Upon field sampling, the sediments were transferred into sealable plastic bags and placed on ice within 2 h until delivery to the laboratory then stored at −20 °C. Once in the laboratory, samples were sieved with mesh strainers to differentiate between two different sediment size fractions, coarse (4–8 mm, analogous to fine gravel) and fine (125–250 µm, analogous to fine sand) and kept frozen until microbial analysis. Table 1. Sample identification numbers, collection dates and ambient water parameters for the three sampling sites are listed. Naming convention: The first letter signifies stream site; M = Marks Creek, B = Bear Creek, C = Crabtree Creek. Second letter signifies seasonal period in which collected; D = dry, W = wet. Numeric code is the year of collection. Lower case letters depict sediment size; c= coarse; f = fine. SWI and Evenness correspond to Shannon Weaver indices for sediment bacterial analysis. Samples
Collection Date
Mean Daily Discharge (cfs) * (10 year median)
Mean Daily Air Temp * (°F)
Average Daily Precipitation (Inches)
SWI
Evenness
Summer Season MD-07c 15 September 2007 10%–20% 72 0.15 4.2 0.85 MD-07f 15 September 2007 10%–20% 72 0.15 4.0 0.87 MD-08c 20 June 2008 198 (223) 78 0.12 4.4 0.87 MD-08f 20 June 2008 198 (223) 78 0.12 4.2 0.86 BD-07f 15 September 2007 10%–20% 72 0.15 4.0 0.91 BD-07f2 15 September 2007 10%–20% 72 0.15 3.7 0.89 BD-08c 25 June 2008 14 (24) 79 0.12 3.6 0.85 BD-08f 25 June 2008 14 (24) 79 0.12 3.9 0.85 CD-07f 10 July 2007 2.5 (2.2) 80 0.15 4.1 CD-08c 11 June 2008 2.8 (2.8) 76 0.11 4.0 0.84 Fall Season MW-08c 21 November 2008 ** 51 0.11 4.0 0.91 MW-08f 19 December 2008 ** 42 0.09 4.3 0.91 BW-08c 3 December 2008 74 (40) 47 0.11 3.7 0.92 BW-08f 1 November 2008 29 (33) 56 0.10 3.7 0.88 CW-08c 17 November 2008 3.1 (2.8) 52 0.10 3.5 0.88 CW-08f 19 December 2008 2.9 (2.9) 42 0.09 4.1 0.92 *: Mean daily discharge and air temperature based on NCDENR 2009, NC Climate Office, 2003–2012 [15,16]. **: Within median value.
2.3. Stable Isotope Analysis Stable isotope analyses were conducted on sediment core samples collected concurrently with microbial sediment analysis. Natural abundant isotopes (i.e., nitrogen) provide a time- integrated signal related to sediment biota and ambient surface water nitrogen levels [17,18]. The natural abundance of heavy stable isotopic nitrogen ( 15 N) becomes enriched by repeated exposure of high nitrate concentrations from agricultural fertilizers, municipal wastewater, animal waste and residential septic
Diversity 2014, 6
22
systems [19,20]. The sediment collected using a coring device was processed for 15N and 13 C values. Prepared samples were combusted in a Carlo Erba NC 2500 elemental analyzer (CE Instruments, Milan, Italy) and the N 2 peak was injected into a Finnegan Mat Delta + XLS continuous flow isotope ratio mass spectrometer (CFIRMS, Bremen, Germany). The 15 N of sediment were reported, using notation, in per mil (‰) deviations from atmospheric nitrogen using the convention: 15 N (‰) = [(15 N:14N sample/15 N:14 Natm N2 ) − 1] × 103 . The 13 C of the sediment was analyzed in a similar fashion. Results were determined from sample weights and integrated peak areas calibrated against international laboratory standards [21]. 2.4. Statistical Analyses To test for significant differences among bacterial taxonomic groups by season (wetter/cooler vs. drier/warmer) site, and sediment size (c = coarse vs. f = fine), a non-parametric analysis of similarly (ANOSIM) was used [22]. The T-RFLP raw data was imported into the Primer V.6 software package (Primer-E Ltd, Lutton, UK), and a similarity matrix was calculated using the Bray Curtis similarity coefficient. A multidimensional scaling (MDS) procedure was used to ordinate the similarity data. A one-way analysis of similarity (ANOSIM) was then used to examine the statistical significance of differences among microbial taxonomic groups by season and sediment size. The ANOSIM reports include R-statistics and p-values. An R statistic close to 1 indicates that samples in the same group are more similar to each other than samples in different groups. An R-statistic close to 0 indicates that samples in the same group are not more similar to each other than samples in different groups. The p value reflects the statistical significance of the R-statistic. Subsequently, a principle component analysis (PCA) was used to visualize the T-RFLP similarity data. The T-RFLP data was transformed into mean % values and graphically represented by sediment size and season. An analysis of variance (ANOVA) procedure was used to evaluate relationships among sediment isotope values ( 15 NSED and 13 CSED) and sampling site. For these analyses, Post hoc comparisons tests were performed using a Bonferroni pairwise correction method, when a significant interaction effect was observed [23]. 2.5. Microbial Analyses—DNA Extraction and Quantification The DNA extractions were made from a composite of replicate sediment samples. Samples were thawed and 250 mg were obtained for gDNA extraction using the PowerSoilT M DNA isolation kit (MoBio Laboratories, Inc., Solana Beach, CA, USA) according to the kit protocols. All samples underwent a 4× extraction and were then passed over the same DNA binding filter and eluted with 50 µL of elution buffer from the MoBio kit (Solana Beach, CA, USA). For each replicate, sediment samples were pooled to improve the probability of PCR amplification and stored in −20 °C until microbial DNA extraction. Comparative analysis of the bacterial diversity in surficial sediment was performed by using 16S rDNA sequences and T-RFLP analysis.
Diversity 2014, 6
23
2.6. PCR Amplification of 16S rDNA The T-RFLP analysis of the sediment was as previously described [2,24], with some modifications. Briefly, the isolated gDNA was amplified using the bacterial specific 16S rDNA primers 8F (′5-AGAGTTTGATC (A/C) TGGCTCAG-3′) and 1492R (′5-GGTTACCTTGTTACGACTT-3′). Each PCR reaction consisted of 25 µL, containing 1.25 µL (100 nM) labeled forward primer, 1.25 µL (100 nM) labeled reverse primer, 12.5 µL Taq polymerase (Qiagen, Inc., Valencia, CA, USA) including dNTPs, 9 µL PCR grade water, and 1 µL DNA template. Each PCR test was performed with duplicate samples using an ABI 9700 thermal cycler (Applied Biosystems, Oslo, Norway). Reaction mixtures were held at 94 °C for 120 s, followed by 25–30 cycles of 94 °C for 60 s, 50 °C for 60 s, and 72 °C for 120 s with a final extension of 72 °C for 9 min. One microliter of each PCR reaction was run on a 1% agarose gel at 120 volts for 20 min to verify amplification of microbial 16S rDNA sequences. 2.7. Restriction Enzyme-Digest of PCR Products The PCR reactions for composite sediment samples were purified using the UltraClean™ PCR Clean- up Kit (MoBio Laboratories, Inc., Solana Beach, CA, USA) and were visualized on a 1% agarose gel. The HhaI reaction required the addition of 1 μL of 100× Bovine Serum Albumin (BSA). The PCR products were then digested in three separate reactions. Each contained at least 15 μL of the purified PCR reaction, 74 μL of PCR grade water, 1 μL of one of three enzymes: RsaI, MspI, or HhaI, and 10 μL of its corresponding buffer. The restricted DNA fragments were purified using the QIAquick Nucleotide Removal Kit (Qiagen, Inc., Valencia, CA, USA) and were eluted into 50 μL of heated PCR grade water. Thirty microliters of each sample were placed in 1.5 mL microcentrifuge tubes, which were wrapped in parafilm and stored at −80 °C until shipped to the Genomic Technology Support Facility at Michigan State University for analysis on an Applied Biosystems Prism 3100 Gene Analyzer (Applied Biosystems, Foster City, CA, USA). The resulting fragment patterns were analyzed using the In Silico software package (In Silico LLC, Fuquay-Varina, NC, USA). 2.8. Analysis of T-RFLP Data Taxonomic assignment was made using In Silico’s taxonomic assignment too l as previously described [25,26]. We used a single- value diversity index (In Silico LLC, Fuquay-Varina, NC, USA) for the T-RFLP analysis to calculate a Shannon-Weaver index (H′), Simpson diversity (reported as 1-D), the reciprocal Simpson (1/D), and evenness (E) [27,28]. For calculation of the indices, the T-RFLP analysis peak area was used as the amount and its relative abundance was measured by dividing individual peaks by the total fluorescence of the sample. The results for each diversity measure are representative of the number of fragments in each stream sediment sample. Mean percentage of each taxa from T-RFLP analysis were reported by site, seasonal collection period and sediment size.
Diversity 2014, 6
24
3. Results 3.1. Microbial Structure Taxonomic microbial classification of observed OTU (operational taxonomic unit) patterns was evaluated for all sites using the non-parametric ANOSIM procedure. Percent class abundance of twenty-six bacterial classes from different phyla were graphically represented as OTUs based on the 16S rDNA gene libraries from all sites sampled from the In Silico output (Figure 2). This method was used to represent microbial class patterns by each site with respect to season and sediment size (Figures 3–5). Figure 2. Percent abundance of bacterial class presented from all three sites. The x axis are sample site abbreviations that correspond to the naming co nvention in Table 1 (M = Marks Creek, B = Bear Creek, C = Crabtree Creek, W = wet; D = dry. Numeric code is the year of collection. Lower case letters depict sediment size; c= coarse; f = fine).
The most prevalent group represented among all three stream sites regardless of season and sediment size was Gamma-proteobacteria. This group represented 34% of the microbial community in sediment samples obtained from Bear Creek, 30.4% from Crabtree Creek (30.4%) and 27% from Marks Creek.
Diversity 2014, 6 Figure 3. Bear Creek mean % values of OTU matches for bacterial class represented by sediment size and seasonal sampling period.
Figure 4. Marks Creek mean % values of OTU matches for bacterial class represented by sediment size and seasonal sampling period.
Figure 5. Crabtree Creek mean % values of OTU matches for bacterial class represented by sediment size and seasonal sampling period.
25
Diversity 2014, 6
26
Actinobacteria was the second most prevalent group observed in the sediment among all sites (Bear 13.6%; Crabtree 13.7%; Marks 20.5%), with greater occurrence in the wet compared to the dry season. Bear Creek showed a higher portion of Actinobacteria in the wetter (26%) compared to the drier (12%) sampling period. Furthermore, Gamma (22% vs 36%), Alpha (4% vs 11%) and Beta (4% vs 19%) Proteobacteria were less prevalent at Bear Creek in the wetter season when compared to the drier period. Conversely, Delta-proteobacteria was more prevalent at Bear Creek in the samples obtained during the wetter season (11% vs 4%). Across all sites, the proportion of sediment samples comprised of Alpha-proteobacteria was higher during drier (10%–15%) periods than during the wetter (