MARINE ECOLOGY PROGRESS SERIES Mar Ecol Prog Ser
Vol. 465: 137–153, 2012 doi: 10.3354/meps09897
Published September 28
Seasonal variation in effects of multiple predators on an intertidal mussel bed: implications for interpretation of manipulative experiments Melanie R. Boudreau*, Diana J. Hamilton Department of Biology, Mount Allison University, Sackville, New Brunswick E4L 1G7, Canada
ABSTRACT: The outer Bay of Fundy, Canada, hosts rocky intertidal communities often dominated by beds of blue mussels Mytilus edulis, which support vertebrate and invertebrate predators at different times of the year. Strong predation by ducks in this system opens the possibility of a trophic cascade whereby ducks substantially reduce mussel density, opening space for other species. However, previous work has shown no long-term cascading effect; dogwhelks Nucella lapillus appeared to compensate for duck exclusion by consuming excess mussels. To quantify this compensation, the related effects of other invertebrate predators and the temporal effects on predation, we conducted 2 exclosure experiments in Passamaquoddy Bay, St. Andrews, New Brunswick, Canada, which were initiated at different times, one in spring and the other in fall. Exclosures excluded ducks and allowed variable access to different invertebrate predators within the community. As predicted, ducks had a substantial effect in both cases, reducing mussel density in areas where they could feed. The timing of duck exclusion was crucial in determining the outcome of experiments. When ducks were excluded before their fall migration, the full range of mussel sizes remained present within the system and whelks congregated in exclosures, compensating for duck exclusion. When exclosures were set up after duck foraging had commenced, the remaining mussels were generally larger. In this case, green crabs Carcinus maenas compensated but whelks did not. We recommend that researchers carefully consider the timing of manipulative studies to ensure that results are not artefacts of seasonal variation in predator activity. KEY WORDS: Temporal effect · Compensation · Trophic cascade · Blue mussel · Common eider · Dogwhelk · Green crab Resale or republication not permitted without written consent of the publisher
Understanding the role of biological interactions, such as predation and competition, in community dynamics is a fundamental part of ecological research (Paine 1966, Connell 1972, Wootton 1992, Wood et al. 2010). In rocky intertidal communities, invertebrate (Paine 1966, Robles & Rob 1993, Navarrete & Menge 1996, Mowles et al. 2011) and vertebrate (Hamilton 2000, Ellis et al. 2007, Freudendahl et al. 2010) predators can have important effects on community structure. Details of these effects are not always easy to identify in a field setting; species interactions can
alter the overall effects of a species and complicate their measurement (Dungan 1986, Trussell et al. 2003, Quinn et al. 2012). Further, interactions may be subtle and therefore hard to detect via experimental manipulation (Dungan 1986, Menge 1995). When the abundance of one species changes, other species sometimes take over its functional role within the community. This capacity to compensate buffers against wholesale community-wide changes, and is hypothesized to be central to the link between ecosystem complexity and stability (e.g. Tilman et al. 1998, Pace et al. 1999, Hamilton et al. 2006, Sasaki and Lauenroth 2011). However, inter-
*Email:
[email protected]
© Inter-Research 2012 · www.int-res.com
INTRODUCTION
138
Mar Ecol Prog Ser 465: 137–153, 2012
actions among species can affect the capacity of particular species to compensate because effects of multiple predators are frequently not additive (e.g. Quinn et al. 2012). The outer Bay of Fundy in eastern Canada hosts rocky intertidal communities that are often dominated by blue mussel Mytilus edulis beds. These beds also provide secondary space for other species such as acorn barnacles Semibalanus balanoides, gastropods, green sea urchins Strongylocentrotus droebachiensis, a variety of subsurface bivalves, polychaetes and several types of amphipods and isopods (Hamilton 2000). Associated with these areas are several predators including green crabs Carcinus maenas, sea stars Asterias spp., dogwhelks Nucella lapillus and diving sea ducks (primarily common eiders Somateria mollissima, and several species of scoters Melanitta spp.). Previous work in the Bay of Fundy suggests that intense predation by ducks can have a strong top-down effect on abundance of their main prey, the blue mussel (Hamilton 2000). However, unlike in the Pacific Northwest of North America, where trophic cascades resulting from predation by sea stars Pisaster ochraceus are well documented (Paine 1966), community-level effects by ducks in the Bay of Fundy have been less well studied. Although the effect of duck exclusion was initially strong, Hamilton (2000) found that dogwhelks appeared to compensate for the loss of eider predation (sensu Navarrete & Menge 1996) by congregating in areas where ducks were excluded and consuming excess mussels. However, this relationship is poorly understood. Interactions between predators may affect the overall degree of compensation in this system. Direct interactions include intra-guild predation on whelks by ducks (Hamilton 1997) and on whelks by crabs (Crothers 1968, Navarrete et al. 2000), as well as intraspecific (Hughes & Dunkin 1984, Gaymer et al. 2004, Smallegange et al. 2006) and interspecific (Navarrete et al. 2000, Trussell et al. 2003, Aschaffenburg 2008) interference competition between the invertebrate predators. Indirect interactions include exploitative competition and various trait-mediated indirect interactions (Navarrete et al. 2000, Trussell et al. 2003) such as chemical risk cues. Facilitative interactions whereby whelks facilitate the foraging rates of crabs (M. L. Boudreau 2011, Quinn et al. 2012, Wong et al. 2012) and conspecifics (Hughes & Dunkin 1984) may complicate these interactions further. Furthermore, whelks may not be the only invertebrate predator able to compensate for eider exclusion within these communities.
Additionally, abundance of different predators in this system varies with time of year. Invertebrate predators are abundant during the summer months (May to September) while water temperatures are optimal for feeding (Mackenzie 1969, Stickle & Bayne 1987, Baldridge and Smith 2008). In contrast, diving ducks are predominant during the fall migration (September to November). Because responses of predators to manipulative experiments may depend on initial conditions (Drake 1990, Schröder et al. 2005), and initial conditions can vary temporally with environmental conditions (particularly in strongly seasonal environments) and predator activity, temporal effects may have a large influence on the outcome. Temporal effects have been documented in other areas of study such as physiology (Page et al. 2011), have been touched on in theoretical literature (Drake 1990, Underwood et al. 2004, Schröder et al. 2005), and have been highlighted as an important consideration in field experiments (e.g. Tilman et al. 2006, Wood et al. 2010), but to our knowledge have not been explicitly considered within intertidal communities. This is an important knowledge gap, particularly in communities where predators differ seasonally in their respective densities and feeding rates. We extended the work of Hamilton (2000) by conducting a predator exclusion experiment to test the hypothesis that the capacity of multiple invertebrate predators to compensate for duck exclusion will be negatively affected by interactions between predators. We predicted that ducks would have a large topdown effect, decreasing mussel density significantly in areas where they could feed, that whelks should be able to compensate for duck exclusion by congregating and consuming excess mussels, and that negative interactions with other invertebrate predators would alter the degree of compensation. To test the hypothesis that experimental timing can affect the outcome, and thus interpretation, of such experiments, we also initiated our experiments at 2 different times — one when invertebrates were active but ducks were largely absent (May), and the other when ducks were present and invertebrates inactive due to cooler water temperatures (September).
MATERIALS AND METHODS Study site Field work was conducted in Passamaquoddy Bay in the outer Bay of Fundy near Pagan Point, St. Andrews, New Brunswick, Canada (45° 4’ 26.51” N,
Boudreau & Hamilton: Predation in an intertidal mussel bed
139
Fig. 1. (A) Study site (arrow) in Passamaquoddy Bay, at St. Andrews, New Brunswick, Canada (45° 4’ 26.51” N, 67° 2’ 11.59” W). (B) Approximate location of blocks within the mussel bed. M1 to M8: blocks set up in May 2009; S1 to S5: blocks set up in September 2009. All blocks were within 30 m of the mean low water line. (C) Example of cage placement within a block. See ‘Materials and methods: Experimental design’ for abbreviations. Dashed line: no exclosure. Diagrams in B and C are not to scale. (D) Full exclosure (1.2 × 1.2 × 0.3 m)
67° 2’ 11.59” W) (Fig. 1A). We worked in a naturally occurring mature mussel bed found in the intertidal zone near the mean low water tide line (1.1 to 1.3 m above chart datum). The substrate was primarily sandy with cobble and some larger rocks. Tides in this part of the bay rise and fall by 5.8 to 7.9 m. During neap tide, the study site remained under water, whereas during spring tide the site was exposed for ~3 h on each tidal cycle. The site is mildly to moderately exposed to wave action. Water temperatures during the study ranged from a minimum of 1°C in January to a maximum of 15.4°C in August (measured by iBCod 22L Temperature Loggers [Alpha Mach] located in the study area throughout the experiment). Air temperatures in this region range between an average high temperature of 25.4°C during the hottest months of the year (July and August) and an average low temperature of −12.4°C during the coldest months of the year (January and February) (2009 and 2010 data for St. Stephen, NB; Environment Canada Weather Records, www.climate. weatheroffice.gc.ca/climate_normals/index_e.html).
Predator foraging techniques Predator foraging methods are quite distinct within these communities. Diving ducks consume mussels by bringing them to the surface and swallowing them whole, crabs chip and crush the outer shell to gain ac-
cess to the tissue inside, sea stars pry mussels open, and whelks take 2 to 3 d to select suitable mussel prey, after which they drill into the shell and consume the flesh through the secretion of digestive enzymes, a process which takes about 2 to 4 d to complete.
Experimental design To test the effects of predator exclusion on the mussel bed community, we made predator exclosures of acrylonitrile butadiene styene pipe that measured 3.8 cm in diameter. Exclosures were 1.2 m wide × 1.2 m long × 0.3 m high and were placed in relatively homogeneous areas within the mussel bed. Cages were anchored with wooden stakes driven into the sediment. Exclosures had a detachable top with a bamboo frame. Mesh measuring 25 or 5 mm was used on exclosures as appropriate (see next paragraph) and mesh sides were dug into the sediment in treatments where sides were used (e.g. Fig. 1D). Eight replicate experimental blocks were set up in late May 2009 (hereafter referred to as the spring experiment; Fig. 1B) when invertebrate predation was predominant and duck predation was low. Blocks were positioned throughout the mussel bed in homogeneous areas to minimize within-block variation in starting conditions. Differences in exposure and submersion times were less than 20 min between the lowest and highest blocks, and less than 5 min
Mar Ecol Prog Ser 465: 137–153, 2012
140
within each block. Predator treatments were placed 2 m apart in a staggered formation to minimize the potential effects of one exclosure on another (e.g. effects on water flow) (Fig. 1C). The different treatments were randomly placed within each block and included a full exclosure (FE), a duck exclosure (DE), a sea star and crab exclosure where only whelks could feed (WO), a cage control (CC) and an open control area (O) (Fig. 1C). Full exclosures had 5 mm mesh covering the top and all sides. Duck exclosures had 25 mm mesh covering only the top. Ducks do not dive under such structures (Hamilton 2000), so only invertebrate predators foraged in these areas. Sea star and crab exclosures had 25 mm mesh covering the top and all sides. Most adult whelks are < 25 mm wide and crabs and sea stars that are capable of consuming adult mussels are larger, so only whelks could enter these areas and have an effect on the mussel population. Cage controls had 5 mm mesh covering the top and the 2 sides facing the incoming tide. We selected the smaller mesh as it was more likely to reveal effects on water flow and light levels if they exist (Miller & Gaylord 2007). Open control areas where all predators could feed were marked by corner stakes and were the same size as exclosures. To assess the effect of different experimental timing and seasonality on our results, 5 additional blocks were established in late September 2009 (hereafter referred to as the fall experiment; Fig. 1B). At this time, duck predation was high and invertebrate predation was low. Both experiments ran until the end of September 2010.
Data collection Cage checks Cages were checked 2 to 3 times per week from May to December and every second week from December to April. When necessary, cages were cleaned and repaired. Predators that entered cages from which they had been excluded were removed and the number was recorded. When exclosures were lost they were replaced as soon as possible. This occurred 5 times between October 2009 and April 2010 during inclement weather. In March 2010, a major disturbance pulled 19 cages out of position. Replacement exclosures were quickly constructed and replaced within 5 d of disturbance. Areas where exclosures had been prior to the disturbance were easily identifiable due to the fact that there was substantial reduction of mussel
cover around the exclosures and some of the attachment stakes remained. Also, duck predation at this time was low (see Fig. 2), invertebrate predators were absent (see ‘Results: Predator density’), and there were no visible changes in mussel cover from before to after the event (M. R. Boudreau pers. obs.). We are therefore confident that this disturbance did not affect results.
Exclosure sampling We collected samples in May, June, July, September, October (fall experiment only) and November 2009, and in March, May, July and September 2010. Samples were collected from each exclosure and control area using a 1 m2 quadrat that was subdivided into one hundred 100 cm2 areas. The quadrat was laid in the centre of each treatment so that a buffer zone of 10 cm, from which we never sampled, remained around all sides. For each exclosure or control area, 2 randomly selected 100 cm2 areas within the quadrat were sampled by removing all animals on the surface and 3 cm into the sediment. Removed material was replaced by a similar quantity of mussels and other organisms from the surrounding area. This was done to maintain similar mussel density within treatments as density can substantially alter the growth rate of mussels (Seed 1968, Lauzon-Guay et al. 2005), which in turn could affect predation rates. The same 100 cm2 area was never sampled twice, so these replacement mussels were not sampled in subsequent months. Each sample was sieved using an 850 µm sieve and contents were stored in 95% ethanol. Samples were later sorted and mussels in each sample were counted, measured and placed into size classes. Mussels, kept in separate size classes, were dried for 24 h at 90°C, weighed, ashed at 550°C for 2 h and reweighed. Before drying, mussels > 5 mm in length were removed from shells whereas mussels < 5 mm long were dried and ashed intact. Edible biomass was determined as ash-free dry tissue mass, calculated as dry tissue mass − ashed mass.
Predator density Using a spotting scope (Bushnell Elite 20−60 × 80 mm 45°), we counted all ducks at our study site 2 to 3 times per week during summer and almost daily during fall. Counts were also made at least twice monthly during winter to monitor the resident duck
Boudreau & Hamilton: Predation in an intertidal mussel bed
population. In all cases, ducks were identified to species and individuals counted across a broad area in front of Pagan Point and the adjacent Indian Point (~12 km2). Only ducks present in the cove that contained the experimental area were considered to be feeding near our exclosures. To assess invertebrate predator density at low tide, we counted whelks in each exclosure and control area every other week (beginning 2 wk after initial set up). Crabs and sea stars either find shelter in rockweed beds or retreat to subtidal areas to avoid desiccation (Petes et al. 2008, Ameral et al. 2009) at low tide, so they were not included in these counts. However, we also assessed invertebrate predator density along 30 m transects every 2 mo from May to November 2009 and monthly from May to September 2010. Transects were set parallel to the water line within the mussel bed and within an adjacent rockweed bed. Two transects were used for each area, one ~5 m and one ~25 m from the mean low water line. All predators within 10 cm of the transect line were counted and measured to obtain an estimate of predator density and size in the area.
Diving duck diet Stomach contents were assessed by dissecting common eider specimens donated by local hunters. Eighty-four eiders were examined in fall 2009 and 56 in fall 2010. Digestion was halted as soon as eiders were collected by injecting 10 ml of 95% ethanol through the beak into the digestive tract (J. M. DeVink pers. comm.). Eiders were then weighed, sexed, and the gizzard and the proventriculus were dissected out. Contents were preserved in 95% ethanol for later analysis. During sorting of digestive contents, species were identified and counted where possible. If only mussel chips were present, we recorded 1 mussel as being present. If umbos (mussel hinge) or whole mussels were present then we could count individuals. We identified umbos as left or right and then counted the number of each. Whichever number was larger was taken as the number consumed to avoid counting the same mussel twice. For periwinkles and whelks, if only chips were present we recorded 1 snail as being present, but the presence of a columella (central axis of the shell) allowed us to count individuals. Urchin spines or pieces of the test were present in samples but no whole urchins were found. Polychaete body pieces, sea star arms, crab legs, barnacle pieces and small clams were also present. The proportion each
141
species contributed to the diet was calculated for each eider and then averaged for all ducks. Using previously collected mussels, we determined the relationship between umbo length (measured from the point to the inside lip of the hinge) and mussel length using linear regression. The regression yielded the relationship: shell length = umbo thickness0.314 × 101.591 (F1, 424 = 1188.3, p < 0.001, r2 = 0.74). Mussel length was then calculated for the right umbos found in stomach contents.
Assessment of cage effects To assess the effects of caging material on water flow we used a plaster dissolution method (Jokiel & Morrisey 1993) once in summer and again in fall 2009. Dissolution standards were created by inserting a piece of metal wire into half-spheres of plaster. These were then dried at 90°C for 24 h, weighed and hung in each treatment of 6 randomly selected blocks in summer and in fall. Standards were left in the field for 24 h, collected, dried for 24 h at 90°C and then reweighed. Water flow is predicted by plaster dissolution rate (Jokiel & Morrisey 1993), so if cages reduced water flow, mass lost from plaster balls should have been reduced. To test the effects of mesh tops on the interior of exclosures, light levels were measured with a lux meter (Mastech Digital Illuminance/Light Meter LX1330B, 0−200 000 lx Luxmeter). This was carried out on a cloudy day and a sunny day, in summer and fall, for each year in the spring experiment. Light measures were taken in the cage controls (5 mm mesh), duck exclosures (25 mm mesh) and open control areas (no mesh). Finally, to test the effects of caging on predator abundance and subsequent predator effects on the community, number of invertebrate predators and mussel abundance in cage controls were compared with duck exclosures as both of these treatments excluded ducks but offered free access to invertebrates.
Statistical analyses Data were analysed using PASW 17 (SPSS 2009) and SAS version 9.1 (SAS Institute 2004). Homogeneity of variance was assessed using Cochran’s test. Normality was assessed using the KolmogorovSmirnov test and by visual examination. When appropriate, sphericity was assessed using Mauchly’s test. Percent data were arcsine square root trans-
Mar Ecol Prog Ser 465: 137–153, 2012
142
Table 1. Error terms (denominators for F-ratios) associated with each factor tested in the randomized block ANOVAs, the multivariate ANOVAs (MANOVAs) and linear mixed models used in this paper. Month refers to individual sampling periods. Block is a random factor; all others are fixed. For the split-plot (repeated measures) models comparing spring and fall experiments, an additional fixed factor Experiment was added, and Block was nested under Experiment. In that case, the Treatment × Experiment interaction reported in the text was tested over Treatment × Site(Experiment). MSe: mean square error Factor
F-ratio
Month Treatment Block Month × Treatment
MSMonth/MSMonth × Block MSTreatment/MSTreatment × Block MSBlock/MSe MSMonth × Treatment/ MSMonth × Treatment × Block MSMonth × Block/MSe MSTreatment × Block/MSe MSMonth × Treatment × Block/MSe
Month × Block Treatment × Block Month × Treatment × Block
formed prior to analysis (Zar 1999). When necessary, data were transformed to meet assumptions of parametric tests. In some cases, violations of normality could not be corrected, primarily because of mussel bed patchiness. In those cases results were interpreted with caution. Results were evaluated at α = 0.05 for main effects, and interactions with a p-value < 0.1 were investigated to ensure that main effects were not inappropriately interpreted in the presence of a possible interaction. For all analyses, except the split-plot univariate ANOVA assessing effects of start date on results, Month (of sampling) and Treatment were fixed factors and Block was a random factor. Appropriate error terms for each analysis are provided in Table 1. Water flow, light levels, mussel biomass and density were analysed using a randomized block ANOVA. If an interaction was present, separate analyses were conducted for each sampling month (Keppel & Wickens 2004, Pallant 2007). Tukey’s honestly significant difference (HSD) post hoc tests were used to isolate the differences among treatments. A multivariate ANOVA (MANOVA) was used to determine the effects of the different predator exclusion treatments and sampling month on the distribution of mussels in several different size classes. Only adult size classes were used as small mussels (< 20 mm) were not abundant throughout the experiments. Size classes were condensed to minimize zeros and avoid violation of assumptions. This gave 2 dependent variables for each experiment (spring experiment: 20−35 and > 35 mm; fall experiment: 30−45 and >45 mm). Significance was evaluated
using Pillai’s trace, the most robust of the available multivariate test statistics (Scheiner 2001). When significant results were detected, a canonical analysis was performed and canonical coefficients were examined to determine which dependent variable contributed most to the multivariate result (Scheiner 2001). The size class that contributed most was then analyzed separately using a randomized block ANOVA. If an interaction was present, separate analyses were conducted for each treatment. Linear mixed models, employing a restricted maximum likelihood approach, were used to determine the effects of Treatment and Month on whelk density. These models take into account the repeated measures structure of the data and allow for selection of a residual covariance structure that best fits the data (Tabachnick & Fidell 2007). This makes the use of linear mixed models more appropriate than ANOVA in cases where assumptions are likely to be violated. Several possible models with different covariance structures were run, and among those that converged, Akaike’s information criterion model selection was used to choose the most appropriate model. The best model for whelk density in the spring experiment used the AR1 covariance structure, and the fall experiment used the scaled identity covariance structure. For both data sets, when an interaction was detected, separate analyses were conducted for each sampling month. Split data required the use of the scaled identity covariance structure. Bonferroni post hoc tests were used to isolate the differences among treatments. To directly assess the effect of start date on results, we took 2 approaches. First, to examine how timing would affect results in experiments of equal duration, we compared mussel density in the 6th and 12th months of both experiments (November 2009 and May 2010 of the spring experiment, and March and September 2010 of the fall experiment). Second, to compare compensatory responses in the 2 experiments, we compared May and September 2010 mussel densities from each experiment. In both cases we used a split-plot (repeated measures) ANOVA with Treatment and Month as fixed within-subjects factors, Experiment as a fixed between-subjects factor and Block as a random factor nested under Experiment. Statistical power was assessed following Zar (1999). For non-significant results, we determined the effect size that would have been detectable with power at a range of levels using existing replication and variance. Unless otherwise indicated in results, power was generally acceptable for overall models (70 to 80% power to detect differences of 25 to 40% among
Boudreau & Hamilton: Predation in an intertidal mussel bed
treatment means). Power was lower and more variable when data were analysed separately by month or treatment, ranging from 70% power to detect a 36% difference to 50% power to detect an 80% difference. Instances in which low power should be noted are indicated.
143
in whelks where only they could feed did not occur (Fig. 3). The only observed difference was in October 2009, in which there were more whelks in duck exclosures than several of the other treatments (Table 4). There were no whelks present within treatments during winter months (January to April) for either experiment.
RESULTS Predator intrusion into exclosures Cage effects Over the course of both experiments, 2 crabs, 6 sea stars and 466 whelks were found in cages from which 250
A
200
Duck abundance
There were no significant differences between treatments in water flow in either summer (F3, 7 = 1.17, p = 0.36) or fall (F3, 7 = 0.66, p = 0.63). There was a significant effect of Treatment on light levels in all seasons for both cloudy (F3, 7 = 27.80 to 236.48, p < 0.001) and sunny days (F3, 7 = 23.37 to 91.04, p < 0.001). The small mesh reduced light levels by 31.4 ± 0.2% (mean ± SD) on sunny days and by 29.4 ± 0.3% on cloudy days. The large mesh reduced light levels by 22.2 ± 0.2% on sunny days and by 18.5 ± 0.2% on cloudy days. Mussel and whelk densities were never significantly different from each other between duck exclosures and cage controls (spring experiment: mussels F1, 7 = 0.002, p = 0.97, whelks F1, 7 = 1.52, p = 0.27; fall experiment: mussels F1, 4 = 0.58, p = 0.49, whelks F1, 4 = 2.25, p = 0.21).
150
100
50
0
May Jul Sep Nov Jan Mar May Jul Sep
2009 Predator density
2010
20
B Crab
Predator density (ind. m–2)
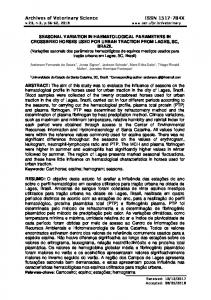
Diving ducks were not common in the experimental area during summer (June to August 2009 and 2010), were abundant during fall 2009, and a small population persisted over winter (Fig. 2A). Crabs and whelks were most abundant during mid-summer in 2009 and 2010 (Fig. 2B). Although sea stars were present in the area (M. R. Boudreau pers. obs.), it was not possible to quantify their presence in our experimental area as they retreated subtidally during low tide. Effects of predator treatment on density of whelks in the experimental area varied with Month for both experiments (Tables 2 & 3). In the spring experiment, treatment effects appeared in July and November 2009 (though the latter was tied to zero whelks in all except a few exclosures and is not biologically meaningful), and most notably in May through September 2010 (Table 4), during which time whelks were more abundant in whelk-only cages than in duck exclosures (early summer) and open areas (June onward) (Fig. 3). In the fall experiment, this summer increase
Whelk
15
10
5
0
May Sep Nov May Jun
2009
Jul
Aug Sep
2010
Fig. 2. (A) Mean (± SE) diving duck (Somateria mollissima and Melanitta spp.) abundance over time in the study area (0.25 km2). (B) Mean (± SE) density of green crabs Carcinus maenas and whelks Nucella lapillus from transects in rockweed areas adjacent to the study site. Data from rockweed transects are presented to allow comparison between whelks and crabs, because crabs are only found in these areas at low tide
144
Mar Ecol Prog Ser 465: 137–153, 2012
Table 2. Results of randomized block ANOVAs for each of the variables analysed for the spring experiment. Bold: significant (p ≤ 0.05) and interpretable (e.g. not part of an interaction) effects. Appropriate error terms for each factor are listed in Table 1. Mean squares for whelk density were not available because these data were analysed using a linear mixed-model analysis that uses an iterative restricted maximum likelihood approach. F-values for that model are approximate unbiased estimates. df1 and df2 refer to numerator and denominator degrees of freedom in each F-ratio Dependent variable
Source of variation
MS factor
MS error
df1, df2
F
p
Mussel biomass
Month Treatment Month × Treatment Month Treatment Month × Treatment Month Treatment Month × Treatment Month Treatment Month × Treatment
2.02 × 10⁵ 1.26 × 10⁴ 6.32 × 10⁴ 1.03 × 10⁶ 2.35 × 10⁶ 3.23 × 10⁵ 2.75 × 10⁵ 1.10 × 10⁶ 1.64 × 10⁵
9.05 × 10⁵ 7.70 × 10⁴ 6.67 × 10⁴ 1.13 × 10⁵ 1.00 × 10⁶ 9.84 × 10⁴ 7.16 × 10⁴ 3.80 × 10⁵ 5.52 × 10⁴
8, 56 3, 21 24, 168 8, 56 3, 21 24, 168 8, 56 3, 21 24, 168 12, 146.95 2, 84.91 24, 146.74
2.23 0.17 0.95 9.07 2.35 3.28 3.84 2.90 2.97 18.07 23.31 2.94
0.04 0.92 0.54 < 0.001 0.10 < 0.001 0.001 0.06 < 0.001 < 0.001 < 0.001 < 0.001
Mussel density
Adult mussel size distribution Whelk density
Table 3. Results of randomized block ANOVAs for each of the variables analysed for the fall experiment. Bold: significant (p ≤ 0.05) and interpretable (e.g. not part of an interaction) effects. Appropriate error terms for each factor are listed in Table 1. Mean squares for whelk density were not available, as in Table 2 Dependent variable
Source of variation
MS factor
MS error
df1, df2
F
p
Mussel biomass
Month Treatment Month × Treatment Month Treatment Month × Treatment Month Treatment Month × Treatment Month Treatment Month × Treatment
1.86 × 10⁵ 2.39 × 10⁵ 4.04 × 10⁴ 2.74 × 10⁵ 2.61 × 10⁶ 1.44 × 10⁵ 2.37 × 10⁵ 5.12 × 10⁵ 8.68 × 10⁴
2.35 × 10⁴ 1.45 × 10⁴ 1.58 × 10⁴ 1.48 × 10⁵ 3.12 × 10⁵ 8.48 × 10⁴ 4.79 × 10⁴ 4.73 × 10⁴ 2.67 × 10⁴
6, 24 3, 12 18, 72 6, 24 3, 12 18, 72 6, 24 3, 12 18, 72 7, 104 2, 104 11, 104
7.95 16.44 2.57 1.85 8.37 1.69 4.95 10.83 3.25 10.29 5.12 1.80
< 0.001 < 0.001 0.003 0.13 0.003 0.06 0.002 0.001 < 0.001 < 0.001 0.008 0.04
Mussel density
Adult mussel size distribution Whelk density
they had been excluded. Thus, crab and sea star incursions were negligible. For whelks in the spring experiment, an average of 56 whelks per exclosure entered the experiment over the entire duration, or 6 per month during the period when whelks were active. For the fall experiment, the rate was much lower, with only 3 whelks per exclosure entering, or one every other month during active periods. All of these animals were removed immediately, but to assess the potential effect on results of whelks accessing full exclosures, we recorded whelk behaviour and position within the exclosure in the second year of study. Whelks were rarely observed foraging (14% of instances; 35 out of 230 whelks observed); 97% of those times they foraged around the sides or corners of the exclosure in the buffer zone where sampling did not occur.
Diving duck diet On a per-prey-item basis, Mytilus edulis was the most important prey for common eiders, making up 70% of the diet (Table 5). Ducks also consumed dogwhelks, periwinkles, urchins, polychaetes, clams, crabs and sea stars (Table 5). The mean (± SD) size of mussels eaten by common eiders was 28.3 ± 17.5 mm (range 3.5 to 50.7 mm).
Predator exclusion effects Spring experiment Biomass of Mytilus edulis varied among months in the spring experiment (Table 2). However, in post
Boudreau & Hamilton: Predation in an intertidal mussel bed
Table 4. Results of the linear mixed models for effects of predator treatment on whelk density. Each month was analysed separately based on a Month × Treatment interaction (see Tables 2 & 3). Bold: significant p-values (p ≤ 0.05). Appropriate error terms for each factor are provided in Table 1. Post hoc tests for 2009 are indicated here and post hoc tests for 2010 are depicted in Fig. 3. Treatments are as follows: areas where no predators can feed (FE), duck exclosures where only invertebrate predators can feed (DE), areas where only whelks can feed (WO) and areas where all predators can feed (O)
20
Fall expt F2,12 p
2009 Jun Jul Aug Sep Oct
3.52 4.41 0.20 1.10 2.42
Nov
7.72 0.006
1.40
0.29
2010 Jan Apr May Jun Jul Aug Sep
2.18 1.93 5.28 11.08 8.56 4.14 6.86
0 0.67 0.50 1.98 1.48 1.39 3.59
1.00 0.53 0.62 0.18 0.27 0.29 0.06
0.06 0.03 0.82 0.36 0.13
Treatment comparisons
WO > DE, p = 0.03
11.20 0.002
DE > WO and O, p ≤ 0.03 WO and DE > O, p ≤ 0.03
Duck exclosures Open areas
15 a
10 a a a
Whelk density (ind. m–2)
Spring expt F2,14 p
A
Whelk-only
5
Month
145
a
b
ab
ab
ab ab b
b
b
b
a a
a a a
a a a
a a a
Jun
Jul
Aug
Sep
b
0
20
B 15
10
0.15 0.18 0.02 0.001 0.004 0.04 0.008
a
5 a
0
May
Month Table 5. Proportion of the total number of individual prey items (n = 330) from each species in dissected common eider digestive tracts. Polychaete species, green crabs Carcinus maenas, soft-shelled clams Mya arenaria and sea stars Asterias spp. were rare and constitute the ‘other’ category Species
Proportion of diet (%)
Blue mussel Mytilus edulis Whelk Nucella lapillus Periwinkle Littorina spp. Urchin Strongylocentrotus droebachiensis Horse mussel Modiolus modiolus Other
70.0 13.2 3.5 7.3 1.7 4.2
hoc testing no significant differences between months were detected (Tukey’s test, p ≥ 0.06). There was no overall treatment effect (Table 2), though power was low (50% power to detect a 40% difference among means). Conversely, the number of mussels varied with a combination of Month and Treatment (Table 2). Effects of Treatment became significant by March 2010, with density of M. edulis in open areas lower than in all other treatments
Fig. 3. Mean (± SE) dogwhelk Nucella lapillus density over time in the different treatments at low tide for (A) the spring experiment and (B) the fall experiment. Full exclosure is not shown as dogwhelks were not present in these areas. Only second year (2010) summer and fall densities are presented. Treatments with the same letter are not significantly different within each month (post hoc comparisons, p > 0.05)
(Table 6, Fig. 4A). The overall treatment effect persisted in all subsequent months for open areas (Table 6, Fig. 4A). Whelk-only areas showed a declining trend in mussel number; by May 2010, whelk-only areas were not significantly different from open areas (Fig. 4A). Mussel density in the different size classes for the spring experiment varied with a combination of Month and Treatment (interaction F48, 334 = 2.00, p < 0.001). The MANOVA generated 2 eigenvectors, of which the first one was significant (p < 0.001) and accounted for 75% of the variance in the model. Canonical coefficients for this vector indicated that one size class contributed most to the results:
Mar Ecol Prog Ser 465: 137–153, 2012
146
A
B
2500 2000 1500
FE a
a
a
a a
a
a a
1000 500
a
a
a
a a
a
(Table 7, Fig. 5), though power was low (50% power to detect a 56% difference among means).
a a
Fall experiment
M. edulis density (ind. m–2)
In the fall experiment, differences among predator treatments in mussel 0 biomass varied with Month (Table 3). 2500 DE Predator effects were seen in March, 2000 May and September 2010 (F3,12 = 5.52 to 8.39, p ≤ 0.01). In March, mussel 1500 ab a biomass was reduced in open areas a a a a a a a a 1000 relative to full exclosures (Tukey’s a a a b ab a test, p = 0.009). In May, mussel bio500 mass in open areas and duck exclosures was reduced relative to whelk0 only areas (Tukey’s test, p = 0.006 and 2500 WO 0.05, respectively). In September, mus2000 sel biomass in open areas was significantly lower than in full exclosures 1500 a (Tukey’s test, p = 0.005) and duck a a a a a a a exclosures (Tukey’s test p = 0.007). a 1000 a a a a ab ab Effects of predator treatment on ab 500 number of mussels present also varied with Month (Table 3). In May 2010 0 and through the end of the experi2500 O ment, open areas had significantly fewer mussels than full exclosures and 2000 whelk-only areas (Table 6, Fig. 4B). 1500 By September 2010, duck exclosures a a a had significantly fewer mussels than 1000 a a a full exclosures and whelk-only areas a a (Table 6, Fig. 4B). 500 a b b b b b b Density of mussels in the different b 0 size classes for the fall experiment varSep Oct Nov Mar May Jul Sep May Jul Nov May Sep ied with a combination of Month and Jun Sep Mar Jul Treatment (interaction F36,144 = 1.77, 2010 2009 2009 2010 p = 0.01). The MANOVA generated 2 Fig. 4. Mean (± SE) Mytilus edulis density in the different treatments over time eigenvectors. The first was significant for (A) the spring experiment and (B) the fall experiment. Treatments with the (p = 0.005) and accounted for 81% of same letter are not significantly different within each month across panels the variance in the model. Canonical (post hoc comparisons, p > 0.05). Abbreviations for treatments are as in coefficients for this vector indicated Table 4 that mussels >45 mm contributed most > 35 mm. Differences among predator treatments in to the results. Differences among predator treatments mussel density in this size class varied with Month in mussel density in this size class varied with Month (Table 2). When treatments were analyzed sepa(Table 3). Large mussels became more abundant as rately, large mussels increased over time in full extime passed in full exclosures and whelk-only areas closures and duck exclosures (Table 7, Fig. 5). (Table 7, Fig. 6). No significant effect of Month was Large mussels decreased over time in open areas detected in open areas, though there was a trend to(Table 7, Fig. 5). No significant effect of Month was wards reduced densities over time (Table 7, Fig. 6). detected in areas where only whelks could feed There were no temporal trends in duck exclosures
Boudreau & Hamilton: Predation in an intertidal mussel bed
DISCUSSION
Table 6. Results of randomized block ANOVAs examining the effect of Treatment on mussel density. Each month was analysed separately based on a Month × Treatment interaction (see Tables 2 & 3). Bold: significant effects (p ≤ 0.05). Post hoc comparisons are provided in Fig. 4 Month
Spring experiment F3, 21 p
2009 May Jun Jul Sep Oct Nov 2010 Mar May Jul Sep
1.10 1.29 0.58 1.63
0.37 0.30 0.64 0.21
2.42 5.33 6.41 7.39 5.61
Spring experiment — effects of predation and compensation Diving ducks had a large effect on the mussel bed in our experimental area. This is consistent with other studies that have suggested that sea ducks can have a great effect on resources (Guillemette et al. 1996, Hamilton 2000, Kirk et al. 2008). We are confident that ducks were responsible for these effects for a number of reasons. First, mussel abundance declined substantially in areas in which ducks could feed relative to other treatments, particularly during periods when ducks were abundant and invertebrate predators were not. Second, common eiders, which made up 88% of ducks observed at our study site, can ingest mussels ranging from 2 to 60 mm long (Guillemette et al. 1996). Hamilton et al. (1999) found that mussel size preferences of eiders varied with season, with preference during most of the year for 19 to 28 mm mussels, but 37 to 50 mm mussels in winter. Most of the mussels present in this study were 20 to 50 mm, which corresponds well with the size range consumed by eiders (3.5 to 50.7 mm). Finally, invertebrate predators when abundant during summer did not cause the same declines in duck exclosures, making it very unlikely that they would have contributed to changes observed during fall, when invertebrates were much less active. Notwithstanding the effect of ducks on number of mussels, the biomass of blue mussels did not vary with treatment in the spring experiment. This finding may have been in part due to somewhat low statistical power, but the result can also be explained by considering the size structure of the mussel population. In our study area, there was virtually no recruitment of juveniles to the mussel bed during the experiment. Even spat present in these areas at the end of the experiment (M. R. Boudreau 2011) did not persist through the fall (M. R. Boudreau unpubl. data). Thus, the decline in mussel density in some treatments led
Fall experiment F3,12 p
0.09
1.24 0.55 3.39
0.34 0.66 0.06
0.01 0.003 0.001 0.01
3.10 6.64 3.53 25.42
0.07 0.01 0.05 < 0.001
147
(Table 7, Fig. 6). In both of those instances, power was very low (50% power to detect a 75 to 80% difference among means).
Start time consequences — differences among experiments When comparing the second 6 mo of each experiment, in which duck predation had occurred in each, but a summer following duck predation had passed in only the fall experiment, we found that differences among treatments in mussel density varied with start time (interaction F3, 33 = 2.72, p = 0.06). Effects within each experiment are as described above. Similarly, when we examined the final summer in each experiment, during which compensatory predation was observed, treatment effects on mussel density also varied with start time (F3, 33 = 6.59, p = 0.001). As described above, compensation by whelks was more apparent in the spring experiment, and by all invertebrate predators in the fall experiment.
Table 7. Results of randomized block ANOVAs examining the effect of Month on adult mussel density in the > 35 mm size class in the spring experiment and the > 45 mm size class in the fall experiment. Each treatment was analysed separately based on a Month × Treatment interaction (see Tables 2 & 3). Bold: significant effects (p ≤ 0.05) Treatment MSMonth Full exclosure Duck exclosure Open areas Whelk only
1.93 × 10⁵ 1.81 × 10⁵ 3.09 × 10⁵ 9.02 × 10⁴
Spring experiment MSMonth × Block F8, 56 6.92 × 10⁴ 7.80 × 10⁴ 3.87 × 10⁴ 5.01 × 10⁴
2.78 2.32 8.00 1.80
p
MSMonth
0.01 0.03 < 0.001 0.1
2.27 × 10⁵ 4.53 × 10⁴ 3.83 × 10⁴ 1.87 × 10⁵
Fall experiment MSMonth × Block F6, 24 5.62 × 10⁴ 3.10 × 10⁴ 1.58 × 10⁴ 2.52 × 10⁴
4.04 1.46 2.43 7.43
p 0.01 0.23 0.06 < 0.001
Mar Ecol Prog Ser 465: 137–153, 2012
148
1200
20–35 mm
>35 mm
Although congregation of whelks can lead to intraspecific competition and reduced per capita foraging, the reduction in feeding is 800 not as pronounced as when in the presence 600 of other competitors such as crabs (Quinn et 400 al. 2012), and conspecific facilitative effects 200 in whelks have also been noted (Hughes & 0 Dunkin 1984). Thus, the increased number of 1200 whelks in these cages, coupled with freedom DE 1000 from interactions with crabs, likely led to the 800 observed compensation. Such compensation by whelks in systems where taxa have large 600 top-down effects is not uncommon and may 400 help to buffer changes within such communi200 ties (e.g. Navarrete & Menge 1996). In the 0 spring experiment, whelk compensation for 1200 WO duck exclusion was evident in areas where 1000 only whelks could feed 1 yr after the experi800 ment was initiated. Conversely, whelk 600 effects were not evident in the first summer of the experiment, presumably because at 400 that point ducks were not abundant in the 200 experimental area and had not yet generated 0 a difference between control areas and 1200 O exclosures. Thus, a congregative response 1000 by whelks was not induced. If ducks were to 800 become absent from the system, over time 600 whelks may also show the same congregative response in unmanipulated mussel beds 400 that we noted in exclosures. Their effect is 200 likely to be muted relative to what we 0 May Jul Nov May Sep observed because of the much larger scale May Jul Nov May Sep Jun Sep Mar Jul Jun Sep Mar Jul involved, though because whelks are direct 2009 2010 2010 2009 developers (Navarrete & Menge 1996), a long-term increase in prey availability could Fig. 5. Changes in adult Mytilus edulis density (mean ± SE) over also induce a numeric response in whelks, time for each size class in each of the treatments in the spring experiment. See Table 7 for statistical results for the larger size leading to broader-scale compensation (e.g. class. The smaller size class was not analysed independently of the see Etter 1996). MANOVA because it contributed little to the overall multivariate In areas where all invertebrate predators result. See Table 4 for treatment abbreviations had access, the same level of compensation was not seen. Fewer mussels in these areas to less crowding within these areas and faster growth were eaten compared with open areas and areas rates for the remaining mussels (sensu Seed 1968, where only whelks could feed. There were 2 princiHamilton 2000, Lauzon-Guay et al. 2005). Because of pal invertebrate predators present in the study area this change in growth rates, differences in mussel during summer months: green crabs and dogwhelks. biomass between treatments were limited. Although present occasionally, there was no eviConsistent with the findings of Hamilton (2000), we dence that sea stars had substantial predatory effects found that whelks partially compensated for duck on the system (M. R. Boudreau 2011). Summer water exclusion (though only under certain conditions; see temperature was between 11 and 15°C (M. R. ‘Fall experiment and effects of seasonality’ below) by Boudreau 2011), an optimal foraging temperature for congregating in areas where only they could feed, dogwhelks and green crabs (Stickle & Bayne 1987, increasing consumption of mussels and reducing Baldridge & Smith 2008), so both should have foroverall densities of the sizes they could consume. aged actively. However, negative interactions be-
M. edulis density (ind. m–2)
1000
FE
Boudreau & Hamilton: Predation in an intertidal mussel bed
30–45 mm
1000
>45 mm
800 FE
600 400 200 0 1000
DE
M. edulis density (ind. m–2)
800 600 400 200 0 1000
WO
800 600 400 200 0 1000
O
800 600 400
149
June 2010) and the foraging rates of whelks that were present, whereas there were too few crabs present for whelks to have a substantial facilitative effect. Compensatory responses to changes in activities of particular predators in a system may help to buffer overall effects on communities, prevent trophic cascades and promote stability (e.g. Navarrete & Menge 1996, Hamilton 2000). When multiple predators are present at each trophic level, such compensation may be more likely to happen (Tilman et al. 1998). However, in our study, a single species compensated for duck exclusion more effectively than multiple species, as whelks were able to aggregate and consume excess mussels when on their own but not when in the presence of other competitors. Thus, in this community, stability may be primarily dependent on which species are present (Wood et al. 2010) and the interactions involved (Pace et al. 1999, Hooper et al. 2005, Grman et al. 2010), rather than on overall complexity. Our data highlight the importance of considering interactions among potential compensating species when studying effects of top-down predators in systems such as this.
200 0
Fall experiment and effects of seasonality Sep
Oct
Nov
Mar
May
Jul
Sep
Sep
Oct
Nov
Mar
May
Jul
Sep
Seasonality relative to timing of the experiments had a substantial effect on results in this study. Direct comparisons of the second Fig. 6. Changes in Mytilus edulis density (mean ± SE) over time for each size class in each of the treatments in the fall experiment. See 6 mo of each experiment (at which point Table 7 for statistical results for the larger size class. The smaller ducks had fed in both experiments, but the size class was not analysed independently of the MANOVA befollowing summer with invertebrate predacause it contributed little to the overall multivariate result. See tion had only occurred in the fall experiment) Table 4 for treatment abbreviations revealed that treatment differences varied with experimental start time. The same tween these 2 species (see Introduction) may have result was observed when we compared the 2 experlowered prey consumption rates. Other experiments iments during summer 2010, the period when comhave shown a facilitative effect of whelks on crab forpensation occurred in both studies. Thus, timing of aging rates but a negative effect of crabs on whelk experiments is crucial to the outcome. foraging (M. R. Boudreau 2011, Quinn et al. 2012, In the fall experiment, diving duck predation was Wong et al. 2012), so the presence of both predators again important, with the number of mussels retogether could have increased or decreased total duced over winter. However, the initiation point of consumption of mussels, depending on the relative manipulations changed how invertebrate predators abundance of predators in the system. Facilitative compensated for diving duck exclusion. In this exand negative interactions are density dependent periment, which started after duck predation had (Bruno et al. 2003); in our study, crab presence probcommenced, whelks no longer exhibited a compenably slightly reduced whelk abundance (Fig. 3A, satory response, but instead compensation was noted
2009
2010
2009
2010
150
Mar Ecol Prog Ser 465: 137–153, 2012
in duck exclosures with overall reductions in mussel densities in these areas. This was probably because of shifts in available prey sizes as a result of duck predation that occurred before the experiment was initiated. At the end of September 2009, mussels in fall experimental areas were larger, possibly as a result of selective duck foraging before the experiment began (Hamilton et al. 1999). Both whelks and green crabs prefer a restricted size range of mussels based on their body size (Hughes & Dunkin 1984, Ameyaw-Akumfi & Hughes 1987, Enderlein et al. 2003). Although the remaining available mussels were within the size range (25 to 50 mm) that whelks in this study could consume (most whelks had a shell height of 23 to 28 mm; B. K. Quinn unpubl. data), the most profitable mussel size for these whelks was probably close to 25 mm (Hughes & Dunkin 1984). By the end of May 2010, when whelks moved back into the mussel bed, most mussels were already larger than 35 mm and entering a new growing season. Conversely, cages in the spring experiment generally contained smaller mussels because ducks had not removed these during the previous fall. The higher densities may have also led to slower growth of mussels in these cages (sensu Seed 1968, Hamilton 2000, Lauzon-Guay et al. 2005) compared with cages in the fall experiment, compounding the size difference between the experiments. Therefore, perhaps because of enhanced feeding opportunities with mussels of preferred sizes, during summer 2010 whelks preferred to forage in whelk-only treatments in the spring experiment cages (Fig. 3) and did not congregate in large enough numbers in fall experiment cages to generate a compensatory result. In contrast to the spring experiment, compensation was only seen in duck exclosures in the fall experiment. We speculate that crabs may have been responsible for this, perhaps with facilitation from whelks (M. L. Boudreau 2011, Quinn et al. 2012, Wong et al. 2012). In this study, crabs in the area were small in 2009, but frequently were 30 to 60 mm in carapace width in summer 2010 (M. R. Boudreau unpubl. data). Crabs between 33 and 38 mm tended to forage on mussels in the 30 to 42 mm size range (B. K. Quinn unpubl. data). Ameyaw-Akumfi & Hughes (1987) found that crabs 60 mm in carapace width could consume mussels up to 50 mm in length. Crabs in this system may therefore have preferred the size classes left in these areas after a season of duck predation. Under this scenario, it appears that multiple predators (crabs with whelks) were more efficient at compensating than a single predator, the opposite of what was observed in the spring experiment.
Potential artefacts Predators Crabs and sea stars almost never entered cages that were designed to exclude them, so we are confident that any such intrusions did not affect the outcome of experiments. Whelks entered exclosures more frequently (see 'Results'). However, since they were rarely observed feeding on these occasions, and intruding whelks were removed during regular cage checks during summer (when invertebrates were active), these intrusions likely had little effect on our results. Further, any effect that did occur would be a conservative bias in that it would minimize differences among treatments.
Cage effects Any caging experiment has potential caging artefacts (Dayton & Oliver 1980, Miller & Gaylord 2007), and cage controls are frequently used to measure or account for this effect (e.g. Robles 1997, Posey et al. 2006, Ellis et al. 2007). In this experiment, we had multiple exclosure treatments involving different mesh sizes. Space limitations prevented the use of separate controls for each cage type, and in some cases controls were not needed (e.g. duck exclosure which had large mesh and no sides; see Hamilton 2000). Our cage controls used the finer of our 2 mesh sizes because it was most likely to affect water flow (Miller & Gaylord 2007) or animal activity. We also adhered to many of the recommendations of Miller & Gaylord (2007) to minimize and properly document effects of caging, namely using low profile cages, quantifying presence of mobile consumers, orienting cage controls to maximize flow effects and estimating changes in water flow rates resulting from caging. With the exception of shading (which was only a factor for a short time at low tide), we detected no caging effects. There were no differences between cage controls and duck exclosures, meaning they were essentially the same and a comparison of full exclosures and duck exclosures is the appropriate test of invertebrate predation. We are therefore confident that caging effects were not an issue in this study.
Sampling effects Our experiment involved removal of material from the experimental cages each month. This was un-
Boudreau & Hamilton: Predation in an intertidal mussel bed
151
Table 8. Summary of the main time points and events associated with each experiment showing the type of predators present (ducks or invertebrates) and whether compensation for exclusion treatments occurred is indicated (the latter in italics) Expt
May 2009
Jun−Aug 2009
Sep 2009
Oct 2009−March 2010
May−Sep 2010
Spring
Initiation
Invertebrates No compensation
Ducks and invertebrates No compensation Initiation
Ducks No compensation Ducks No compensation
Invertebrates Whelks compensate Invertebrates Crabs compensate
Fall
avoidable; collecting the required data on mussels would not have been possible in situ. If not done carefully, such destructive sampling could affect the results through density-dependent effects on the remaining mussels (see Hamilton 2000) and resulting changes in predator activity (e.g. Smallegange & van der Meer 2007). To manage this, we replaced the removed material with an equivalent amount from the surrounding area. When mussels needed to be replaced, we roughly matched sizes and densities to ensure that prey availability was not altered. Further, to ensure that these newly introduced mussels were not sampled in subsequent months, the same location within an exclosure (noted on a grid system) was never sampled more than once. Thus, although destructive sampling is a potential source of error, we are confident that our efforts to manage the possible artefacts generated by this approach minimized or eliminated the risk of inappropriate conclusions.
Our data suggest that seasonality should be a major consideration in field experiments. In this case, our conclusions on effectiveness of compensation by multiple predators were entirely dependent on timing. Multiple authors have discussed the importance of considering temporal scale in studies of species associations (e.g. Drake 1990, Underwood et al. 2004, Schröder et al. 2005, Wood et al. 2010). Our results strongly support this view and highlight the importance of carefully planning initiation points based on detailed knowledge of the species present in the systems under study. Acknowledgements. We thank B. Quinn, M. L. Boudreau, A. Taylor, C. Macfarlane, J. Craig, J. Quinn, C. Ocheing, S. Sutcliffe, M. Coffin, L. Bursey, S. Legett, G. Alderson, R. Boudreau and S. Bell for field and laboratory assistance. J. M. DeVink provided advice on duck dissection, and B. Donnelly and J. Martin donated duck specimens. Staff at Huntsman Marine Science Centre provided assistance throughout the project. We thank M. Barbeau, F. Baerlocher and M. Wong for comments on earlier drafts of the paper. Funding was provided by a Natural Sciences and Engineering Research Council (NSERC) Discovery grant to D.J.H., an NSERC Postgraduate Scholarship (Master’s) to M.R.B., the New Brunswick Wildlife Trust Fund, a Mount Allison University Marjorie Young Bell Faculty Fellowship to D.J.H. and a Huntsman Marine Science Centre Graduate Scholarship to M.R.B.
CONCLUSIONS This is one of the few ecological field studies to directly assess the effect of seasonality on results. Timing experiments to consider seasonal changes can be crucial to a complete understanding of biological communities. In the present study, the effects of ducks were strong, as predicted, and consistent across both experiments. However, because all predators within this community fed on a restricted range of mussel sizes, the timing of elimination of duck predation was crucial to the outcome of the rest of the experiment. When only large mussels were available to invertebrate predators, crabs and whelks together compensated but whelks alone did not (from May to September 2010 in the fall experiment). When ducks were excluded earlier and smaller mussels remained available, whelks compensated for duck exclusion when not in the presence of crabs (from May to September 2010 in the spring experiment) (see Table 8 for summary of main conclusions with respect to compensation).
LITERATURE CITED
➤ Ameral V, Cabral HN, Jenkins S, Hawkins S, Paula J (2009)
➤
➤ ➤
Comparing quality of estuarine and nearshore intertidal habitats for Carcinus maenas. Estuar Coast Shelf Sci 83: 219−226 Ameyaw-Akumfi C, Hughes RN (1987) Behaviour of Carcinus maenas feeding on large Mytilus edulis. How do they assess the optimal diet? Mar Ecol Prog Ser 38: 213−216 Aschaffenburg MD (2008) Different crab species influence feeding of the snail Nucella lapillus through trait-mediated indirect interactions. Mar Ecol 29:348−353 Baldridge AK, Smith LD (2008) Temperature constraints on phenotypic plasticity explain biogeographic patterns in predator trophic morphology. Mar Ecol Prog Ser 365: 25−34 Boudreau ML (2011) Little or large? The use of kleptopara-
152
➤ ➤
➤ ➤ ➤ ➤
➤ ➤
➤
➤
➤
➤
Mar Ecol Prog Ser 465: 137–153, 2012
sitism as a feeding tactic in the green crab (Carcinus maenas). Honour’s dissertation, Mount Allison University, Sackville Boudreau MR (2011) Interactions between predators within an intertidal mussel bed community. MSc dissertation, Mount Allison Univeristy, Sackville Bruno JF, Stachowicz JJ, Bertness MD (2003) Inclusion of facilitation into ecological theory. Trends Ecol Evol 18: 119−126 Connell JH (1972) Community interactions on marine rocky intertidal shores. Annu Rev Ecol Syst 3:169−192 Crothers JH (1968) The biology of the shore crab Carcinus maenas (L.). II. The life of the adult crab. Field Stud 2: 579−614 Dayton PK, Oliver JS (1980) An evaluation of experimental analyses of population and community patterns in benthic marine environments. In: Tenore KR, Coull BC (eds) Marine benthic dynamics. University of South Carolina Press, Columbia, SC, p 93−120 Drake JA (1990) The mechanics of community assembly and succession. J Theor Biol 147:213−233 Dungan ML (1986) Three-way interactions: barnacles, limpets and algae in a Sonoran desert rocky intertidal zone. Am Nat 127:292−316 Ellis JC, Shulman MJ, Wood M, Whitman JD, Lozyniak S (2007) Regulation of intertidal food webs by avian predators on New England rocky shores. Ecology 88:853−863 Enderlein P, Moorthi S, Rohrscheidt H, Wahl M (2003) Optimal foraging versus shared doom effects: interactive influence of mussel size and epibiosis on predator preference. J Exp Mar Biol Ecol 292:231−242 Etter RJ (1996) The effect of wave action, prey type and foraging time on growth of the predatory snail Nucella lapillus (L.). J Exp Mar Biol Ecol 196:341−356 Freudendahl A, Nielson M, Jensen T, Jensen KT (2010) The introduced clam Ensis americanus in the Wadden Sea: field experiment on impact of bird predation and tidal level on survival and growth. Helgol Mar Res 64:93−100 Gaymer CF, Dutil C, Himmelman JH (2004) Prey selection and predatory impact of four major sea stars on a soft bottom subtidal community. J Exp Mar Biol Ecol 313: 353−374 Grman E, Lau JA, Schoolmaster DR, Gross KL (2010) Mechanisms contributing to stability in ecosystem function depend on the environmental context. Ecol Lett 13: 1400−1410 Guillemette M, Reed A, Himmelman JH (1996) Availability and consumption of food by common eiders wintering in the Gulf of St. Lawrence: evidence of prey depletion. J Zool 74:32−38 Hamilton DJ (1997) Community consequences of habitat use and predation by common eiders in the intertidal zone of Passamaquoddy Bay. PhD dissertation, University of Guelph, Guelph Hamilton DJ (2000) Direct and indirect effects of predation by common eiders and abiotic disturbance in an intertidal community. Ecol Monogr 70:21−43 Hamilton DJ, Nudds TD, Neate J (1999) Predation of blue mussels (Mytilus edulis) by common eiders (Somateria mollissima) under controlled field conditions. Auk 116: 403−416 Hamilton DJ, Diamond AW, Wells PJ (2006) Shorebirds, snails, and the amphipod (Corophium volutator) in the upper Bay of Fundy: top-down vs. bottom-up factors, and the influence of compensatory interactions on mudflat
ecology. Hydrobiologia 567:285−306
➤ Hooper DU, Chapin FS, Ewel JJ, Hector A and others (2005) ➤
➤
➤ ➤
➤ ➤
➤ ➤ ➤ ➤ ➤
➤
➤
➤
➤
Effects of biodiversity on ecosystem functioning: a consensus of current knowledge. Ecol Monogr 75:3−35 Hughes RN, Dunkin SB (1984) Behavioural components of prey selection by dogwhelks, Nucella lapillus, feeding on mussels, Mytilus edulis, in the laboratory. J Exp Mar Biol Ecol 77:45−68 Jokiel PL, Morrisey JI (1993) Water motion on coral reefs−evaluation of the clod card technique. Mar Ecol Prog Ser 93:175−181 Keppel G, Wickens TD (2004) Design and analysis: a researcher’s handbook. Pearson Prentice Hall, Upper Saddle River, NJ Kirk M, Esler D, Iverson SA, Boyd WS (2008) Movements of wintering surf scoters: predator responses to different prey landscapes. Oecologia 155:859−867 Lauzon-Guay JS, Hamilton DJ, Barbeau MA (2005) Effect of mussel density and size on the morphology of blue mussels (Mytilus edulis) grown in suspended culture in Prince Edward Island, Canada. Aquaculture 249: 265−274 Mackenzie CL Jr (1969) Feeding rates of starfish, Asterias forbesi (Desor), at controlled water temperatures and during different seasons of the year. Fish Bull 68:67−72 Menge BA (1995) Indirect effects in marine rocky intertidal interaction webs: patterns and importance. Ecol Monogr 65:21−74 Miller LP, Gaylord B (2007) Barriers to flow: the effects of experimental cage structures on water velocities in highenergy subtidal and intertidal environments. J Exp Mar Biol Ecol 344:215−228 Mowles SL, Rundle SD, Cotton PA (2011) Susceptibility to predation affects trait-mediated indirect interactions by reversing interspecific competition. PLoS ONE 6:e23068 Navarrete SA, Menge BA (1996) Keystone predation and interaction strength: interactive effects of predators on their main prey. Ecol Monogr 66:409−429 Navarrete SA, Menge BA, Daley BA (2000) Species interactions in intertidal food webs: prey or predation regulation of intermediate predators? Ecology 81:2264−2277 Pace ML, Cole JJ, Carpenter SR, Kitchell JF (1999) Trophic cascades revealed in diverse ecosystems. Trends Ecol Evol 14:483−488 Page AJ, Cooper CE, Withers PC (2011) Effects of experiment start time and duration on measurement of standard physiological variables. J Comp Physiol B 181: 657−665 Paine RT (1966) Food web complexity and species diversity. Am Nat 100:65−75 Pallant J (2007) SPSS survival manual, 3rd edn. Open University Press, New York, NY Petes LE, Mouchka ME, Milston-Clements RH, Momoda TS, Menge BA (2008) Effects of environmental stress on intertidal mussels and their sea star predators. Oecologia 156:671−680 Posey MH, Alphin TD, Cahoon L (2006) Benthic community responses to nutrient enrichment and predator exclusion: Influence of background nutrient concentrations and interactive effects. J Exp Mar Biol Ecol 330:105−118 Quinn BK, Boudreau MR, Hamilton DJ (2012) Inter- and intraspecific interactions among green crabs (Carcinus maenas) and whelks (Nucella lapillus) feeding on blue mussels (Mytilus edulis). J Exp Mar Biol Ecol 412: 117−125
Boudreau & Hamilton: Predation in an intertidal mussel bed
➤ Robles CD (1997) Changing recruitment in constant species ➤
➤
➤ ➤
➤ ➤
➤
assemblages: implications for predation theory in intertidal communities. Ecology 78:1400−1414 Robles C, Rob J (1993) Varied carnivore effects and the prevalence of intertidal turfs. J Exp Mar Biol Ecol 166: 65−91 SAS Institute (2004) SAS version 6.11. SAS Institute, Cary, NC Sasaki T, Lauenroth WK (2011) Dominant species, rather than diversity, regulates temporal stability of plant communities. Oecologia 166:761−768 Scheiner SM (2001) MANOVA: Multiple response variables and multispecies interactions. In: Scheiner SM, Gurevitch J (eds) Designs and analysis of ecological experiments, 2nd edn. Chapman & Hall, New York, NY, p 99–115 Schröder A, Persson L, De Roos AM (2005) Direct experimental evidence for alternative stable states: a review. Oikos 110:3−19 Seed R (1968) Factors influencing shell shape in the mussel Mytilus edulis. J Mar Biol Assoc UK 48:561−584 Smallegange IM, van der Meer J (2007) Interference from a game theoretical perspective: Shore crabs suffer most from equal competitors. Behav Ecol 18:215−221 Smallegange IM, van der Meer J, Kurvers RH (2006) Disentangling interference competition from exploitive competition in a crab−bivalve system using a novel experimental approach. Oikos 113:157−167 SPSS (2009) PASW Statistics 17. SPSS, Chicago, IL Stickle WB, Bayne BL (1987) Energetics of the muricid gasEditorial responsibility: Hans Heinrich Janssen, Oldendorf/Luhe, Germany
➤ ➤ ➤ ➤ ➤
➤
➤
153
tropod Thais (Nucella) lapillus (L.). J Exp Mar Biol Ecol 107:263−278 Tabachnick BG, Fidell LS (2007) Using multivariate statistics, 5th edn. Pearson Education, Boston, MA Tilman D, Lehman CL, Bristow CE (1998) Diversity–stability relationships: statistical inevitability or ecological consequence? Am Nat 151:277−282 Tilman D, Reich PB, Knops JM (2006) Biodiversity and ecosystem stability in a decade-long grassland experiment. Nature 441:629−632 Trussell GC, Ewanchuk PJ, Bertness MD (2003) Trait-mediated effects in rocky intertidal food chains: Predator risk cues alter prey feeding rates. Ecology 84:629−640 Underwood AJ, Chapman MG, Crowe TP (2004) Identifying and understanding ecological preferences for habitat or prey. J Exp Mar Biol Ecol 300:161−187 Wong MC, d’Entremont J, Barbeau MA (2012) An approach for quantifying effects of multiple predators that forage on different time scales. J Exp Mar Biol Ecol 420–421: 100−109 Wood SA, Lilley SA, Schiel DR, Shurin JB (2010) Organismal traits are more important than environment for species interactions in the intertidal zone. Ecol Lett 13: 1160−1171 Wootton JT (1992) Indirect effects, prey susceptibility, and habitat selection: impacts of birds on limpets and algae. Ecology 73:981−991 Zar JH (1999) Biostatistical analysis, 3rd edn. Prentice Hall, Upper Saddle River, NJ Submitted: October 31, 2011; Accepted: June 25, 2012 Proofs received from author(s): September 21, 2012