Home
Search
Collections
Journals
About
Contact us
My IOPscience
Second-order structural phase transition in Sr2CuWO6 double-perovskite oxide
This content has been downloaded from IOPscience. Please scroll down to see the full text. 2003 J. Phys.: Condens. Matter 15 6749 (http://iopscience.iop.org/0953-8984/15/40/012) View the table of contents for this issue, or go to the journal homepage for more
Download details: IP Address: 152.17.121.80 This content was downloaded on 20/02/2016 at 05:14
Please note that terms and conditions apply.
INSTITUTE OF PHYSICS PUBLISHING
JOURNAL OF PHYSICS: CONDENSED MATTER
J. Phys.: Condens. Matter 15 (2003) 6749–6757
PII: S0953-8984(03)65180-5
Second-order structural phase transition in Sr2 CuWO6 double-perovskite oxide Milen Gateshki and Josu M Igartua1 Fisika Aplikatua II Saila, Zientzia Fakultatea, Euskal Herriko Unibertsitatea, PO Box 644, Bilbao 48080, Spain E-mail:
[email protected]
Received 18 June 2003 Published 26 September 2003 Online at stacks.iop.org/JPhysCM/15/6749 Abstract In the present work we report results from neutron and synchrotron radiation diffraction measurements that confirm the presence of a very weak phase transition in Sr2 CuWO6 at about 600 ◦ C. This phase transition is continuous and changes the symmetry from I 4/m at low temperature to another tetragonal phase at high temperature. On the basis of the experimental results we identify I 4/mmm as the most probable space group for the high-temperature tetragonal phase.
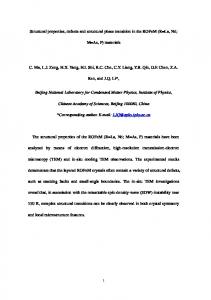
1. Introduction The first synthesis of Sr2 CuWO6 was reported in [1]. Since then, the room temperature structure of this compound has been determined on several occasions (table 1); it is tetragonal, of ordered perovskite type, with a body-centred unit cell. The ordered perovskite structure can be represented as a three-dimensional network of alternating CuO6 and WO6 octahedral units, sharing their vertices. The Cu and W atoms are in the centres of the octahedra, the O atoms are on the vertices and the Sr atoms occupy the interstitial spaces. Due to the presence of the Jahn–Teller active cation Cu2+ , the CuO6 octahedra are strongly elongated in the direction of the fourfold axis. All authors [3, 5, 6] agree that, at room temperature, Sr2 CuWO6 has the space group I 4/m. The only exception is the work [7], where the space group assigned to the structure is I 4/mmm. The difference between these two structural determinations is that while I 4/mmm allows only deformations of the octahedra and not rotations of any kind, I 4/m accommodates both deformations and rotations (figure 1). As seen from table 1, all structural refinements made in the I 4/m space group include octahedral rotations around the c-axis. The angle of rotation, calculated from the atomic positions, is in the range between 8.6◦ and 10.9◦ . 1 Author to whom any correspondence should be addressed.
0953-8984/03/406749+09$30.00
© 2003 IOP Publishing Ltd
Printed in the UK
6749
6750
M Gateshki and J M Igartua
b
b
a
a
(b)
(a)
Figure 1. Ordered perovskite structure models with space groups (a) I 4/m and (b) I 4/mmm. In the structure in (a) the octahedral units are rotated about the c-axis and in the structure in (b) they are not rotated. Arrows denote the direction of the rotation necessary for the structure in (a) to become equal to that in (b).
(This figure is in colour only in the electronic version) Table 1. Literature data on structural details at room temperature and phase transitions of Sr2 CuWO6 . The data shown are as follows: literature reference (‘Ref.’); lattice constants (a, c); Cu–O1 and Cu–O2 distances inside the CuO6 octahedra (d1 , d2 ); angle of rotation of the WO6 octahedra around the c-axis (ϕ); temperature of the first-order phase transition from the tetragonal to the cubic phase (Tc ). √ Ref. a (Å) c (Å) c/a 2 d1 (Å) d2 (Å) d1 /d2 ϕ (deg) Tc (◦ C) [1] [2] [3, 4] a,b [5] b [6] b [7] c [8] b
5.42 5.431 5.422 5.426 93 5.429 0 5.431 5 5.429 1
8.40 8.410 8.395 8.4087 8.4155 8.4024 8.4154
1.10 1.095 1.095 1.0956 1.0961 1.0939 1.0961
— — 2.2834 2.3250 2.3227 — 2.322
— — 1.9384 1.9604 1.9339 — 1.955
— — 1.1780 1.1860 1.2010 — 1.188
— — 8.9 10.5 8.6 — 10.9
— 920 897 — — — 920
a Measurements performed with neutron powder diffraction. All other results are obtained with conventional x-ray powder diffraction. b Structural refinements with the I 4/m space group. c The authors of this work suggest the space group I 4/mmm.
Sr2 CuWO6 was reported [2] to have one strong first-order phase transition at about 900 ◦ C, changing the symmetry from tetragonal at low temperature to cubic (later identified in [4] as ¯ Fm 3m) at high temperature. As pointed out in [2] this transition is a result of the Jahn– Teller effect. However, this effect accounts only for the elongation of the CuO6 octahedra and not for the rotation of these octahedra that exists in the room temperature structure. The rotation of the octahedra does not change the local environment of the Cu cations and, consequently, cannot be related to changes in the electronic structure. In a recent publication [8] we presented some evidence showing the presence of another structural phase transition in Sr2 CuWO6 . This phase transition is continuous and changes the symmetry from I 4/m at low temperature to another body-centred tetragonal phase at high temperature. It occurs at a lower temperature than the first-order Jahn–Teller transition and its effects are observed in the temperature dependences of the lattice constants and the intensities of some powder diffraction
Second-order structural phase transition in Sr2 CuWO6 double-perovskite oxide
6751
lines. In [8] we suggested that the rotation of the CuO6 and WO6 octahedra appears at this weak continuous phase transition and not at the Jahn–Teller phase transition, as previously assumed [4]. In order to confirm those preliminary results, temperature dependent neutron and synchrotron radiation diffraction measurements were performed. In this work, we present new diffraction data showing the effect of this second-order phase transition on the structural parameters of Sr2 CuWO6 . 2. Experimental details 2.1. Sample preparation The samples of Sr2 CuWO6 were prepared according to the following solid state reaction method: stoichiometric amounts of SrCO3 (99.995%), CuO (99.99%) and WO3 (99.995%), all from Sigma-Aldrich, were weighted, mixed and ground in an agate mortar. Then the mixture was placed in an alumina crucible for the heat treatment. Three successive heatings at 900, 1000 and 1100 ◦ C with intermediate regrindings were performed. The duration of each heating process was 24 h. The heating and cooling speed was 6 ◦ C min−1 . The method described is the same as the one used in [8]. Preliminary diffraction data were collected on a Philips X’Pert diffractometer. The refinement of the structure showed essentially the same results as reported in [8]. The quantitative analysis gave 97.8% weight concentration of Sr2 CuWO6 and 2.2% of SrWO4 . No traces of Sr2 WO5 were found. This result is better then the one reported in [8] where the concentration of the main compound was 91.2%. 2.2. Diffraction measurements and data analysis Neutron diffraction measurements were performed with the D20 high-intensity, mediumresolution instrument at Institut Laue–Langevin (Grenoble, France). Neutrons with wavelength 1.30 Å were used. The monochromator was Cu(200). This instrument is equipped with a detector that covers 153.4◦ in 2θ space and is made of 1534 3 He cells. The samples were placed in capillaries with diameter of 5 mm. Two separate sets of measurements were performed, the first one with a vanadium (V) capillary and the second one with a niobium (Nb) capillary. Niobium allows measurements at higher temperatures than vanadium, but its diffraction lines are present in the collected data; for this reason, refinement of the entire diffraction pattern was possible only for the data obtained with the V capillary. Continuous heating with a rate of 17 ◦ C min−1 was used. Synchrotron radiation data were collected in the X7A beamline at the National Synchrotron Light Source (Brookhaven National Laboratory, US). The wavelength used was 0.8005 Å. It was obtained using a Si(111) monochromator and was calibrated with a Ce standard sample. A position sensitive detector was used for data collection. The sample was placed in a quartz capillary and rotated during the measurement. Rietveld refinement of the structure at different temperatures was performed using the WinPlotr/FullProf package [9]. 3. Results and discussion 3.1. Neutron diffraction measurements Three different 2θ ranges from the neutron diffraction data collected at different temperatures are shown in figure 2. While (121) and (143) diffraction lines almost disappear at high temperatures (figures 2(a) and (c)), the intensities of (222) and (130) become nearly equal
6752
M Gateshki and J M Igartua
25000
14000
9000
(a)
(c)
(b) 8000
12000
20000 7000
Intensity(a.u.)
(121)
10000
(143)
6000
15000
(222) (130) 8000 5000
10000
6000
4000
3000
4000
5000 2000
2000 0 30
31
32
33
34
35
1000 42
43
44
45
46
47
62 64 66 68 70 72
Angle 2θ (deg) Figure 2. Sections of the neutron powder diffraction profiles collected at different temperatures. Data in (a) are from the measurement with the V capillary. The temperature range is from 50 ◦ C (lowest curve) to 770 ◦ C (highest curve) with a step of 80 ◦ C. The data in (b) and (c) are from the measurement with the Nb capillary. The temperature range is from 50 to 765 ◦ C with a step of 65 ◦ C.
(figure 2(b)). Figure 3 shows the changes with temperature in the intensities of several neutron diffraction lines. The intensities of the (121), (143) and (321) lines gradually decrease on heating and the lines disappear at about 600 ◦ C. (The (121) diffraction line could be observed only in the measurement with the V capillary, because in the experiment with the Nb capillary it is overlapped with one of the lines of Nb.) The behaviour of the (222) and (130) diffraction lines is different. From room temperature up to 600 ◦ C the intensity of (222) increases and that of (130) decreases. The intensities of both lines remain constant above 600 ◦ C. As can be seen, the intensities of all diffraction lines represented in figures 2 and 3 have some peculiarity at about 600 ◦ C. In our opinion, this observation can be interpreted as evidence of the presence of a phase transition at a temperature close to 600 ◦ C. In the two sets of measurements (with V and Nb capillaries) the effects related to this transition appear at almost the same temperature. The temperature of the phase transition observed in these diffraction data (600 ◦ C) is close to the one obtained with conventional x-ray measurements (670 ◦ C) [8]. The difference of 70 ◦ C is probably due to the fact that the sample studied with neutron diffraction was from a different preparation batch from the one studied with conventional x-ray diffraction. This, in some cases, can affect the transition temperature, as shown in [8, table 5]. The effects of the phase transition, observed in the neutron powder diffraction measurements (and also in the synchrotron measurements; see the next subsection), are compatible with those expected at a second-order phase transition; there are no discontinuities in the temperature dependence of the positions of the diffraction lines, which means that the
Second-order structural phase transition in Sr2 CuWO6 double-perovskite oxide 700
1600 1200 1000
600
(143)
Intensity (a.u.)
Intensity (a.u.)
1400
(121)
800 600
(143)
400
(321)
200 0
0
6753
500
(222)
400 (130)
300 200
(321)
100
200
300
400
500
600
700
100 0
100 200 300 400 500 600 700 800
Temperature (˚C)
Temperature (˚C)
Figure 3. The change of intensity with temperature for several diffraction lines in the neutron diffraction measurements. Filled points represent experimental data from the measurement with the Nb capillary and open points represent the data obtained with the V one. Curves are used as guides for the eye. The diffraction lines shown here are especially sensitive to the octahedral rotations around the fourfold axis. Table 2. Crystal structure data for Sr2 CuWO6 at room temperature. Atomic positions refined from the neutron diffraction data in the space group I 4/m. (Note: a = 5.4169(5) Å; c = 8.3976(8) Å; Rp = 7.19%; Rwp = 7.79%; Rexp = 2.21%; χ 2 = 12.5.) Atom
Site
x
y
z
Biso (Å2 )
W Cu Sr O1 O2
2a 2b 4d 4e 8h
0 0 0 0 0.2070(5)
0 0 1/2 0 0.2872(5)
0 1/2 1/4 0.2261(3) 0
0.16(7) 0.43(6) 0.53(3) 0.69(4) 0.50(2)
lattice constants change in a continuous way. The intensities of the diffraction lines also change smoothly, without jumps, which can be interpreted as reflecting continuous displacements of the atoms inside the unit cell. As in the conventional x-ray measurements, the systematic extinction analysis of the neutron data at room temperature gave a tetragonal symmetry and a body-centred unit cell. Three possible space groups were tested to describe the structure of Sr2 CuWO6 , namely I 4/mmm, I 4mm and I 4/m. Refinement of the structure with the neutron diffraction data at room temperature (figure 4) showed that the symmetry of the compound can be described only with the I 4/m space group. When structural models with I 4mm or I 4/mmm space groups were used, the calculated intensities of the (121), (143) and (321) diffraction lines were very small. For this reason, the refinements in these two space groups did not converge. The considerable intensities of the (121), (143) and (321) diffraction lines, measured in the experiment (figure 3), could be explained only assuming that the structure of Sr2 CuWO6 has the space group I 4/m. The results of the structural refinement at room temperature are given in table 2. As already mentioned, a structure with the I 4/m space group is compatible with a rotation of the octahedra around the fourfold axis. In figure 5 we show the rotation angle calculated from the atomic positions refined at different temperatures using a structural model with the I 4/m space group. As can be seen in the figure, this angle gradually decreases from its highest value at room temperature (9.2◦ ) down to 2◦ at 600 ◦ C, which is the temperature of the expected phase transition. Above 600 ◦ C this calculated angle slightly increases with the temperature.
6754
M Gateshki and J M Igartua
70000
Intensity (counts)
60000 50000 40000 30000 20000 10000 0 -10000
20
40
60
80
100
120
140
Angle 2θ (deg)
Rotation angle (deg)
Figure 4. Observed (·), calculated (——) and difference profiles for the Rietveld refinement of Sr2 CuWO6 at room temperature using a structural model with the I 4/m space group. The experimental data are from the neutron diffraction measurement with the V capillary.
10 9 8 7 6 5 4 3 2 1 0 0
100 200 300 400 500 600 700 800
Temperature (˚C) Figure 5. The angle of rotation of the WO6 octahedra refined from the neutron powder diffraction data at different temperatures. Error bars are calculated from the standard deviations of the positions of the O2 atoms, obtained in the refinement procedure. The continuous curve is a guide for the eye.
The refinement at a temperature above the transition gave almost the same reliability parameters for the three space groups tested: I 4/m (Rwp = 17.0%), I 4mm (Rwp = 17.1%), I 4/mmm (Rwp = 17.1%). In our opinion I 4/mmm is the correct space group assignment, since it has higher symmetry than I 4/m and I 4mm. In order to assign the correct space group to the high-temperature structure of Sr2 CuWO6 we must take into consideration the fact that this structure is obtained from the low-temperature phase with space group I 4/m after a second-order phase transition. Among the supergroups of I 4/m that are tetragonal and body centred, I 4/mmm is the only one that can be reached through a displacive second-order phase transition. This consideration supports the conclusion drawn from the refinement results that the high-temperature structure of Sr2 CuWO6 has a symmetry described with the I 4/mmm space group. In this space group, however, the rotation of the octahedra is not allowed and the rotation angle is expected to be zero. We think that in the real
Second-order structural phase transition in Sr2 CuWO6 double-perovskite oxide
140
60 50
6755
I121+I211
120
I130+I310 Intensity (a.u.)
Intensity (a.u.)
100 40 30 20 10
I222
0 12 10
80 60 40 20
8
6
4
2
Rotation angle (deg)
0
0 12 10
8
6
4
2
0
Rotation angle (deg)
Figure 6. Calculated neutron diffraction intensities as a function of the angle of rotation of the WO6 octahedra. These intensities become less sensitive to the rotation angle in the range of low angles.
structure this angle completely vanishes at the phase transition temperature. The residual value of the rotation angle (figure 5) calculated from the high-temperature diffraction data could be related to insufficient statistics or to another experimental reason—for example, the fact that we observed signs of decomposition of our sample above 700 ◦ C. It is also worth noting that the diffraction intensities are less sensitive to the rotations of the octahedra in the range of small rotation angles (see figure 6). Thus, in our opinion, the experimental data are consistent with a continuous phase transition from a structure with the I 4/m space group at low temperature to another with the I 4/mmm space group at high temperature. The order parameter of this transition is related to the angle of rotation of the CuO6 and WO6 octahedra around the fourfold axis. This angle is zero in the high-symmetry phase and gradually increases, on cooling, in the low-symmetry phase. 3.2. Synchrotron radiation diffraction measurements Synchrotron radiation measurements are characterized by a higher angular resolution (narrower diffraction lines) than the conventional x-ray measurements. We use this to emphasize the anomalies observed in the positions of the diffraction lines,in the laboratory measurements, that are relatively small when compared with their widths. The synchrotron radiation diffraction measurements also confirmed the presence of a continuous phase transition in Sr2 CuWO6 . Diffraction data in a 2θ interval from 25.25◦ to 30.25◦ were collected in the temperature range from 30 to 590 ◦ C (as commented on later, the real temperature of the sample is higher) with a 20 ◦ C temperature step. Figure 7 shows the temperature behaviour of two groups of representative diffraction lines obtained with synchrotron radiation. The behaviour of the lines that can be observed in the figures can be summarized in the following way. At first, when increasing the temperature from 30 ◦ C, the diffraction lines shift smoothly to lower 2θ angles. Then, when approaching 480 ◦ C, this shift becomes more rapid in the case of (301), (222) and (310) diffraction lines and almost disappears for (204). There is an abrupt change in the behaviour of these shifts at about 480 ◦ C. Above this temperature, the diffraction lines again
6756
M Gateshki and J M Igartua 600
500
←480˚C
Temperature ˚C
Temperature ˚C
600
400 300 200 100 25.6 25.8
(301) 26
(a)
480˚C→
400 300 200 100
(222) (310) 26.2 26.4 26.6 26.8
500
(204)
27.4
27
27.6
(b)
Angle 2θ (deg)
27.8
28
28.2
Angle 2θ (deg)
Figure 7. Sections of the synchrotron radiation powder pattern of Sr2 CuWO6 , showing the temperature evolution of selected diffraction lines. The intensity ranges used in the two figures are different in order to account for the different relative intensities. The arrows point to the anomalies evidencing the presence of a phase transition.
8.44
5.56 c
8.43
5.54
c (Å)
5.50
480°C
8.41
5.48 8.40
5.46
8.39 8.38
a (Å)
5.52
8.42
a
0
5.44 100
200
300
400
500
600
5.42
Temperature (˚C) Figure 8. Temperature behaviour of the lattice constants of Sr2 CuWO6 obtained from the synchrotron measurements. At about 480 ◦ C a small effect, related to the second-order phase transition, can be observed.
shift smoothly, but following a different temperature dependence to that at low temperatures. The same kinds of anomaly in the temperature dependence of the positions of the diffraction lines were observed in [8] with conventional x-ray diffraction. For this reason we believe that this is the effect of the same phase transition as reported in [8]. However, the temperature of the phase transition observed in the synchrotron data (480 ◦ C) is significantly lower than the one obtained from the neutron diffraction data (600 ◦ C)—even though the sample studied with synchrotron radiation is the same as the one studied previously with neutron diffraction. This difference is attributed to the fact that, for experimental reasons (furnace design, calibration procedure, etc), the temperature measured in the synchrotron experiment is lower than the real temperature of the sample. The temperature behaviour of the lattice constants, as refined from the positions of the diffraction lines, is shown in figure 8. In the vicinity of the phase transition temperature this behaviour is essentially the same as that obtained with conventional x-rays (see [8] figure 15) and can be described as a small change in the slope of the a(T ) and c(T ) dependences. The anomalies observed in the temperature dependence of the positions of the powder diffraction lines and in the lattice constants calculated from them confirm the presence of the
Second-order structural phase transition in Sr2 CuWO6 double-perovskite oxide
6757
phase transition in Sr2 CuWO6 discussed above. The effect of this transition on the lattice constants is related to the homogeneous strain coupled with the order parameter [10]. 4. Conclusions The data presented confirm the presence of a weak second-order structural phase transition in Sr2 CuWO6 at about 600 ◦ C. From the experimental results the conclusion is drawn that this transition changes the symmetry from I 4/m at low temperatures to I 4/mmm at high temperatures. The presence of this phase transition suggests that the symmetry lowering ¯ at temperatures above 900 ◦ C to I 4/m at room temperature is performed in two from Fm 3m steps and not just in one as previously reported. The complete phase transition sequence in ¯ → I 4/mmm → I 4/m. Sr2 CuWO6 is Fm 3m Acknowledgments This work was supported by Universidad del Pa´ıs Vasco/Euskal Herriko Univertsitatea through research grant UPV 0063.310-13564/2001. This research was carried out in part at the National Synchrotron Light Source, Brookhaven National Laboratory, which is supported by the US Department of Energy, Division of Materials Sciences and Division of Chemical Sciences. The authors thank M Aroyo for helpful discussions. Thanks are also due to B Noheda, T Vogt (both from NSLS) and J Campo (from ILL) for their assistance with the equipment. References [1] [2] [3] [4] [5] [6] [7] [8] [9] [10]
Blasse G 1965 J. Inorg. Nucl. Chem. 27 993 Venevtsev Yu N 1971 MRS Bull. 6 1085 Reinen D and Weitzel H 1976 Z. Anorg. Allg. Chem. 424 31 Reinen D, Wellern H O and Wegwerth J 1997 Z. Phys. B 104 595 Bokhimi 1992 Powder Diffract. 7 228 Iwanaga D, Inaguma Y and Itoh M 1999 J. Solid State Chem. 147 291 Jansen M and Kucheiko S 1993 J. Mater. Res. 8 324 Gateshki M and Igartua J M 2003 J. Phys.: Condens. Matter 15 6199 Rodriguez-Carvajal J 1993 Physica B 192 55 Salje E K H 1990 Phase Transitions in Ferroelastic and Co-Elastic Crystals (Cambridge: Cambridge University Press) p 283