payment cards equipped with on-board audio or light sensors. Keywords: NFC ... functionality. In particular, the use of NFC-equipped mobile devices as payment.
Secure Proximity Detection for NFC Devices based on Ambient Sensor Data Tzipora Halevi1 , Di Ma3 , Nitesh Saxena2 , and Tuo Xiang3 1
Polytechnic Institute of New York University 2 University of Alabama at Birmingham 3 University of Michigan-Dearborn
Abstract. In certain applications, it is important for a remote server to securely determine whether or not two mobile devices are in close physical proximity. In particular, in the context of an NFC transaction, the bank server can validate the transaction if both the NFC phone and reader are precisely at the same location thereby preventing a form of a devastating relay attack against such systems. In this paper, we develop secure proximity detection techniques based on the information collected by ambient sensors available on NFC mobile phones, such as audio and light data. These techniques can work under the current payment infrastructure, and offer many advantages. First, they do not require the users to perform explicit actions, or make security decisions, during the transaction – just bringing the devices close to each other is sufficient. Second, being based on environmental attributes, they make it very hard, if not impossible, for the adversary to undermine the security of the system. Third, they provide a natural protection to users’ location privacy as the explicit location information is never transmitted to the server. Our experiments with the proposed techniques developed on off-the-shelf mobile phones indicate them to be quite effective in significantly raising the bar against known attacks, without affecting the NFC usage model. Although the focus of this work is on NFC phones, our approach will also be broadly applicable to RFID tags or related payment cards equipped with on-board audio or light sensors. Keywords: NFC, RFID, relay attacks, context awareness, sensors
1
Introduction
Radio Frequency Identification (RFID) systems are becoming increasingly ubiquitous in both public and private domains enabling computerized identification of objects and individuals. An RFID system usually consists of RFID tags and readers. Tags are miniaturized wireless radio devices that store information, such as a unique identification number, about their corresponding subject. Readers broadcast queries to tags in their radio transmission ranges for information contained in tags and tags reply with such information. Some of the prominent RFID applications include supply chain management (inventory control) [6], epassports [22], credit cards [5], driver’s licenses [23, 19], vehicle systems (toll
2
Tzipora Halevi, Di Ma, Nitesh Saxena, and Tuo Xiang
collection or car key) [7, 11, 9], access cards (building, parking or public transport) [20], and medical implants [16]. NFC, or Near Field Communication [10], is an upcoming RFID technology which allows devices, such as smartphones, to have both RFID tag and reader functionality. In particular, the use of NFC-equipped mobile devices as payment tokens (such as the Google Wallet app) is considered to be the next generation of payment system and the latest buzz in the US financial industry. Technological companies, such as Google and Apple, financial institutions, such as JPM, Visa, Mastercard and Citi, and telecommunication providers, such as Verizon and TMobile, have worked together and started launching test programs of NFC based payment system in the US [8]. It is predicted that mobile payments using NFC will reach $670 billion by 2015 [2]. Due to the inherent weaknesses of underlying wireless radio communication, NFC systems are plagued with a wide variety of security and privacy threats similar to the RFID systems [12]. In particular, the threat of relay attacks on such devices is real. One class of these attacks is referred to as “ghost-andleech” [13]. In this attack, an adversary, called a “leech,” relays the information surreptitiously read from a legitimate RFID tag to a colluding entity known as a “ghost.” The ghost can then relay the received information to a corresponding legitimate reader and vice versa in the other direction. This way a ghost and leech pair can succeed in impersonating a legitimate RFID tag without actually possessing the device. The focus of this paper is on a more severe form of relay attacks, called “reader-and-ghost”. It involves a malicious reader and an unsuspecting owner intending to make a transaction [4]4 . In this attack, the malicious reader, serving the role of a leech and colluding with the ghost, can fool the owner of the card into approving a transaction which she did not intend to make (e.g., paying for a diamond purchase made by the adversary while the owner only intends to pay for food). We note that addressing this problem requires transaction verification, i.e., validation that the tag is indeed authorizing the intended payment amount. The feasibility of executing reader-and-ghost attacks has already been demonstrated on the Chip-and-PIN credit card system [4]. With an expected ubiquitous deployment of NFC systems, there is a pressing need for the development of security primitives to defeat the relay attacks. Doing so, however, presents a unique and formidable set of challenges. Although the NFC devices are not as constrained as the stand-alone RFID tags, the inherent difficulty stems from the unusual usability requirements imposed by NFC applications (originally geared for automation). Consequently, solutions designed for NFC systems need to satisfy the requirements of the underlying applications in terms of not only efficiency and security, but also usability.
4
In contrast to the “ghost-and-leech” attack, the owner in the “reader-and-ghost” attack is aware of the interrogation from the (malicious) reader.
Secure Proximity Detection for NFC Devices based on Ambient Sensor Data
1.1
3
Sensing-Enabled Automated Defense
Although a variety of solutions to address the reader-and-leech attacks exist, many of them do not fully meet the requirements of the underlying NFC applications in terms of (one or more of): efficiency, security and usability. We discuss prior work in Section 2. In an attempt to resolve this situation, this paper proposes the use of sensing technologies for preventing reader-and-ghost relay attacks without necessitating any changes to the traditional NFC phone usage model, i.e., without incorporating any explicit user involvement beyond what is practiced today. The premise of our work is a current technological advancement that enables many NFC phones with low-cost sensing capabilities. Various types of sensors have been incorporated on many NFC phones, including accelerometers, microphones, and light sensors. This new generation of NFC phones can facilitate numerous promising applications for ubiquitous sensing and computation. They also suggest new ways of providing security and privacy services by leveraging the unique properties of the physical environment or physical status of the phone (or its owner). The physical environment measured by these sensors offers a rich set of attributes that are unique in space, time, and to individual objects. These attributes – such as sound and light – reflect either the current condition of a phone’s surrounding environment or the condition of the phone (or its owner) itself. An NFC phone can therefore acquire useful contextual information, and this information can be utilized for enhanced security. 1.2
Our Contributions
In this paper, we show that the contextual information can be effectively leveraged to defend against the reader-and-ghost attacks on NFC devices. Specifically, we develop a new transaction verification mechanism that can determine the proximity (or lack thereof) between a valid server and a valid phone by correlating certain sensor data extracted from the two devices. This is based on the assumption that certain ambient information, extracted by the NFC device and reader at the same time (transaction time), will be highly correlated if the two devices are in close physical proximity. Said differently, if a certain sensor attached to the server and the same type of sensor attached to the phone report mismatching ambient information, this will indicate that the server and phone are (most likely) not at the same location or close to each other. In particular, we demonstrate that audio sensors (microphones) and ambient light sensors can be effectively used for such transaction verification. We present several techniques that can be used for determining similarity between two short audio signals as well as between the light data extracted by the valid NFC phone and valid reader, and show that these techniques are quite useful in significantly raising the bar against the reader-and-ghost attacks. Our approach can be seamlessly deployed on the current payment infrastructure, and offers many advantages. First, it does not require the users to perform explicit actions, or make security decisions, during the transaction –
4
Tzipora Halevi, Di Ma, Nitesh Saxena, and Tuo Xiang
just bringing the devices close to each other is sufficient. Second, being based on environmental attributes, the approach makes it very hard, if not impossible, for the adversary to undermine the security of the system. Third, it provides a natural protection to users’ location privacy as the explicit location information is never transmitted to the server. Our experiments with the proposed techniques developed on popular mobile platforms (Java ME and Android) indicate them to be fairly robust to errors and effective for off-the-shelf mobile phones. 1.3
Scope of Our Work
Errors are inherent to any context recognition approach. Our approach is no different in this regard in that it would yield non-zero, although quite low, false positive and false negative rates in practice. Thus, the proposed approaches can not guarantee absolute security and usability. However, our technique significantly raises the bar even for sophisticated adversaries without affecting the NFC phones usage model. Moreover, although the proposed technique can work in a stand-alone fashion, it can also be used in conjunction with other security mechanisms, such as cryptographic distance bounding protocols [4], to provide stronger cross-layer security protection. In addition, our proximity detection approach is broadly applicable in the realm of other wireless (or wired) devices equipped with sensors. 1.4
Paper Outline
The rest of the paper is organized as follows. We review related work in Section 2. We present, in Section 3, the current payment system and our threat model, and provide a higher level overview of our proximity detection approach. Next, we elaborate on our proximity detection techniques based on audio and light sensor data in Section 4. Finally, we report on our experimentation and associated results in Section 5, followed by a discussion in Section 6. Section 7 provides concluding remarks.
2
Related Prior Work
In this section, we discuss prior work that is applicable to address the problem of reader-and-ghost attacks. The distance bounding protocols have been explicitly proposed for preventing reader-and-ghost relay attacks [4, 7]. A distance bounding protocol is a cryptographic challenge-response authentication protocol which allows the verifier to measure an upper-bound of its distance from the prover [1]. (We stress that traditional “non-distance-bounding” cryptographic authentication protocols are completely ineffective in defending against relay attacks). Using this protocol, a valid RFID reader can verify whether the valid tag is within a close proximity thereby detecting both ghost-and-leech and reader-and-ghost relay attacks [4, 7]. However, these protocols may not be currently feasible on commodity devices (such as NFC phones) due to their high sensitivity to time delay or need for special-purpose hardware.
Secure Proximity Detection for NFC Devices based on Ambient Sensor Data
5
A straight-forward solution to the reader-and-ghost attacks is to show the transaction details (e.g., the amount of transaction) on the NFC device itself [18], and have the user validate the details. This approach, however, is problematic because it requires explicit user involvement that may lead to the success of an attack. In particular, users will need to compare the amount/currency displayed on the reader’s screen and that on their NFC phone’s screen. If they make an error in the comparison, they may still be susceptible to the attack. Human users are known to make such mistakes (as demonstrated in [14]). As suggested in [4], and demonstrated in [15], GPS data can be used in a straight-forward manner to determine whether the NFC phone and the reader are in close proximity. As opposed to our sensor-centric approach, however, the use of GPS data relies on an additional infrastructure (GPS). GPS is also known to not work well in an indoor environment (which is where the payment transactions take place commonly). Moreover, since GPS information is directly sent to the payment server, this approach raises location privacy concerns – users’ location during the transaction is revealed to a potentially untrusted third party. Our idea of secure proximity detection based on sensor information is related to the Bump application [21]. This application associates two phones based on a mutually shared “bump” event. However, there are significant differences between the two approaches. First, we work with audio/light data, while Bump uses accelerometer as well as GPS data. Second, we do not require users to explicitly Bump their devices; rather only bringing the phone close to the reader is sufficient (a gesture that already needs to be performed as part of the payment process). Third, we develop open-source sensor data correlation and similarity detection techniques, whereas the techniques employed by the Bump server are not transparent.
3 3.1
Background and Overview Payment Infrastructure, and Threat Model
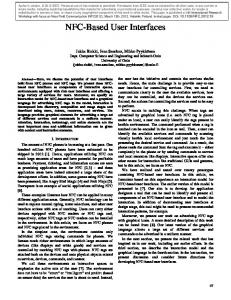
EMV, named after its creators, Europay, Mastercard and Visa, is a global standard for debit and credit card payments. Payment systems based on EMV have been introduced across the world, known by a variety of different names such as “Chip and PIN” [4]. Mastercards PayPass is another EMV compatible “contactless” payment protocol. Figure 1 presents a simplified version of the EMV-based mobile payment system which consists of three entities of interest: the cardholder, the merchant and the issuer bank which issues the card. The payment application (such as Google Wallet) on the NFC-enabled phone of a cardholder stores the details such as the credit card number, name of the owner, and expiration date. It also stores a symmetric key shared with its issuer bank. The Point-of-Sale (PoS) terminal at the merchant side is equipped with NFC Contactless Readers (such as MasterCard PayPass). A transaction starts with the merchant issuing a challenge to the payment app. The app calculates a cryptographic response based on the challenge and other information using the key
6
Tzipora Halevi, Di Ma, Nitesh Saxena, and Tuo Xiang
shared with the issuer bank. It then transfers the response to the merchant terminal using the NFC chip on the mobile device. The response is next forwarded by the terminal to the issuer bank which verifies the response and approves the transaction, if authentication is successful. In the rest of this paper, we use the terms card, card holder and (NFC) phone interchangeably, all depicting the valid user’s device involved in a transaction.
$ result response
Bank
challenge response= (challenge, …)key
cardholder
merchant
Fig. 1. Online authorization in a mobile payment system
Our proposed approach can work under the current payment infrastructure. It is meant to defend specifically against the reader-and-ghost attacks which NFC payment systems are susceptible to. We call the NFC card (reader) under attack a valid card (reader), and call the tag (reader) controlled by the adversary as malicious card (reader). Under the threat model of the reader-and-ghost attack, originally called the “mafia fraud” attack [3, 4], the adversary controls a malicious reader and card pair, just like in the ghost-and-leech attack. However, the malicious reader controlled by the reader-and-ghost adversary is a legitimate reader or believed by the valid card to be a legitimate reader. Hence, the valid card (or its owner) is aware of and agrees to communicate with the malicious reader. That is, interrogations from the malicious reader to the valid card are not surreptitious as in the ghost-and-leech attacks. The goal of the adversary is still to impersonate the valid card. We assume that the adversary does not have direct access to the valid card. So tampering or corrupting the card physically is not possible, or can be easily detected. The adversary is also unable to tamper the card remotely through injected malicious code. We further assume that the adversary is unable to spoof
Secure Proximity Detection for NFC Devices based on Ambient Sensor Data
7
the ambient sensor signals, such as by changing the environmental conditions. We also do not consider loss or theft of card. In addition to security, our threat model also considers the privacy of the card owners. In particular, a (malicious) bank server may be interested in determining the location of a card owner at the time of transaction, and track the whereabouts of the owner. Thus, transmitting explicit location information to the bank server, such as when using the GPS sensors, would be prone to location privacy attacks.
3.2
Overview of Our Approach
As mentioned above, our approach can work under the current mobile payment infrastructure. The card (NFC phone) already shares a symmetric key with its issuer bank. We only require that both the card and terminal measure certain location-dependent information using on-board sensors (such as audio and ambient light). Location-dependent data captured by both sensors are then forwarded to the bank. The bank server decides whether to approve the transaction after “comparing” the data received from the two ends. Figure 2 provides an overview of our approach. The user-side sensor generates its location-dependent information loccard while the merchant-side sensor generates its version of locationdependent information locmerchant . loccard is protected (e.g., via MAC) with the key shared with the issuer bank before it is sent to the merchant’s terminal which then forwards its own location information locmerchant along with the (phone’s) card credentials to the bank for transaction verification and authorization. Since the integrity of loccard is protected by the shared key between the card and bank, a malicious reader would be unable to change this value.
$ result response, loccard, locmerchant
bank
merchant-side sensor: locmerchant
user-side sensor: loccard
challenge response= (challenge, loccard …)key
cardholder
merchant
Fig. 2. Online authorization in a mobile payment system enhanced with our proximity detection approach
8
4 4.1
Tzipora Halevi, Di Ma, Nitesh Saxena, and Tuo Xiang
Proximity Detection Techniques Correlation Using Audio
We explore the use of audio sensors (microphones) for accomplishing the aforementioned approach to proximity detection. This choice is motivated by the intuition that the audio data captured at two different locations at a given time is different to some extent. We first need to determine if the audio recordings captured from the same location have higher similarity than recordings taken at different locations. To this end, we investigate a few methods to detect such similarity including: timebased methods, frequency-based methods as well as a combined time-frequency method. Time-Based Similarity Detection: To detect the similarity between the timebased signals Xi and Xj , we propose using two methods: correlation and difference. The signals will first be normalized according to their energy (so that each signal had a total energy equal to 1). Then, in the first method, the correlation between each two signals will be calculated and the maximum correlation will be used. Therefore, the correlation based similarity between two signals Xi and Xj can be measured by: Sc (i, j) = max(Cross-Corr(Xi , Xj )) and Dc (i, j) = 1 − Sc (i, j)
(1)
In the second method, the distance between each bit of the signals is calculated and the overall Euclidean norm of the distance is used as below: Dd (i, j) = kXi − Xj k and Sd (i, j) = 1 − Dd (i, j)
(2)
Frequency-Based Similarity Detection: In the frequency-based detection approach, we use Fast Fourier Transform (FFT) to create the frequency coefficients for each recorded signal. We then use both the correlation and the difference between the FFT coefficients in order to evaluate the similarity between different segments taken at the same place (in consecutive time periods) vs. recordings taken at different locations. Time-Frequency Based Similarity Detection: This novel method combines both the time and frequency based measurements to create a point in 2-D space. In this technique, the overall time-frequency similarity measure is calculated by: q D(i, j) = (Dc,time (i, j))2 + (Dd,f requency (i, j))2 and S(i, j) = 1 − D(i, j) (3) This implies that the similarity measurement will be higher for closer signals. 4.2
Correlation Using Ambient Light
We also explore the use of light sensors for the purpose of proximity detection. This choice is inspired by an observation that different types of places may
Secure Proximity Detection for NFC Devices based on Ambient Sensor Data
9
have different lighting conditions. For example, fast food restaurants usually use bright lights to attract customers and to signify a place bustling with activity and very fast service, while fine dinning restaurants typically use low-intensity of light to create an intimate and leisurely atmosphere. As lighting conditions are location dependent, the ambient light can be used as the contextual information to determine the proximity between two devices (or a lack thereof). Unlike ambient audio which can be heavily affected by surrounding human/nonhuman activity, indoor ambient light (without natural light) is intuitively quite steady over time as the lighting infrastructure usually remains untapped – this intuition is later validated through the experiments as illustrated in Section 5.1. Hence, in this case, we use a simple strategy that involves just comparing the mean value of the illuminance data to determine whether ambient light readings captured from the same location have higher similarity than recordings taken at different locations. Let Li and Lj be the mean value of illuminance data captured in a short time interval by two devices at location i and j. The difference of mean value is calculated as: D(i, j) = |Li − Lj | (4) As long as D(i, j) is below a threshold, we consider the two readings to be similar enough and believe that they are captured from the same location. Otherwise, the two readings are believed to be captured from different locations. We will discuss how to establish the threshold via experiments in Section 5.1.
5
Experiments and Results
To evaluate our Near Field Communication (NFC) phone sensor data correlation techniques, we develop a proof-of-concept prototype on mobile phones, which allows us to collect data from different locations, and demonstrate the feasibility of our proximity detection approach. 5.1
Audio Data Experiments
In this section, we present our evaluation of the techniques for transaction verification based on audio data correlation. Data Collection: The goal of sensor data correlation is to detect whether the valid card (phone) and valid reader are at the same or different locations. Therefore, we needed to collect the sensor data when the two devices are located in close physical proximity as well as when they are at two different locations. We work with two mobile phones (two Nokia N97s), simulating a valid NFC device and a valid RFID reader. To enable recording of background sounds using the phones, we developed a program that captures audio from the phone’s built-in microphone and installed it on two mobile phones. The program was designed to record up to 30 seconds of continuous audio data. The audio-capturing programs were launched on both
10
Tzipora Halevi, Di Ma, Nitesh Saxena, and Tuo Xiang
phones and activated at about the same time to record the samples (the phones were synchronized by means of a wireless signal). We recorded, with the microphones, a few audio samples at different locations. We needed to determine if it was possible to distinguish between recordings taken at the same location versus at different locations. We first examined the likelihood that different techniques can be used to find similarities between recordings taken at the same location and differentiate between recordings taken at separate locations. To determine the performance of the different techniques and find the optimal one, we initially created our “first dataset”. For this, we used 7 groups of 20 1-sec recordings (for a total of 140 distinctive 1-sec audio recordings). Each group of recordings was captured at a separate location at consecutive time periods. The recordings were taken from 5 different locations, including a few retail stores and fast food restaurants. Specifically, we recorded surrounding noise at: McDonald’s and Target (samples captured at two different occasions in each of the two), Wendy’s, and our university cafeteria and library. We explored a few signal processing methods to detect the similarities between the different recordings taken at the same location at consecutive time periods vs. the similarities between recordings taken at different locations. The dataset was used to test the different techniques and find the optimal detection method. To test the performance of the detection method in both a normal usage scenario (i.e., when no attacks occur) as well as in attack scenario, we created a “second dataset”. For this dataset, we again took recordings at different locations with two phones simultaneously, separated by a distance of 3-12 inches. In this case, we collected the data from 5 different locations, including a concert hall, library (at two different locations), Mcdonalds and a coffee shop. We recorded at each location 20 1-sec segments from the two sensors simultaneously (located a few inches apart), capturing a total of 200 separate (100 pairs) 1-sec audio recordings. All recorded audio files were then converted from the 3GPP format to the WAV format to be fed into our matlab algorithms for signal correlation (discussed in Section 4.1). Conversion from 3GPP to WAV, unlike the inverse, is considered lossless, since there is no compression used in WAV format. Thus, no important information was lost during this conversion. Performance of Similarity Detection Techniques: We test the performance of various techniques, outlined in Section 4, to identify which one can most accurately detect the similarity between recordings taken at the same location. Specifically, in every test group, we use 5 pairs of 1-sec recording segments. The two samples in each pair were taken by two different sensors at the same location simultaneously (each pair was recorded at a separate location). For all the techniques, we calculated the probability that the recording, identified as the most similar one to a given recording, was the recording taken at the same location. We ran the test for the dataset collected previously. Our results showed that the time-based “correlation” (Equation 1) gave better result (38% detection rate)
Secure Proximity Detection for NFC Devices based on Ambient Sensor Data
11
compared to the “distance” (Equation 2) between the signals (which resulted in detection rate of 14%). Also, our tests showed that frequency-coefficients based distance yielded better results (50% detection rate) compared to time-based methods and to frequency-based distance methods (which resulted in 39% detection rate). Finally, our tests also demonstrated that the result corresponding to time-frequency classification is superior to all other methods, with a successful detection rate of 53%. In the rest of our analysis, therefore, we use the time-frequency based technique. Performance of Audio-based Proximity Detection: We next used the test dataset to determine the performance of our time-frequency detection on data taken under normal usage as well as attack scenario. We calculated the timefrequency distance measure between each two different samples. We found the square distance D(i, j)2 (Section 4.1) and used it as our data features. For each pair of locations, we calculate the mean of the square distance. We generated a confusion matrix for our dataset as shown in Table 1. Table 1. Confusion Matrix of Square Time-Frequency Distance
Concert Hall Library McDonalds Library (2) Cafe Concert Hall Library McDonalds Library (2) Cafe
0.4678 1.7889 1.8645 1.7556 1.8412
1.7889 0.8539 1.7878 1.6753 1.7545
1.8645 1.7878 0.6018 1.7962 1.7241
1.7556 1.6753 1.7962 0.8213 1.8140
1.8412 1.7545 1.7241 1.8140 0.5289
To distinguish between recordings taken at the same approximate location we compare the time-frequency square distance between each recorded signal and the one taken by the second microphone at the same location as well as with all the recordings taken at different locations. We construct the similarity matrix s using the similarity measurements and use it as our feature data. We use the input data to train the classifier to find the similarity threshold for each couple of samples. We use the SimpleLogistics classifier from the WEKA package to classify the samples. We run a 10-fold classification, which partitions the data into 10 partitions, trains the classifier over 9 of the partitions (which act as the training set) and classify the remaining samples (the testing set). This is repeated for each partition and training set in the dataset. We note that the classifier arrived at a simple classification formula: if y = 11.49 × Corr − 8.69 < 0, then both samples will be considered to be taken at the same place. Otherwise, they will be considered to be taken at different locations. This is a simple calculation (one multiplication and one addition) and will take the server a negligible amount of time to validate whether both samples were captured at the same location. Using the classifier results, we find the detection rate for each pair of locations in which the samples were taken (where one sample is captured in each location). The detection rate is calculated over all the pairs of samples which were taken at
12
Tzipora Halevi, Di Ma, Nitesh Saxena, and Tuo Xiang
the two locations, by dividing the number of pairs of samples that were correctly classified by the number of total pairs of samples (taken at those locations). The result of the correct recognition rates can be found in Table 2. As can be seen from the table, our audio signal based correlation technique yields 100% detection rate. Table 2. Experimental result of “positives” using WEKA SimpleLogistics classifier
Concert Hall Library McDonalds Library (2) Cafe Concert Hall Library McDonalds Library (2) Cafe
100% N/A N/A N/A N/A
100% 100% N/A N/A N/A
100% 100% 100% N/A N/A
100% 100% 100% 100% N/A
100% 100% 100% 100% 100%
False Accept Rate vs. False Reject Rate: We next determined the probabilities of incorrectly approving the transaction with an unauthorized phone and rejecting the transaction with an authorized phone, by calculating the False Accept Rate (FAR) vs. the False Reject Rate (FRR). FAR is the sum of false positives, which occur when the audio signal captured by a valid reader matches the audio signal captured by a phone, even when the two devices are at different locations. FRR, on the other hand, is the sum of false negatives, and denotes the probability that the transaction is rejected even when the valid phone and valid reader are in close physical proximity. Using the classifier results, since our detection rates are 100%, our FAR and FRR are both clearly equal to 0%. This indicates that our audio-based proximity detection technique is very robust. 5.2
Light Data Experiments
In this section, we present our evaluation of the techniques for transaction verification based on light data correlation. Data Collection: We conducted this set of experiment with two mobile phones (Google Nexus S) which are equipped with ambient light sensors. The light sensor on the phone is generally utilized for the purpose of auto-adjustment of screen brightness. We develop a simple Android application to capture data readings from the light sensor. The sampling rate is set to be 25 Hz which records 50 data points every 2 seconds. As in the audio test, to simulate a normal usage, we used two phones representing the valid NFC phone making the transaction and the valid reader. They are separated by a distance of 3-12 inches and hand-held during the transaction. To simulate attack scenarios, we recorded light data at five different locations with different business types: two different types of restaurants (fast food restaurant vs. fine dining restaurant), two different types of retailer stores (supermarket vs. department store) and a car dealership. Our purpose is to find
Secure Proximity Detection for NFC Devices based on Ambient Sensor Data
13
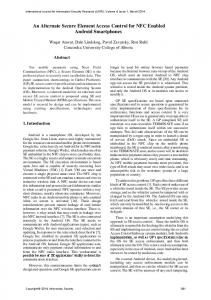
(dis)similarity in term of lighting conditions at locations of different business types. Threshold Establishment: Figures 3 and 4 prove our intuition that lighting conditions are location-dependent. Curves in Figure 3 illustrates that lighting data collected from the aforementioned five different locations. Although light readings at a specific location fluctuate around a baseline, these curves are parallel to one other and clearly disparate which means the mean value can be used to distinguish different locations. Illuminance readings can be affected by several factors. The first is that the user cannot hold the phone firmly static. So the orientation of the phone and its relative position to the surrounding light sources can change which can affect the light sensor readings. Also, at different types of locations, surrounding human movements such as hand waving, may induce shadowing effect on the sensor causing changes to the data readings. Figure 4 shows the mean value of the data we collected from various locations and it gives us a more direct view of how the mean values of illuminance differ at different locations. As described in Section 4.2, the transaction should be approved when the difference of mean values captured by two sensors is below a threshold, which indicates that the phone and the reader are at the same place. The transaction should be terminated otherwise, i.e., if the difference of mean values is above the threshold. To establish the threshold, we recorded 10 samples of light data, each consisting of 50 data points over a period of 2 seconds, on both devices at each location selected. From the captured data, we generate a confusion matrix as shown in Table 3. Values across the diagonal represent the average mean difference when phone and reader are at the same location while the others represent the average mean difference when the two devices are at different locations. From the table, we can observe that the threshold could be chosen in the range between 20.6 and 55.3 (lux) if we want to distinguish between these locations. The lower bound (20.6) is the maximum difference when the two phones are placed at the same location while the upper bound (55.3) is the minimum difference when phones are put at two different locations. We picked 38 lux as the threshold value, and measure the performance of light-based proximity detection as discussed in the next section. We note that an interesting observation from the table is that the brighter the place, the higher is difference of readings captured by two devices at the said location. Performance of Light-based Proximity Detection: We further collected 40 samples of light data on both phones at each location. We then calculate their mean difference according to Equation 4 and compare the result using the threshold value 38. Similar to the audio tests, we next find the detection rate for each pair of locations in which the samples were taken (where one sample is captured in each location). The detection rate is calculated over all the pairs of samples which were taken at the two locations, by dividing the number of pairs of samples that were correctly classified by the number of total pairs of samples (taken at those locations). Our experimental results of the light-based detection rate is shown in Table 4.
14
Tzipora Halevi, Di Ma, Nitesh Saxena, and Tuo Xiang 700
Fast Food Restaurant Department Store Dinner Restaurant Supermarket Car Dealer Store
600
Illuminance [lux]
500
400
300
200
100
0 0
10
20 30 Sample Points
40
50
Fig. 3. Illuminance data over time at different locations 400
350
300
Illuminance [lux]
250
200
150
100
50
0 Fastfood Restaurant
Dinner Restaurant
Department Store
Supermarket
Cardealer
Fig. 4. Mean illuminance at different locations
False Accept Rate vs. False Reject Rate: We next determined the FAR and FRR for the light-based detection method, similar to the case of our audio data tests. We found that our FAR is equal to 6.5% while the FRR is equal to 5%. This means that the light-based detection is likely to fail, both under normal scenario and attack scenario, although on only on a small fraction of times. Although these error rates are non-zero and higher than that produced by our audio-based correlation technique, these results generally demonstrate good recognition rates, especially for locations with smaller mean difference such as fine dining and department store.
6 6.1
Discussion Audio vs. Light Data Proximity Detection
Our results show that audio and ambient light can serve as two different means of detecting proximity between two NFC devices involved in a transaction. Both
Secure Proximity Detection for NFC Devices based on Ambient Sensor Data
15
Table 3. Confusion Matrix of Mean Difference (lux)
Fine Department Supermarket Fast Food Car Dining Store Dealer Fine Dining DepartmentStore Supermarket Fast Food Car Dealer
1.1 71.0 283.5 291.9 347.1
71.0 6.4 163.6 220.9 276.1
283.5 163.6 9.9 58.3 113.5
291.9 220.9 58.3 17.0 55.3
347.1 276.1 113.5 55.3 20.6
Table 4. Experimental results of “positives” based on mean differences (threshold 38 lux)
Fine Department Supermarket Fast Food Car Dining Store Dealer Fine Dining DepartmentStore Supermarket Fast Food Car Dealer
100% N/A N/A N/A N/A
97.5% 100% N/A N/A N/A
100% 100% 95% N/A N/A
100% 100% 100% 100% 82.5% 95% 92.5% 60% N/A 87.5%
result in quite low error rates, FAR as well as FRR, demonstrating the effectiveness of our approach. In fact, our experiments with the audio-based proximity detection approach yields no errors at all. This suggests that audio is a potentially stronger signal for detecting the proximity of two devices when compared to light. The robustness of audio in this regard could be attributed to the fact that audio at two distinct locations is highly distinct in nature. On the other hand, the use of light is likely to result in a few false accepts in scenarios where the lighting conditions of two distinct locations is similar enough, and in a few false rejects in scenarios where the orientation of two close by phones affects their recorded light readings. These results imply that when using our audio-based approach, it will be very difficult, if not impossible, for the attacker to succeed in launching the readerand-ghost relay attack. When using the light sensor, in contrast, the adversary will need to choose a remote location having very similar lighting conditions as the one where a valid card is located at the time of transaction. This restriction, however, still significantly complicates the task of the attacker. Nevertheless, the specific attack demonstrated in [4] where the valid card is at a restaurant and the valid reader is at a jewellery store can be easily prevented when using our light based approach. We note that our data was taken at locations typical to financial transactions. These are likely to be commercial environments, such as restaurants, shops and department stores. Since these are environments with customers, there will likely always be some background noise (e.g., due to people talking) which will be
16
Tzipora Halevi, Di Ma, Nitesh Saxena, and Tuo Xiang
captured by the sensors. Therefore, this demonstrates a promising feasibility of our approach. While we can not completely rule out the probability of a false accept, our results show that it is unlikely that the attacker can capture similar enough audio data at a far-off location. 6.2
Location Privacy of Card Owners
As discussed in Section 3, our threat model covers the privacy of the card owners when making transactions. In particular, we are interested in protecting the location privacy of the card owners from a malicious bank server during the transaction process. Our sensor-centric proximity detection approach indeed provides a natural protection in this regard. In fact, we do not even need to use private proximity testing protocols proposed in the literature [17]. This is due to the fact that our approach does not require the card or the reader to transmit their explicit location information (unlike the GPS-based approach of [15]). Rather, only the captured audio or light readings are sent to the server. Although these readings possess some correlation with the exact location, it seems very difficult to infer this location just by analyzing these readings. This is especially true for the audio readings since they fluctuate over time drastically. The only possibility for the attacker to learn the location of the owner in this case is to be physically present at the said location at the time of transaction. 6.3
Manipulating Physical Environment
If the adversary can tamper with the physical environment, at the side of the valid card (NFC phone) and/or valid reader, it can enforce the two devices to capture similar enough data even from different locations. For example, if the adversary can induce similar lighting or acoustic conditions at two different locations at the time of the transaction, then it may succeed in launching the reader-and-leech attack. However, tampering with such environmental attributes (light or audio) looks like a daunting task. It may require sophisticated equipment as well as close proximity to the devices and will likely be easily detected. We believe this characteristic to be an inherent strength of our proximity detection approach. 6.4
Other Sensors
It is a natural question as to what other sensors are suitable for the purpose of proximity detection. Temperature sensors are likely not going to be useful because indoor temperatures at different locations do not vary significantly. We also tried to use magnetic field data in this context, given that most modern phones come equipped with magnetometers. However, we could not find any method to detect the similarity between measurements taken at the same location (at consecutive time periods) vs. measurements taken at different locations. Therefore, we conclude
Secure Proximity Detection for NFC Devices based on Ambient Sensor Data
17
that a magnetometer does not provide data which can be used reliably to derive a location-specific information. This is because the magnetic sensor readings are dominated by the Earth’s background magnetic field, which do not change significantly across different locations. Odor sensors might be more promising for our application. However, we are not aware of any commercial phones that possess odor sensors as yet.
7
Conclusions
In this paper, we developed a secure proximity detection approach based on the information collected by audio and ambient light sensors available on NFC mobile phones. This approach is geared for preventing reader-and-ghost attacks, and offer many advantages. First, it does not require the users to perform explicit actions during the underlying operation – just bringing the devices close to each other is sufficient. Second, being based on environmental attributes, our approach makes it very hard, if not impossible, for the adversary to undermine the security of the system. Third, it provides a natural protection to users’ location privacy as the explicit location information is never transmitted to the server. Our evaluation of the proposed mechanism on common mobile platforms demonstrate its feasibility in effectively and significantly raising the bar against the reader-and-ghost attacks without negatively affecting the currently employed usage model of the underlying NFC applications. In particular, we found the audio-based detection to be quite powerful. In the future, we plan on identifying other sensors (besides microphones and light sensors), and combinations thereof, that can be used for the purpose of proximity detection.
Acknowledgments We thank Moti Yung and ESORICS’12 anonymous reviewers for their valuable feedback. We also thank Sam Cleaveland, Justin Lin and Chatchai Satienpattanakul for their help with audio data collection.
References 1. S. Brands and D. Chaum. Distance-bounding protocols. In Advances in Cryptology - EUROCRYPT, International Conference on the Theory and Applications of Cryptographic Techniques, 1993. 2. M. Calamia. Mobile payments to surge to $670 billion by 2015. Available online at http://www.mobiledia.com/news/96900.html, Jul. 2011. 3. Y. Desmedt, C. Goutier, and S. Bengio. Special uses and abuses of the fiatshamir passport protocol. In A Conference on the Theory and Applications of Cryptographic Techniques on Advances in Cryptology (CRYPTO), 1988. 4. S. Drimer and S. J. Murdoch. Keep your enemies close:Distance bounding against smartcard relay attacks. In 16th USENIX Security Symposium, August 2007. 5. EMVCo. About EMV. Available online at http://www.emvco.com/about_emv. aspx, November 2009.
18
Tzipora Halevi, Di Ma, Nitesh Saxena, and Tuo Xiang
6. epic.org. Wal-Mart begins tagging and tracking merchandise with RFID. Available online at http://epic.org/2010/07/wal-mart-begins-tagging-and-tr. html, July 2010. 7. A. Francillon, B. Danev, and S. Capkun. Relay attacks on passive keyless entry and start systems in modern cars. Cryptology ePrint Archive, Report 2010/332, 2010. http://eprint.iacr.org/. 8. J. Gilman. Next-gen payments. Technical report, Tuck School of Business at Dartmouth, 2011. 9. Infowars.com. Texas Department of Transportation to instate RFID TxTag. Available online at http://www.infowars.com/articles/bb/toll_roads_tx_tag.htm, September 2005. 10. ISO. Near field communication interface and protocol (nfcip-1)——iso/iec 18092:2004. Available online at http://www.iso.org/iso/catalogue_detail. htm?csnumber=38578, 2004. 11. ITGlobal Consulting LTD. RFID toll road payment. Available online at http: //www.itglobalconsulting.com/rfidtollroadpayment.asp. 12. A. Juels. RFID security and privacy: A research survey. IEEE Journal on Selected Areas in Communications, 24(2):381–394, February 2006. 13. Z. Kfir and A. Wool. Picking virtual pockets using relay attacks on contactless smartcard. In Security and Privacy for Emerging Areas in Communications Networks (Securecomm), 2005. 14. A. Kobsa, R. Nithyanand, G. Tsudik, and E. Uzun. Usability of display-equipped rfid tags for security purposes. In European Symposium on Research in Computer Security, 2011. 15. D. Ma, A. K. Prasad, N. Saxena, and T. Xiang. Location-aware and safer cards: Enhancing rfid security and privacy via location sensing. In ACM Conference on Wireless Network Security (WiSec), to appear, April 2012. 16. Medical News Today. VeriChip corporation announces phase II development of in vivo glucose-sensing RFID microchip with RECEPTORS LLC. Available online at http://www.medicalnewstoday.com/articles/165894.php, October 2009. 17. A. Narayanan, N. Thiagarajan, M. Lakhani, M. Hamburg, and D. Boneh. Location privacy via private proximity testing. In Network and Distributed System Security Symposium (NDSS), 2011. 18. R. Nithyanand, G. Tsudik, and E. Uzun. Readers behaving badly: Reader revocation in PKI-based RFID systems. In European Symposium on Research in Computer Security (ESORICS), 2010. 19. NYS DMV. Enhanced driver licenses and non-driver identification cards. Available online at http://www.nydmv.state.ny.us/broch/C158.pdf, July 2010. 20. RFID Asia. New Ez-Link contactless smart cards converge transit and payment applications. Available online at http://journal.rfid-asia.info/2008/ 12/new-ez-link-contactless-smart-cards.htm, December 2008. 21. B. technologies Inc. Bump Application. 22. U.S. Department of State. The U.S. electronic passport. Available online at http: //travel.state.gov/passport/passport_2498.html. 23. Washington State Department of Licensing. Enhanced driver license/ID card. Available online at http://www.dol.wa.gov/about/news/priorities/edl.html.