[2] Understanding the mechanics of fine sediment infil- tration into gravel ..... each location were determined by the sampling technician. Table 2. Parameters for ...
Click Here
WATER RESOURCES RESEARCH, VOL. 44, W03424, doi:10.1029/2006WR005815, 2008
for
Full Article
Sediment supply and relative size distribution effects on fine sediment infiltration into immobile gravels John K. Wooster,1 Scott R. Dusterhoff,1 Yantao Cui,1 Leonard S. Sklar,2 William E. Dietrich,3 and Mary Malko1 Received 8 December 2006; revised 19 October 2007; accepted 12 December 2007; published 21 March 2008.
[1] We present results and analyses from flume experiments investigating the infiltration
of sand into immobile clean gravel deposits. Three runs were conducted, each successive run with the same total sediment feed volume, but a 10-fold increase in sand feed rate. The highest sand feed rate produced less sand infiltration into the subsurface deposits than the other two runs, which had approximately equivalent amounts of sand infiltration. Experimental data, combined with simple geometric relations and physical principles, are used to derive two relations describing the saturated fine sediment fraction in a gravel deposit and the vertical fine sediment fraction profile resulting from fine sediment infiltration. The vertical fine sediment fraction profile relation suggests that significant sand infiltration occurs only to a depth equivalent to a few median grain diameters of the bed material. Citation: Wooster, J. K., S. R. Dusterhoff, Y. Cui, L. S. Sklar, W. E. Dietrich, and M. Malko (2008), Sediment supply and relative size distribution effects on fine sediment infiltration into immobile gravels, Water Resour. Res., 44, W03424, doi:10.1029/2006WR005815.
1. Introduction [2] Understanding the mechanics of fine sediment infiltration into gravel deposits is critical for assessing the biologic and economic impacts from upstream anthropogenic and natural fine sediment releases in rivers. Riverine gravel deposits of appropriate grain sizes provide important spawning habitat for salmonids in the Pacific Northwest of the US and elsewhere [Kondolf and Wolman, 1993]. Adult salmonids bury their eggs into gravel deposits, which then incubate in the substrate for up to five months before hatching [Groot and Margolis, 1991]. Many factors may affect the survival of the salmonid eggs during this long hatching period, including excessive infiltration of fine sediment which may result in decreased egg survival due to reduced intra-gravel flow that brings oxygen to the embryos [e.g., Cooper, 1965; Koski, 1966; Greig et al., 2005a, 2005b, 2007; Sear et al., 2005] and difficulties for hatchlings (alevins) to emerge from the gravel deposit if they hatch successfully [Einstein, 1968; Phillips et al., 1975; Hausel and Coble, 1976]. In addition to negative influences on fish embryo survival, excessive fine sediment infiltration may also reduce invertebrate productivity, which serves as the primary food source for salmonids and other fish species [Gammon, 1970; Brusven and Prather, 1974; Bjornn et al., 1977]. There are also potential important economic ramifications associated with increased fine sed-
1
Stillwater Sciences, Berkeley, California, USA. Department of Geosciences, San Francisco State University, San Francisco, California, USA. 3 Department of Earth and Planetary Science, University of California, Berkeley, California, USA. 2
Copyright 2008 by the American Geophysical Union. 0043-1397/08/2006WR005815$09.00
iment infiltration into river bed sediments. For example, an increase in fine sediment infiltration may result in a decreased efficiency for infiltration wells that draw water directly beneath the river bed, imposing higher costs for pumping operations. This is currently a major issue in the ongoing planning and design of the removal of two dams on the Elwha River, Washington (Blair Greimann, personal communication, 6 July 2006). [3] Increased fine sediment infiltration into a gravel river bed can occur as a result of an increase in fine sediment supply. Such increases in sediment supply may come from chronically accelerated erosion due to land use [e.g., Walling, 1999] or from relatively short-term events such as landslides [e.g., Sutherland et al., 2002], accidental sediment release from reservoirs [e.g., Rathburn and Wohl, 2001], and sediment releases following dam removal [e.g., Cui and Wilcox, 2008]. With the continued decline in salmonid populations that may be at least partially attributed to increased fine sediment production and subsequent deposition and infiltration, a better understanding of the mechanisms of fine sediment infiltration into gravel-bedded channels is becoming increasingly important. [4] Several flume and field studies have previously investigated fine sediment infiltration into gravel deposits. One of the first studies of fine sediment infiltration was conducted by Einstein [1968] in a recirculating flume with a clean (i.e., initially void of any fine sediment) gravel channel bed set to a thickness of 1 to 2.7 times the coarsest gravel diameter. By feeding ground quartz (ranging from 0.0035 to 0.03 mm in diameter) over the clean gravel, Einstein [1968] observed that fine sediment settles first at the bottom of the flume in the interstices of gravel deposits and gradually fills the interstices upward. In a flume filled with 4.5- to 50-mm diameter gravel and feeding 0.2-mm and 0.5-mm diameter sand for infiltration, Beschta and
W03424
1 of 18
W03424
WOOSTER ET AL.: FINE SEDIMENT INFILTRATION INTO IMMOBILE GRAVELS
Jackson [1979] observed that fine sediment infiltrated to a depth of approximately 10 cm, or approximately twice the diameter of the coarsest bed material. Beschta and Jackson [1979] also observed that there was less then 8% sand in the deposit following infiltration of 0.5-mm sand but this number increased to 15% using the 0.2-mm sand for infiltration. This observation suggests that the size ratio of coarse sediment (i.e., framework of the sediment deposit) to fine sediment (i.e., infiltrating sediment) is important in determining the amount of fine sediment infiltration. [5] The field study of Frostick et al. [1984] examined fine sediment infiltration into gravel deposits with different bed material (subsurface) grain sizes while maintaining the same grain size for the surface layer. Their observations indicated more fine sediment infiltrated into the coarser subsurface deposits than into the finer subsurface deposits. While Frostick et al. [1984] proposed that higher fine sediment infiltration into the coarser subsurface might be a result of a lower surface-to-subsurface grain size ratio, the experiments of Beschta and Jackson [1979] suggest that the coarse sediment (i.e., bed material) to finer infiltrating sediment grain size ratio was the predominant parameter affecting infiltration differences between varying subsurface deposits. [6] Based on results using recirculating and non-recirculating flumes, Diplas and Parker [1985] concluded that an immobile gravel bed would eventually become saturated with fine sediment as long as fine sediment particles were available in the water column, irrespective of the fine sediment concentration in the water column. Diplas and Parker [1985] also confirmed Beschta and Jackson’s [1979] observation that the ratio of fine sediment to bed material grain sizes is an important parameter affecting the amount of fine sediment infiltration. [7] Observations of fine sediment infiltration in the field have also shown that fine sediment infiltration occurs to a limited depth within gravel beds. On the basis of field experiments from three streams in northern California, Lisle [1989] observed that fine sediment infiltration decreases with increasing bed load transport and proposed that sand trapped in the interstices of the top several centimeters of the deposit formed a seal that impeded deeper infiltration of much finer sediments. On the basis of flume studies, Carling [1984] and Scha¨lchli [1992] also concluded that fine sediment only infiltrates into a coarser bed to a limited depth. [8] Recent studies have shown the importance of the variability in bed particle sizes in the dynamics of fine sediment infiltration into gravel beds. By analyzing fine sediment content from a set of large-scale flume experiments presented by Seal et al. [1995] and Toro-Escobar et al. [1996], Cui and Parker [1998] found that the fine sediment fraction (FSF hereafter) in gravel deposits is negatively correlated to the standard deviation of particle diameters within the gravel deposit. Cui and Parker [1998] hypothesized that the standard deviation of a clean gravel deposit is a surrogate measure for pore space available for fine sediment to infiltrate, and the amount of fine sediment that can infiltrate into the deposit is directly correlated with the available pore space. [9] In an effort to explain the observations of fine sediment infiltration into gravel beds, researchers have developed theoretical and probabilistic models. Lauck
W03424
[1991] provided a hypothetical process for sand infiltration and developed a stochastic model to qualitatively explain the observations by previous researchers [e.g., Einstein, 1968; Beschta and Jackson, 1979]. The Lauck [1991] model reproduced the general observations of Einstein [1968] that fine sediment fills the pores from the bottom up when the size ratio of bed material to fine sediment was large and the bed material was shallow. It also reproduced the general observation from other studies that fine sediment can only infiltrate a finite depth if the bed material is sufficiently thick [e.g., Beschta and Jackson, 1979; Frostick et al., 1984; Carling, 1984; Lisle, 1989; Scha¨lchli, 1992]. To further test the Lauck [1991] model, Rohn [1997] collected fine sediment infiltration data by submerging glass beads and naturally rounded pebbles into hot gelatin solutions and then raining fine sediment into the solution. Rohn’s [1997] data compared to Lauck’s [1991] model indicated that the model performed well for non-uniform bed material but poorly for uniform bed material. Cui et al. [2008] developed a theory that describes the processes of fine sediment infiltration based on the process outlined by Lauck [1991]. On the basis of this theory, the highest possible FSF resulting from fine sediment infiltrating an immobile clean gravel deposit is an exponential decay function with depth into the bed material, implying that significant fine sediment infiltration occurs only to a limited depth. [10] Building upon previous research, we designed a series of three flume runs to better understand the dynamics of fine sediment infiltration into immobile gravel deposits. In particular, we examined the effects of the grain-size distributions of the coarse bed material and the infiltrating fine sediment, and the influence of feed rate and duration of fine sediment feed during the infiltration process. On the basis of experimental results and simple geometric relations between the bed material and infiltrating fine sediments, semi-empirical relations (i.e., relations based partially on physical principles and partially on experimental data) were developed to describe (1) the saturated FSF in a coarse sediment deposit and (2) the vertical profile of infiltrated fine sediment into an immobile clean gravel deposit. These relations explain many of the observations from earlier studies [e.g., Einstein, 1968; Beschta and Jackson, 1979; Frostick et al., 1984] within a physically rigorous framework.
2. Overview of the Experiments [11] The experimental runs were conducted in a flume at the Richmond Field Station (RFS), University of California. The flume is 28 m long, 0.86 m wide and 0.9 m deep, and is equipped with sediment feeders, acoustic and laser beam scanners that measure detailed water surface profiles and sub-aqueous and sub-aerial bed topography, and continuous sediment-flux measurement equipment (Figure 1a). The three experimental runs were designed with the following considerations: (a) the combination of bed slope, water discharge, and bed material grain-size distributions should result in minimal transport of bed material (i.e., the experiments were conducted on a bed that was essentially immobile at the experimental discharge), for reasons that will be discussed later; (b) the spread and size range of bed material grain-size distributions should be maximized in order to
2 of 18
W03424
WOOSTER ET AL.: FINE SEDIMENT INFILTRATION INTO IMMOBILE GRAVELS
W03424
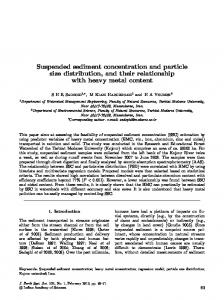
Figure 1. (a) Schematic diagram of the flume and associated equipment; and (b) plan view of the flume, showing the ten bed material zones used in the infiltration experiments. Diagrams are not to scale. develop relations between fine sediment infiltration and bed material grain-size distributions; and (c) the majority of introduced fine sediment should move as bed load. The channel slope was set at 0.004 and a constant water discharge of 40 l/s was used for all the three experimental runs. [12] The experimental section of the flume bed was located between 5 m from the flume entrance and 4.75 m upstream of the downstream weir, and was divided into 10 equal dimensioned zones with a length of 3.65 m and a width of 0.43 m (Figure 1b). Nine bed-material mixtures were produced by combining different ratios of five base sediments. The sediment mixture with the smallest median size was then placed in zone 9, one of the downstream-most zones, so that it would not transport into the other zones if the bed material was mobilized. The other eight mixtures were then randomly placed into zones 1 through 8. The sediment placed in zone 1 was also placed in zone 10 as a replicate in order to compare potential differences in infiltration due to longitudinal position of experimental zones and proximity to the sediment feed. The nine grain-size distributions are shown in Figure 2 and their geometric mean grain sizes and geometric standard deviations (see Cui et al. [1996] for the definition and calculation of geometric mean and geometric standard deviation) are listed in Table 1. Because of the varying grain-size distributions in different zones, it was not possible to create an initial equilibrium channel bed by feeding coarse sediment, as each zone would require different sediment feed rates and grain-size distributions to achieve an equilibrium state. Because of these limitations associated with varying grain-size distributions throughout the flume, we designed the experimental parameters so that there would be minimal bed degradation, even without coarse sediment feed. [13] Typically a surface layer coarser than the subsurface material forms in a gravel-bedded river [e.g., Parker and Sutherland, 1990]. In an effort to replicate this process, we placed a coarser surface layer in eight of the ten zones. In the remaining two zones (4 and 6), the bed material was fairly uniform and no coarse surface layers were placed. The
surface grain-size distributions for the eight zones were determined by combining the surface-based bed load equation of Parker [1990] with the exchange function of Hoey and Ferguson [1994] and Toro-Escobar et al. [1996], which links the grain-size distribution of subsurface sediment with those in the bed load and surface layer (Table 1). A surface layer with a thickness of approximately 2 cm, which is equivalent to the coarsest particle size used for the experiment, was placed on top of the approximately 14-cm-thick subsurface bed, forming a deposit approximately 16 cm in total depth. Beneath the 16-cm experimental bed was sediment of similar size from previous experiments. After each run, the 16-cm experimental bed was completely excavated and new surface and subsurface material placed for subsequent experimental runs following the same procedure.
Figure 2. Bed material grain size distributions for the ten zones used in the infiltration experiments.
3 of 18
WOOSTER ET AL.: FINE SEDIMENT INFILTRATION INTO IMMOBILE GRAVELS
W03424
W03424
Table 1. Target Bed Material and Surface Layer Geometric Mean Grain Sizes and Geometric Standard Deviations for the Ten Zones Used in the Three Experimental Runsa Zone Number Subsurface bed material Surface layer
geometric geometric geometric geometric
1 and 10
2
3
4
5
6
7
8
9
7.0 1.82 9.2 1.65
10.2 1.74 12.9 1.56
13.1 1.67 15.6 1.37
17.2 1.17 17.2 1.17
7.3 1.90 10.6 1.85
7.9 1.23 7.9 1.23
8.8 1.72 12.1 1.62
7.6 1.46 8.4 1.43
4.2 1.65 5.3 1.70
mean, mm standard deviation mean, mm standard deviation
a Sampled geometric mean and geometric standard deviation values for individual sediment cores had local variations and are slightly different from the target values given in this table. Analyses conducted in the paper applied the measured geometric mean and geometric standard deviation values from each sediment core unless specified otherwise.
[14] After manually placing the sediment into the flume, we introduced flow and fine sediment feed to investigate fine sediment infiltration into the clean gravel deposits. The fine sediment used for infiltration was well-sorted fine sand with a geometric mean diameter of 0.35 mm and a geometric standard deviation of 1.24. Trial experiments indicated that the majority of the fine sand was transported as bed load with very little suspension at a discharge of 40 l/s. In order to finalize an appropriate fine sediment feed rate for Run 1, a 30-min trial run was conducted with a fine sediment feed rate of 0.048 kg/min (fed with a screw feeder at the flume entrance), and we determined that this feed rate was too low to completely saturate the gravel bed with fine sediment in a reasonable amount of time. The fine sediment feed rate was then increased by approximately a factor of 4.5 to 0.209 kg/min (fed with a screw feeder at the flume entrance) to start Run 1. Run 1 was terminated once observations indicated that there was minimal additional fine sediment infiltration and the bed material was saturated throughout the length of the flume (discussed later), which occurred after 100 h of fine sediment feed (Table 2). [15] For Run 2, the fine sediment feed rate was increased by a factor of 10, relative to Run 1, to a feed rate of 2.09 kg/ min (fed with a screw feeder at the flume entrance), and fine sediment was fed for 10 h so that the same volume of fine sediment was introduced to the flume as in Run 1. Following the termination of fine sediment feed in Run 2, we continued the water discharge of 40 l/s for three hours without fine sediment feed in order to transport the fine sediment deposits on the channel surface to the flume outlet so that approximately the same volume of fine sediment passed throughout the flume length. Although running water without the fine sediment feed transported fine sediment deposits that buried the gravel surface, it should not have resulted in a depletion of fine sediment infiltrated into the subsurface based on the observations of Diplas and Parker [1985] who noted that fine sediment in the inter-
stices of a gravel deposit can only be entrained if the coarse sediment is mobilized. Similar to Run 2, the fine sediment feed rate for Run 3 was increased by an additional factor of 10 to 20.9 kg/min (fed manually at approximately 2 m downstream of the flume entrance with buckets) and fine sediment was fed for one hour (Table 2). Following the termination of fine sediment feed in Run 3, the 40 l/s water discharge continued for 2.5 h. Because we did not initially envision the necessity of running clean water for Runs 2 and 3, Run 1 was terminated without running clean water. However, at the termination of fine sediment feed in Run 1 only a small fraction of the total volume of introduced fine sediment had not transport over the entire length of the flume due to the 100 h of run time. In Runs 2 and 3, a significant volume of the introduced fine sediment remained in the flume at the termination of the sediment feed which necessitated the additional clean water run time to ensure all zones were exposed to a similar volume of fine sediment. [16] Surface and subsurface sediment samples were taken for grain-size analysis following the termination of each run. Six sediment cores were sampled in each zone for all experiments. Sediment cores were taken at the same locations for each run, and areas near zone boundaries were not sampled. Sediment cores were sampled using a 12-cmdiameter, thin-gage sheet metal tube cut with triangular teeth at the bottom (similar in design to a McNeil bed sampler) which was driven into the bed. The surface layer was sampled prior to driving the sampler into the bed. The sampling thickness of the surface layer ranged from 1 to 3 cm depending on the grain-size distribution of the surface material for a given zone, or roughly two median diameters of the bed material. The metal sampler was driven into the subsurface after the surface layer was removed, and sediment inside the sampler was removed, typically in 2 to 5 layers through the remaining experimental sediment deposit. The thickness of each layer and the number of layers at each location were determined by the sampling technician
Table 2. Parameters for the Three Experimental Runs
Run 1 Run 2 Run 3
Initial Bed Slope
Water Discharge (l/s)
Bed Material Feed Rate
0.004
40
none
Fine Sediment Feed Rate, kg/min
Duration of Fine Sediment Feed, hours
Additional Run Time Following Termination of Fine Sediment Feed, hours
0.209 2.09 20.9
100 10 1
0 3.0 2.5
4 of 18
W03424
WOOSTER ET AL.: FINE SEDIMENT INFILTRATION INTO IMMOBILE GRAVELS
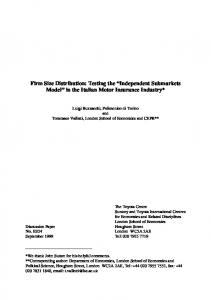
Figure 3. A schematic sketch of sand infiltration into gravel bed material as observed through the glass sidewalls of the flume. Sand deposits are resting at the angle of repose within pore spaces formed in the gravel interstices, demonstrating that sand infiltration was driven primarily by gravity.
based on visual observations of variations in sand content in the deposit using the following guidelines: (a) each layer must have a minimum 2-cm thickness to allow for adequate sediment for grain-size analysis; and (b) a new layer should be started if visual observations indicate a vertical change in fine sediment content. To aid in determining the thickness of each subsurface layer, test cores and/or trenches were often excavated in the zones (sufficient distance away from pre-determined experimental core locations so disturbance would not occur) to view the stratigraphy of the fine sediment infiltration prior to excavating the experimental cores. [17] Surface and subsurface samples were dried, sieved at 1/2-phi intervals and analyzed to obtain the FSF value and the grain-size distribution of the gravel portion of each sample. In addition, the fine sediment was sieved at 1/4-phi intervals for five of the zones (i.e., zones 1, 5, 6, 9, and 10) for all runs to determine if any longitudinal sorting of the fine sediment feed occurred. This analysis indicated that for both longitudinal location and sediment depth there was minimal variation in the grain-size distributions of the infiltrated fine sediment (e.g., variation in median diameter is less than 2%). Thus the analyses presented in this paper assume that the grain-size distribution of the infiltrated fine sediment throughout the experimental zones is identical to that of the fine sediment feed.
3. General Observations During the Experimental Runs 3.1. Run 1 (Sand Feed Rate = 0.209 kg/min for 100 h) [18] The introduced sand transported downstream predominantly as bed load. Initially, sand was transported predominantly near the center of the flume, forming a transport belt approximately half of the flume width. Sand deposits formed as patches within the transport belt in the interstices of the surface gravel. The sand transport belt
W03424
gradually widened over time and eventually covered the full width of the flume throughout the flume length by the termination of the run. Bed forms did not develop during the run, and topographic scans during and after the run indicated that bed slope remained at 0.004 throughout the run. Observations of sand infiltration were made through the glass walls on both sides of the flume throughout the flume length. Sand particles were observed falling into the pore spaces of the gravel deposit near the glass walls as soon as sand transport reached the glass walls. Sand infiltration into the gravel interstices appeared to be driven by gravity, evidenced by observations of small sand piles resting at the angle of repose within gravel interstices during sand infiltration (demonstrated in the sketch shown in Figure 3). No lateral transport of sand particles in the subsurface was observed other than sliding downslope along the sand piles (Figure 3). [19] A 100-h duration for Run 1 was not predetermined before the experiment. A decision to terminate the run was made during the experiment based on observations that sand infiltration had reached equilibrium at the two glass walls throughout the length of the flume. The width of active sand transport widened to the glass walls after covering the rest of the flume, which implies that sand infiltration near the glass walls received the shortest duration of sand influx available for infiltration. Thus we assumed that sand had stopped infiltrating the middle portions of the flume bed where sampling stations were located once sand infiltration along the two walls reached equilibrium. 3.2. Run 2 (Sand Feed Rate = 2.09 kg/min for 10 h) [20] Similar to Run 1, sand transported downstream predominantly as bed load and started in a sand transport belt near the center of the flume, which gradually widened to cover the full flume width before the termination of sediment feed. Figure 4 illustrates the sediment deposit at 4 h 15 min, indicating that the sediment deposition had not yet reached the left glass wall. With an increase in sand feed rate by a factor of 10, Run 2 produced more surface sand deposition than Run 1. At the end of the 10-h sand feed, the flume slope had increased to close to 0.005 from the initial slope of 0.004. Thicker sand deposition was measured along the flume centerline than near the flume walls. The sand deposit thickness averaged along the channel centerline was approximately 2 cm, and the sand deposit thickness averaged across the entire channel width was approximately 1 cm. Following termination of the sand feed, an additional 3 h of discharge without sediment feed transported the sand pulse to the flume exit, cleaning the bed surface prior to bed material sampling. Topographic scans at experiment termination indicated that the channel had returned to its initial bed slope of 0.004, except for Zone 9 (finest bed material distribution) where significant erosion occurred during the run. Because of this bed scour, data from Zone 9 for Run 2 are excluded in analyses presented below. 3.3. Run 3 (Sand Feed Rate = 20.9 kg/min for 1 h) [21] The increased sand feed rate greatly exceeded the transport capacity of the experimental set-up and a large sand wedge formed in the upper half of the flume. At the end of the 1-h sand feed, the average sand deposit thicknesses in the upstream and downstream halves of the flume were 6 cm and 2.5 cm, respectively. As a result, the bed
5 of 18
W03424
WOOSTER ET AL.: FINE SEDIMENT INFILTRATION INTO IMMOBILE GRAVELS
W03424
relations. For example, the saturated FSF (i.e., the maximum possible FSF in a frame-supported sediment deposit) is derived by breaking the problem into: (a) the pore space available in the clean gravel deposit; and (b) how much fine sediment can fit into the available pore space. Because all the numerical analyses presented below are sequential, with the subsequent equations depending largely on previous analyses, we encourage readers interested in the derivations of the numerical relations to read sequentially through all the related analyses sections.
5. Derivation of Saturated FSF Relation From Run 1 Data
Figure 4. Photograph of the sand deposit prograding downstream over the gravel bedded channel for Run 2 at 4 h 15 min run time. Photograph is looking downstream. Note that the sand deposit has not covered the bed along the left wall in this picture. slope increased to approximately 0.006 from the initial slope of 0.004. Sand dunes (amplitude 2.0 cm, wavelength 40 cm) were observed throughout the flume. Where the local slope was steepest, upper flow-regime bed forms were observed as periodic antidunes and surface flow waves formed and dissipated. Following sand feed termination, flow without sediment feed continued for 2.5 h, which transported the sediment pulse out of the flume and cleaned the bed surface prior to bed material sampling. Bed scans at the termination of the run indicated that the bed returned to the initial slope of 0.004.
4. Overview of Experimental Analysis [22] In the analyses presented below, we derive relations delineating the FSF in the gravel deposit as a result of fine sediment infiltration. Because of the complexity of the physical processes and the many parameters involved in the relations derived below, the analyses are broken into smaller components based on physical principles, and each component is presented separately. The results from the individual components are then combined to obtain the final
[ 23 ] A frame-supported sediment deposit typically describes a deposit where the larger, supporting particles (gravel in these experiments) are in contact with each other while the smaller ‘‘matrix’’ material (fine sand in these experiments) fills the pores formed by the large particles. To facilitate description and analyses of the experimental results, we introduce the concept of a saturated FSF to quantify the maximum possible FSF in a frame-supported sediment deposit as described above. Once the FSF within a deposit exceeds the saturated FSF, the deposit no longer is fully frame-supported (i.e., becomes partially frame- and matrix-supported or matrix-supported, where coarser sediment particles are not necessarily in contact with one another), which usually occurs as a result of concurrent deposition of both coarse and fine sediment during bed mobilizing flow events. [24] For deriving relations presented in this paper, we assume that the saturated FSF value of a sediment deposit is a function of the grain-size distributions of the coarse (framework bed material) and infiltrating fine sediment (sediment