(IJACSA) International Journal of Advanced Computer Science and Applications,. Vol. 7, No. ... index statistics (SUCIS) method is proposed for vector-quantized images. ..... segments the tree branches in addition to the mother bird. The.
(IJACSA) International Journal of Advanced Computer Science and Applications, Vol. 7, No. 12, 2016
Segmentation using Codebook Index Statistics for Vector Quantized Images Hsuan T. Chang* and Jian-Tein Su Photonics and Information Laboratory Department of Electrical Engineering National Yunlin University of Science and Technology Douliu Yunlin, Taiwan
Abstract—In this paper, the segmentation using codebook index statistics (SUCIS) method is proposed for vector-quantized images. Three different codebooks are constructed according to the statistical characteristics (mean, variance, and gradient) of the codewords. Then they are employed to generate three different index images, which can be used to analyze the image contents including the homogeneous, edge, and texture blocks. An adaptive thresholding method is proposed to assign all image blocks in the compressed image to several disjoint regions with different characteristics. In order to make the segmentation result more accurate, two post-processing methods: the region merging and boundary smoothing schemes, are proposed. Finally, the pixel-wise segmentation result can be obtained by partitioning the image blocks at the single-pixel level. Experimental results demonstrate the effectiveness of the proposed SUCIS method on image segmentation, especially for the applications on object extraction. Keywords—image segmentation; vector quantization; index image; adaptive thresholding; codebook statistics
I.
INTRODUCTION
Vector quantization (VQ) has been a simple, efficient and attractive image compression scheme since the past three decades [1], [2]. The basic VQ scheme partitions an image into small blocks (vectors) and each vector is assigned by an index of the codeword in the codebook for encoding [3]. If the indices of the codewords are arranged in a specific form, they can effectively represent the image characteristics in terms of image blocks. For example, Yeh proposed a content-based image retrieval algorithm for VQ images by analyzing the indices of codewords [4]. Moreover, the correlations among these indices can be used to develop an efficient image segmentation scheme. Most of previous studies performed segmentation operations in the pixel level [5], [6]. However, block-based image segmentation schemes can provide several advantages [7], [8]. The block-based scheme is very suitable for the VQ-based image segmentation because VQ techniques usually divide an image into non-overlapping image blocks. Block-based segmentation schemes segment an image with blocks rather than pixels by considering the relative information of the neighboring image blocks. Large homogeneous regions can be detected by means of this technique. Moreover, the computational complexity can be saved by segmenting an image in the block level rather than in the pixel level.
In this paper, the segmentation using codeword index statistics (SUCIS) method is proposed for the vector quantized images. First, an image of size NN is divided into nonoverlapping image blocks of size BB. A training set of images is first used to generate an image codebook based on the wellknown Linde-Buzo-Gray (LBG) algorithm [1]. The codewords in the image codebook are then sorted in an incremental order according to their mean, variance, and gradient to obtain three different codebooks. For a vector quantized image, the corresponding index from the sorting results is treated as a pixel's grayscale value to obtain the index image. Therefore, three corresponding index images can be obtained. An index image intrinsically demonstrate the correlations among image blocks, which can be used as the features to label image blocks into homogeneous, edge, or texture blocks. Several imagedependent threshold values are adaptively determined for region labeling. Then, a region number is assigned to all connected homogeneous blocks with the same label to obtain disjoint regions. Finally, the pixel-based image segmentation result can be obtained by partitioning the size of edge blocks further into the pixel level. The rest of this paper is organized as follows: Section 2 deals with the proposed SUCIS method for VQ-coded images. Section 3 shows the experimental results for various test images. Conclusions are finally drawn in Section 4. 3 codebooks VQ: Nearest neighboring search
Input image
Generate index images F1, F2, and F3
Threshold value determination Image block classification/labeling
Region merging and boundary smoothing
Compressed data
Boundary detection
Boundary detection result
Assigning edge blocks
Segmentation result
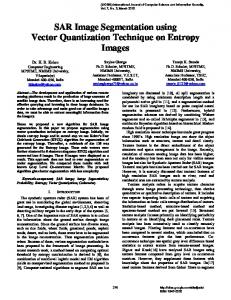
Fig. 1. The schematic diagram of the proposed SUCIS method
II.
THE PROPOSED METHOD
Figure 1 shows the block diagram of the overall image segmentation system by using the proposed SUCIS method. The overall system consists of six stages: (1) codebook generation, (2) VQ encoding, (3) index image generation, (4) region labeling, merging, and boundary smoothing, (5)
59 | P a g e www.ijacsa.thesai.org
(IJACSA) International Journal of Advanced Computer Science and Applications, Vol. 7, No. 12, 2016
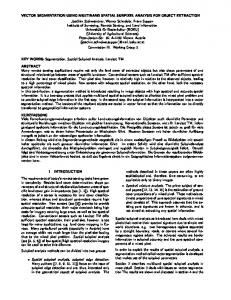
boundary detection, and (6) edge block assignment for image segmentation. The first and second stages have been well studied in image compression framework based on VQ. The third stage describes how to rearrange the indices of the codewords in the codebook using three different mapping functions. Then, three different index images can be generated and are used to label all image blocks, which are classified into three types: (1) homogeneous blocks, (2) edge blocks, and (3) texture blocks. Figures 2(a) – 2(f) show six typical image blocks in the block labeling configurations. The fourth stage discusses two post-processing methods: the region-merging and boundary-smoothing schemes which can refine the boundaries of regions of special interest. In the region-merging process, many homogeneous regions are merged into certain regions and this achieves the rough image segmentation result. In the boundary-smoothing process, the boundaries of the image segmentation result can be more refined by smoothing the boundaries of regions of special interest. In the fifth stage, the result of boundary detection will be obtained by extracting the edge blocks in the image segmentation result. The final stage describes how to partition and assign the edge blocks from the block level to the pixel level. The segmentation results under the three different pixel levels will be obtained through assigning the edge blocks continuously.
(a)
(b)
(c)
(d)
(e)
(f)
Fig. 2. Some typical image blocks in block labeling: (a) texture block; (b) monotone block; (c) vertical edge block; (d) horizontal edge block; (e) and (f) diagonal edge blocks
A. Codeword Index Assignment and Index Image Generation VQ is a generalization of scalar quantization to quantize a vector and a mapping of q-dimensional positive Euclidean space Rq into a finite subset C of Rq. Suppose that there are L codewords in the codebook. Let ci and C denote the codewords and codebook in VQ, respectively, where C={ ci | ci Rq, for i = 0,1,…, L-1}. The subscript i is the index of the codeword and is represented as a b-bit (2b = L) binary word. It is usually written as a decimal integer for notational brevity. Figure 3 shows the flowchart of the proposed scheme for codebook generation. If the codeword ci is considered as a discrete random sequence Xi =(ci,1, ci,2, …, ci,L) and every random variable ci,k, k=1,2,…, L in Xi is uniform distributed between 0 and 255 (because of the 8-bit resolution in digital images), then the Jth moment of the random sequence Xi is expressed by [9] E[( X i ) J ]
1 B B J ci,k p(ci,k ), B B k 1
(1)
where p(ci,k) is the probability density function of the random variable ci,k [7]. The codewords ci can be sorted in an incremental order based on their Jth moment (where J=1, 2) to obtain cj(J) where j(J) is the rank of ci based on its Jth moment. From a given image codebook C, two mapping functions between indices i and j(J) for mean J=1 and variance (J=2) are created. The first mapping function f1 computes the mean value
of the codewords in the codebook, where f1 is a linear function. The second mapping function f2 computes the variance value of the codewords, where f2 is a nonlinear function. Moreover, the third mapping function f3 computes the edge density of the codewords. Here, the edge density i represents the texture feature of the ith 44 codeword. The edge density is defined as [10]: i
| {ck | Maggradient (ci ) T } | ,
(2)
B2
where T denotes the average gradient magnitude of all codewords. First, the mapping function f1 is a straight line with unit slope because the codewords in the codebook C have been already sorted in the incremental order with mean. Alternatively, the codebooks CF1, CF2, and CF3 are directly derived from image codebook C if codewords are sorted according to their mean, variance, and gradient, respectively. The codewords in the three codebooks represent the different meanings. In the first codebook CF1, the indices of the codewords distribute from low mean values to high mean values. In other two codebooks CF2, and CF3, the high indices of the codewords represent the edge and texture blocks in the test image, respectively. We utilize the codewords in the codebook to label the total homogeneous blocks in the test image. If the index of the codeword is treated as the grayscale value of a pixel, then an NN image can be quantized into N/BN/B indices and be converted into the index images F1, F2 and F3 of size N/BN/B by the use of the codebooks CF1, CF2, and CF3, respectively, based on the three different mapping functions f1, f2 and f3. For the codebook whose size is larger than 256, to make the indices fall into the range between 1 and 256, the codewords in the codebook must be uniformly divided into 256 classes according to their incremental order. Therefore, numerous codewords can be represented by the same index. Training set images LBG algorithm Unsorted codewords Mapping functions: f1, f2, and f3 Codebook CF1 sorted by mean
Codebook CF2 sorted by variance
Codebook CF3 sorted by gradient
F1
F2
F3
Fig. 3. Flowchart of the image codebook generation
The characteristics of all image blocks in a test image can be classified into three typical image blocks. According to the characteristics in three index images F1, F2 and F3, the regions and boundary of objects of our interest are extracted. The index image F1 is a thumbnail version of the original image. It reveals the mean order of image blocks and is used to label all corresponding image blocks. The label of the image block is indeed the corresponding pixel value in the index image F1. Both the index images F2 and F3 strongly reveal the structural
60 | P a g e www.ijacsa.thesai.org
(IJACSA) International Journal of Advanced Computer Science and Applications, Vol. 7, No. 12, 2016
arrangement (edge and texture information) in the image blocks and are used to determine whether the image blocks belong to the homogeneous blocks or not. The larger values in the index images F2 and F3 represent that the gray-level distribution of an image block is closer to the edge or texture block. If the index image F1 is used to label all image blocks and a region number is assigned to all connected image blocks to obtain disjoint regions, the rough segmentation result can be obtained and can be used as the initial segmentation result for the following pixel-based image segmentation problem. B. Adaptive Thresholding for Block Labeling To classify the image blocks in a VQ-coded image, the threshold values are employed. Here, two threshold values TM and TF for the mean and fused index images, respectively, are determined at first. The histogram of the index image F1 is used to determine the initial threshold value TM. On the other hand, the histogram of fused index image (the fusion of index images F2 and F3) is used to determine the initial threshold value TF. In the image fusion method, the pixel values with the same position in two index images F2 and F3 are compared. Then, the larger value in the two pixels is chosen as the pixel value of the fused index image. The image fusion equation is given by
F (i, j ), if F2 (i, j ) F3 (i, j ) . Ff (i, j ) 2 otherwise F3 (i, j ),
(3)
Finally, the fused index image can be created by combining two index images F2 and F3. The overall procedure of the parameter setting for the index image F1 is as follows: Step 1: Compute the histogram of index image F1 and its average value as the initial threshold value TM which is determined by TM
255
i 0
i Pixel number (i) ( N / B) 2
.
(4)
Step 2: Determine the accumulated distribution of the histogram by gradually accumulating every five percent of total pixels in the index image. Step 3: In order to obtain four regions with different grayscale distributions, two more threshold values TML and TMH are calculated as follows:
TML
TM ; 2
TMH
TM 255 . 2
(5)
Step 4: Calculate the difference values between the three average values TM, TML, and TMH and every grayscale level in the accumulated distribution, respectively. Step 5: Separately update these average values by using the grayscale levels that have the minimum difference among them, Step 6: Compute the differences between first and last three grayscale levels. Set TL and TH are equal to the first and last second grayscale levels, respectively, if the difference is the smallest.
If the pixel values are greater than TMH, these pixel values in the index image F1 represent the light homogeneous blocks, On the other hand, if they are smaller than TML, they represent the dark homogeneous blocks. The threshold values TH and TL are used to label the lightest and darkest homogeneous blocks, respectively. As mentioned above, we can employ these threshold values to label all homogeneous blocks in a VQcoded image. After all the homogeneous blocks in a VQ-coded image are labeled, some similar image blocks can be merged into the same region. Thus, we find that many different homogeneous regions spread over a VQ-coded image. Finally, the rough image segmentation result can be obtained. In order to make the segmentation result more accurate, it must distinguish the edge and texture blocks separately from all image blocks in a test image. The index images F2 and F3 are employed to determine which image blocks belong to the edge and texture blocks, respectively. Finally, the edge blocks in the index image F2 and the texture blocks in the index image F3 are fused and used to generate a new index image Ff by using Eq. (3). These pixel values in the index image Ff represent the bright texture blocks, if the pixel values are greater than TF. On the other hand, they represent the dark texture blocks and are smaller than TF. After all texture blocks in a test image are labeled, some similar image blocks can be merged into the same region. The overall procedure of the parameter setting for the fused index image is similar to that used for the mean index image except that two threshold values TMH and TML are not used here. After we remove the labels of these image blocks in the rough segmentation result and mark them as edge or texture labels, the rest of image blocks which have labels in the rough segmentation result are called the homogeneous blocks. Finally, all image blocks in a test image are classified into three classes including the homogeneous, edge, and texture image blocks. In the post-processing, the region-merging process and boundary smoothing will be used to modify the rough image segmentation result. The region-merging process can avoid the over-segmentation for a test image. More accurate contours of the objects can be obtained by means of boundary smoothing. C. Region Merging and Boundary Smoothing As a result of the block classification and labeling shown above, the labels for all image blocks can be obtained. A region number can be assigned to all connected blocks [11]. In numbering the connected blocks, we must check whether a candidate block and its neighboring blocks have the same label. In order to reduce the number of regions, the small-size and non-interested regions should be ignored such that the complete and large regions are left. For a given block, if the number of connected image blocks is less than a defined smallest region (SR) in a region, it will be merged into one of its neighboring regions. At the same time, the mean difference between a candidate region and one of its neighboring regions is also checked based on their corresponding codewords. A candidate region will be assigned to the neighboring region which has the smallest mean difference with the candidate region. Since only the large regions in a VQ-coded image are left, the number of regions can be reduced. Therefore, the
61 | P a g e www.ijacsa.thesai.org
(IJACSA) International Journal of Advanced Computer Science and Applications, Vol. 7, No. 12, 2016
rough segmentation result can be obtained and the oversegmentation problem can be avoided. After the operation of region merging has been finished, we find that the boundaries of the large and interested regions in a VQ-coded image are unsmoothed, which may lead to the erroneous segmentation. The final segmentation result might not be accurate. Thus, to obtain the higher accurate segmentation result, the operation of boundary smoothing is used to refine the boundaries of the large and interested regions. The procedure of boundary smoothing is described as follows: First, all regions in a VQ-coded image are divided into two different type regions. If a region whose label of the only neighboring region is different from that of it, it is called the independent region. On the other hand, if a region whose labels of many neighboring regions are different from that of it, it is called the dependent region. Let a mask of size 33 be mapped to all regions in a VQ-coded image. Then, the ratio of every image blocks in a mask is computed. If a number of image blocks of objects in a mask of size 33 are smaller than that of its neighboring regions, then the image blocks that lies in the center position of a mask are merged into one of its neighboring regions. Otherwise, the image blocks will not be changed. The above steps are repeatedly executed until the image blocks of all regions in a VQ-coded image are never changed again. Finally, the boundary smoothing results can be obtained. Region I
Region I
Region I
Finally, the refined image segmentation result can be obtained when none of the edge block is left. The segmentation results for three different levels from the block level to the pixel level can be obtained. The basic units for assignment in the Level-0, Level-1, and Level-2 segmentation results are the blocks of size 44, 22, and single pixel, respectively. TABLE I. Image
THE PARAMETER LIST FOR TWO TEST IMAGES
Parameters TM
TML
TMH
TL
TH
TF
SR
Lena
139
70
197
NA
NA
104
40
Tower
132
66
194
NA
NA
137
30
(a)
Region I
(b)
(a)
Region II (b)
Region II (c)
Region II (d)
(d)
Fig. 5. (a) The original Lena image and three index images of size 128128: (b) F1, (c) F2, (d) F3., and (e) the fusion result of (c) and (d)
Fig. 4. Homogeneous regions and edge blocks labeling: (a) Homogeneous regions labeling. Edge blocks labeling in (b) Level 0; (c) Level 1; (d) Level 2
Histogram of Lena image
Accumulation distribution of Lena image
350
300
After all edge blocks have been labeled, they are partitioned into half size and assigned to one of its neighboring regions. The procedure of assignments of edge blocks is described as follows: First, the mean difference between a candidate edge block and each of its neighboring (4-connected neighbors [12]) regions is examined based on their corresponding codewords. Then, a candidate edge block will be assigned to the neighboring region which has the smallest mean difference with it. The size of edge blocks can be reduced to be its sub-level. As the size of edge blocks is reduced, the contour of objects can be more accurate.
250
Pixel number
D. Assignments of Edge Blocks Here we describe how to assign the edge blocks and to refine the segmentation results from the block level to pixel level. There are many homogeneous and texture regions in a test image and the image blocks in their boundaries are labeled as the edge blocks. Figure 4(a) shows two different regions, where Region I and Region II stand for the object region and the background region, respectively. Figure 4(b) shows the boundaries in the object region that is labeled as the edge blocks, where every edge block is of size 44.
(e)
Pixels accumulation values
Region II
(c)
200
150
100
50
0 0
50
100
150
200
Grayscale Level
250
Grayscale Level
(a)
(b)
Fig. 6. (a) The histogram for the Lena index image (ordered by mean); (b) The accumulation distribution determined from (a)
III.
EXPERIMENTAL RESULTS
In this paper, the Lena image of size 512512 and the Tower image of size 360288 are used to test the proposed SUCIS method. The unsorted codebook can be generated by using the LBG algorithm. Before the two test images are segmented, some parameters must be determined for them. Every image should have the different parameters because the complexity in each image is different. Table I shows the threshold values and the SR parameter for two test images. Both the threshold values TL and TH in these two images are not available because the conditions described in Section II.B
62 | P a g e www.ijacsa.thesai.org
(IJACSA) International Journal of Advanced Computer Science and Applications, Vol. 7, No. 12, 2016
are not satisfied. Figure 5(a) shows the original Lena image. Figures 5(b)-5(d) shows the three index images F1, F2, and F3, which are generated by image codebooks CF1, CF2, and CF3, respectively. The mean image shown in Fig. 5(b) looks very similar to the original image. As shown in Figs. 5(c) and 5(d), the brighter pixels represent higher variance and gradient values of the blocks in the original image. The fusion result of Figs. 5(c) and 5(d) is shown in Fig. 5(e). Figures 6(a) and 6(b) show the histogram and its accumulation distribution of the index image of the Lena image, respectively. (a)
(b)
Fig. 9. Boundary detection results for the (a) Lena and (b) Tower images
(a)
(b)
(c) (a)
Fig. 7. Regions merging for the Tower index image F1 (order by mean): (a) Before region merging; (b) After region merging with SR=30 and the 4connected condition; (c) After boundary smoothing
(b)
(c)
Fig. 10. Segmentation results for the Lena image of size 512512: (a) Level 0; (b) Level 1; (c) Level 2
(a)
(a)
(b)
(b)
(c)
(c)
Fig. 8. Regions merging for the fused index image Ff of the Tower image: (a) Before region merging; (b) After regions merging with SR=30 and the 4connected condition; (c) After boundary smoothing
Consider the Tower image for the proposed SUCIS method. Figures 7(a)-7(c) show some results of region merging with SR=30 and using the 4-connected condition for the mean index image. As shown in Fig. 7(c), a rough segmentation result can be observed in the smoothed regions. Figures 8(a)8(c) show the boundary smoothing effects for the fused index image Ff. Finally, Figs. 9(a) and 9(b) show the boundary detection results for the test Lena and Tower images, respectively. According to these two figures, Figs. 10 and 11 show the segmentation results in three different levels for the Lena and Tower images which are VQ-coded. The different image segmentation results can be obtained. Obviously, the image segmentation results with better accuracy can be obtained with the edge block labeling in Level 2.
Fig. 11. Segmentation results for the Tower image of size 360288: (a) Level 0; (b) Level 1; (c) Level 2
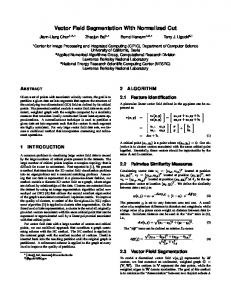
The proposed SUCIS method is compared with the benchmark watershed method [13] to verify the effectiveness especially for the foreground object segmentation. Four test images downloaded from the Berkeley Segmentation Dataset [14] are utilized in our experiments. Figures 12(a), 12(c), 12(e), and 12(g) show the segmentation results of the proposed SUCIS method. By using the watershed function provided in MATLAB, Figs. 12(b), 12(d), 12(f), and 12(h) show the segmentation results of the watershed method. As shown in both figures, the foreground objects can be successfully segmented. In Figs. 12(a) and 12(b), the proposed method also segments the tree branches in addition to the mother bird. The most difference results are shown in Figs. 12(e) and 12(f). The proposed method segment the foreground only in one region, while the watershed method can segment the more detail shapes for the owls.
63 | P a g e www.ijacsa.thesai.org
(IJACSA) International Journal of Advanced Computer Science and Applications, Vol. 7, No. 12, 2016
(a)
can be obtained by partitioning the edge blocks into the half size and assigning to one of their neighbor regions until to the pixel level. Moreover, the computational complexity can be reduced by segmenting images in the compressed domain and with blocks rather than pixels. In summary, the proposed SUCIS method is effective and efficient for image segmentation and the results can be applied on VQ-based image/video coding schemes. Our future work may focus on extracting the objects from the segmented results and/or describing the semantic meanings in the processed images. The proposed method may be extended by cooperating the local robust statistics [15] or the machine leaning methods based on the artificial neural network [16] and fuzzy theory [17]. The effectiveness of applying the proposed SUCIS method onto the medical image processing [16], [18] can be investigated as well.
(b)
ACKNOWLEDGMENT This work is partially supported by Ministry of Science and Technology (MOST), Taiwan under Contract Number MOST 105-2221-E-224-021-MY2. (c)
(d) [1]
[2] [3] [4] (e)
(f) [5]
[6]
[7]
[8]
(g)
[9] [10]
(h)
Fig. 12. Comparison of the segmentation results between the proposed SUCIS and the watershed methods: (a), (c), (e), (g) are the level-2 results of the proposed SUCIS method and (b), (d), (f), (h) are the results of the watershed method
IV.
[11] [12]
CONCLUSIONS
In this paper, the SUCIS method is proposed based on the index statistics of VQ-coded images to perform the image segmentation especially for the VQ-coded images. The SUCIS method uses three different index images to label and classify image blocks in a VQ-coded image and distinguish them into homogeneous, edge, and texture blocks to obtain disjoint regions such that the segmentation result can be obtained. Although our SUCIS method segments an image in terms of blocks rather than pixels, the pixel-based segmentation result
[13]
[14]
REFERENCES Y. Linde, A. Buzo, and R.M. Gray, “An algorithm for vector quantizer design,” IEEE Transactions on Communication, vol. 28, no. 1, pp. 8495, Jan. 1980 R. M. Gray, “Vector quantization,” IEEE ASSP Magazine, vol. 1, no. 2 , pp. 4-29, 1984 A. Gersho and R. M. Gray, Vector Quantization and Signal Compression, Boston, MA:Kluwer, 1992 C.-H. Yeh and C. J. Kuo, “Content-based image retrieval through compressed indices based on vector quantized images,” Optical Engineering, vol. 45, no. 1, pp. 1-8, Jan. 2006 Y.T. Hsiao, C.L. Chuang, J.A. Jiang, and C.C. Chien, “A contour based image segmentation algorithm using morphological edge detection,” 2005 IEEE International Conference on Systems, Man and Cybernetics, vol. 3, pp. 2962-2967, Oct. 2005. H. Gao, W.C. Siu, and C.H. Hou, “Improved techniques for automatic image segmentation,” IEEE Transactions on Circuits and Systems for Video Technology, vol. 11, no. 12, pp. 1273-1280, Dec. 2001 C.S. Won, “A block-based MAP segmentation for image compression,” IEEE Transactions on Circuit and System for Video Technology, vol. 8, no. 5, pp. 592-601, 1998 X. Li and S. Lei, “Block-based segmentation and adaptive coding for visually lossless compression of scanned documents,” 2001 IEEE International Conference on Image Processing, vol. 3, pp. 450-453, Oct. 2001 W.K. Pratt, Digital Image Processing, John Wiley and Sons, Inc, 1991 G.C. Stockman and L.G. Shapiro, Computer Vision, Chapter 7, pp. 216, Prentice hall, New Jersey, 2001 Y.L. Leng and X. Li, “Adaptive image region-growing,” IEEE Transactions on Image Processing, vol. 3, no. 6, pp. 868-872, Nov. 1994 Y. Deng and B.S. Manjunath. “Unsupervised segmentation of colortexture regions in images and video,” IEEE Transactions on Pattern Analysis and Machine Intelligence, vol. 23, no. 8, pp. 800-810, Aug. 2001 L. Vincent and P. Soille, “Watersheds in digital space: An efficient algorithm based on immersion simulations,” IEEE Transactions on Pattern Analysis and Machine Intelligence, vol. 13, no. 6, pp. 583-597, Jun. 1991 D. Martin, C. Fowlkes, D. Tal, and J. Malik, “Database of human segmented natural images and its application to evaluating segmentation algorithms and measuring ecological statistics,” Proc. 8th International Conference on Computer Vision, vol. 2, pp. 416-423, July 2001
64 | P a g e www.ijacsa.thesai.org
(IJACSA) International Journal of Advanced Computer Science and Applications, Vol. 7, No. 12, 2016 [15] C. Huang and L. Zeng, “Robust image segmentation using local robust statistics and correntropy-based K-meansclustering,” Optics and Laser in Engineering, vol. 66, pp. 187-203, Mar. 2015 [16] A. De and C. Guo, “An adaptive vector quantization approach for image segmentation based on SOM network,” Neurocomputing, vol. 149, Part A, 3, pp. 48-58, Feb. 2015.
[17] Y. Li, “Wavelet-based fuzzy multiphase image segmentation method,” Pattern Recognition Letters, vol. 53, pp. 1-8, Feb. 2015 [18] A. De and C. Guo, “An image segmentation method based on the fusion of vector quantization and edge detection with applications to medical image processing,” International Journal of Machine Learning and Cybernetics, vol. 5, no. 4, pp. 543–551, Aug. 2014
65 | P a g e www.ijacsa.thesai.org