general-purpose simulation software will be considered. Two types of such .... data analysis technique, it is possible to obtain some idea of a feasible market ...
OR Insight Vol. 3 No. 2 AprilJune 1990
Segmenting the simulation software market Cluster analysis suggests seven basic categories of product
Alex Van Breedam, Jan Raes and Karel van de Velde
As a result of the proliferation of the microcomputer, a lot of simulation software for microcomputers has become
in the possibilities of statistical analysis. Therefore it is not appropriate to regard user-friendliness as an evaluation criterion for a simulation software package. Userfriendliness should be considered as a representation of a package's suitability for certain user categories.
available. Because the simulation software market is
relatively small, manufacturers try to target their packages towards a specific group of users in order to avoid direct competition with other manufacturers. The purpose of this article is not the comparison of some of
The 11 evaluation criteria employed in this study are described briefly below:
the simulation packages for IBM-compatible microcomputers, but rather the positioning of the
Modelling flexibility
packages in the market. This may help users to choose appropriate packages.
This fundamental requirement of simulation software can be defined as the package having the necessary
Introduction
techniques to implement the model accurately: model logic, a good random number generator, initialization procedures and time advancement
Simulation software can be classified as generalpurpose or special-purpose. With general-purpose simulation software, one can model almost any type of system, while special-purpose simulation software is
method. The better it handles complex problems, the more flexible it is. A package which gives
designed to simulate a specific environment. Here, only general-purpose simulation software will be considered.
detailed solutions for a wide range of problems
Two types of such software can be distinguished: general-purpose simulation languages (e.g. GPSS, SIMULA, etc. ...) and interactive general-purpose
a specific application area can, within its limited problem area, be quite flexible without having to
therefore offers more modelling flexibility. However,
appeal to complex programming.
simulation software (e.g. WITNESS, TAYLOR, etc. ...).
Learning time
The simulation software market can also be divided into different segments based on the various categories of user. Each user category assigns varying levels of importance to specific features of simulation software.
This is of course strongly correlated with the complexity of the programming environment offered by a package. lt is certainly important, as ¡t can represent a substantial part of the purchasing cost. In any case, complex problems will require a flexible
Consequently, these features can be considered as evaluation criteria.
environment, and therefore a longer learning time associated with the purchase of the package.
This article describes a study in which 11 relevant
evaluation criteria were identified and a sample of
Run-time observation
simulation packages assessed on these criteria. The
We refer here to the possibility of actually watching
resulting assessments provided the necessary input for a cluster analysis. The results of this cluster analysis were used to obtain some idea of the positioning in the market of identified simulation packages.
the simulation run execution (intermediate state variable reports, trace reports, animation).
Run-time alterations
Evaluation criteria
This concerns the ability to influence its behaviour (run interruption, interactively changing the model). Additional components of interactiveness are the
At first sight, user-friendliness might appear to be an important evaluation criterion. Every user looks for the most user-friendly simulation software for his purpose. However, user-friendliness depends on the user - a
availability of help screens, error diagnosis and debugging facilities (they are probably of more use during the model-building phase).
package that is user-friendly for one user is not
necessarily user-friendly for another. For example, a user-friendly package for a manager who likes quick-andeasy implementation is not implicitly user-friendly for a programmer, who appreciates a flexible programming environment, or for a scientist, who is primarily interested
Statistics Interpretation and validation of the results almost invariably require statistical analysis. The statistical
possibilities offered by the package therefore Copyright © Operational Research Society 1990 9
OR Insight Vol. 3 No. 2 AprilJune 1990 constitute an important criterion in the evaluation of
can be either a restrictive or a negotiable element.
a package. A large variety of techniques may be
In any case,
available, and the packages are rated on the
package, of which it is at the most an indication.
will not affect the quality of the
it
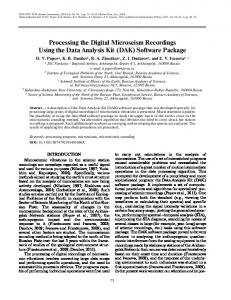
availability of the necessary tools. As part of our study, a questionnaire was distributed to experienced users of simulation packages, who were asked to rate a sample of packages on the above criteria. Table 1 summarises the results of this survey. We do not of course claim that the scores shown are incontestable!
Data input/output facilities How compatible or 'portable is the package with respect to its data structures? lt should be possible to build a simulation package into a larger system, as a module with easy input and output linking to other software. This implies that data can be read from files, and of course that output results can be delivered in a format usable for other purposes.
Table 1: Ratings of various simulation software Evaluation criteria
On-line analysis
2
3
nZj
1
A simulation investigation is not necessarily finished
4
aaa
after the experimentation and validation phase. Daily use of the simulation model within an existing
CD
system can be very useful (rapid evaluation of
5
ç
ocIro
6
7
O
CD
9 1011
8
(DCD
certain events, decisions or emergency situations).
CD
The requirements for on-line analysis are a Packages
combination of some of the above criteria (data
input/output facilities, run-time interaction,
GENETIK
animation), together with fast processing speed and large processing capacity.
GPSS/PC
44444334411 44442435454
Animation
INSIGHT MAST
43 4423 2 3 2 4 3 2 4 2 2 4 3
This can be considered as a visualization on the screen of the run execution. Animation can be an
MICROSAINT PASION
4
Furthermore, it may be a supporting argument to management when taking decisions on the basis of simulation results. The features required of the
PERS.PROSIM 52434434412 SIMAN/CINEMA 4 3 4 4 4 4 3 5 4 2
1
1
4
1
3
1
5
PC-SOL
24422433314 2333 33343310315
SIMPLE 1
33322
various elements on the layout can be clearly
SIMSCRIPT
5
identified and distinguished from one another. lt should also be possible to interrupt animation, and
SIMULA TAYLOR TURBOSIM WITNESS
indispensable tool to validate the model.
3
1
2
2
1
animation system depend upon its purpose. If it only
serves as a validation tool, it is sufficient that the
to change its speed. Finally, the ability to run simulation and animation simultaneously (direct association of quantitative results with qualitative
1
4
1
2
1
232
3
43442
1
3
5 2
51310410354 25424222414 3220 43343434420 1
0
2
1
5
visualization) is a great asset.
packages on 11 criteria
Customer support This is in fact a very important aspect in simulation software. Good support will generally motivate the customer to use the package more frequently, while rather poor support will have an inhibiting effect.
Source: Department of Statistics, University of AntwerpRUCA
User evaluation of packages
Therefore, an appropriate manual and good communication between manufacturer and
Each user can determine the fitness of a package for
customers is necessary. After all, a package should
his purpose as follows.
not only be bought, it should also be used and
importance to a number of objective evaluation criteria. Next, he has to rate the package's performance on each of the evaluation criteria. These ratings can be obtained by analysing folders, manuals, reduced or full versions of the package, by attending demonstrations, by talking to experienced users or simply by using the ratings of Table
remain in use.
Literature
Of course, the existence of literature about a package does not add to its quality. However, it can be of great value to the user if problems, related to his own, are discussed in the literature.
First, he assigns a relative
According to a simple and commonly-used multicriteria approach, the user must combine the weight 1.
Price
assigned to each criterion with the package's
This is of course also an element to be taken into consideration. However, it takes a separate place in the decision process of which package to buy. Price
score for each package. By comparing this global score for the packages considered, the user can select the most
performance (objective ratings) on that criterion. This hasto be done for all the criteria, in orderto obtain a global
10
OR Insight Vol. 3 No. 2 AprilJune 1990 user-friendly package for his purpose, i.e. the package with the highest global score.
interpretability of the clusters had to be taken into account in the decision process. Finally, we opted for classifying the packages into seven clusters.
Of course, the user may follow such a procedure intuitively. But he may be guided by more subjective reasons. Furthermore, the information he receives about a package may be incomplete or misinterpreted, and may thus possibly lead to false conclusions. Therefore, positioning packages into clusters, directed towards user categories, may be a clarifying help.
In the terms of our analysis, this means that the market for simulation software on microcomputer can be divided
into seven segments. Each segment has different features, according to the scores of the variables in the corresponding cluster. One can also expect each segment to have a specific target group of users with their specific problems. Manufacturers try to reach one or
Clusters and market segmentation
more target groups by including features in their simulation packages which are important for the user in that market segment.
Within the market for simulation software, not all the manufacturers are direct competitors. This is owing mainly to the fact that it is almost impossible to design a simulation package which scores very highly on all the criteria. Consequently, each manufacturer tries to position his package in a specific market segment by designing a package which scores very highly on one or a few criteria (animation, modelling capabilities, learning time, etc.). By doing so, he serves a markedly smaller
Interpreting the clusters Table 2 represents the cluster membership of the different packages in the survey.
Table 2: Cluster membership and characteristics (the cluster numbers have been assigned arbitrarily)
market segment with a more limited number of customers, but the competition will probably not be so tough.
Cluster
Package GENETIK SIMAN/CINEMA WITNESS
By means of cluster analysis, which is an exploratory data analysis technique, it is possible to obtain some idea of a feasible market segmentation. For this purpose, the
GPSS/PC
various evaluation criteria have to be considered as
variables, while the different simulation software packages are the objects to cluster. The main problem with cluster analysis is deciding on
3.
PERS. PROSIM SIMSCRIPT
4.
MAST MICROSAI NT TAYLOR
5.
TURBOSIM
6.
SIMULA
7.
INSIGHT
the number of clusters to be retained. A reliable procedure analyses the results of both hierarchical and non-hierarchical methods, taking the iterpretability of the clusters into account. A hierarchical clustering method starts from all the objects (simulation packages) and at each stage the most similar ones are merged until one
cluster is left, while a non-hierarchical clustering (partitioning) method finds the best partition, given the estimated number of clusters. As cluster analysis is an exploratory tool, it is preferable to study solutions of different hierarchical algorithms. When trying to estimate the number of clusters to be retained, several information sources are available. Of primary importance in this context are the results of the cluster analysis with the nearest centroid method (nonhierarchical method) for between three and eight clusters
PAS 10 N
PC-SOL
Key characteristics Good overall score except for literature and price Good overall score, abundant literature, good animation but limited statistical facilities Very flexible modelling capability and longer learning time Short learning time, attractive price Low overall score, but cheap Very flexible modelling capabilities, without statistics and animation, but lots of literature Average overall score, attractive price, limited animation
SIMPLE_1
and a number of heirarchical methods (single- and
Source: Department of Statistics, University of Antwerp-
complete linkage, average linkage within and between groups, Ward method).
RUCA
Cluster 1 contains the packages with a good overall
score, except for literature and price (Le. they are
An additional indication for the number of clusters was given by performing a factor analysis. Although a factor analysis applied to such a limited data-set relative to the
number of variables is contestable, the results can
comparatively expensive). The variables of this cluster with extreme scores are, generally speaking, also the variables with a high factor-loading on the first factor
eventually serve as an indication. The factor analysis yielded three principal factors, explaining 78.8% of the total variance.
with emphases on abundant literature and good
retained by the factor analysis.
The simulation packages with a good overall score,
animation but with limited statistical possibilities, are
Beside this quantitative information, the
classified in cluster 2.
11
OR Insight Vol. 3 No. 2 AprilJune 1990 Packages with very flexible modelling capabilities and consequently with a longer learning time are gathered in cluster 3. This cluster has extreme-score variables, which
selection of the number of clusters: decreasing the
corresponds with the high-loading variables of the
opinion a number above or below seven leads to considerable difficulties in the interpretation of the
number of clusters leads to less similar clusters, while increasing it yields more similar clusters. However, in our
second factor.
clusters.
Cluster 4 consists of those packages which are positioning on a short learning period and avery attractive price.
lt is not impossible for one user to belong to more than
one segment. A user for whom (e.g. modelling flexibility and animation are the only important criteria fits in the
Cluster S contains those packages with a low overall score, whose most important attribute is their low price.
market segments of cluster 1, 2 and 3. If he finds the price an important criterion too, then he will only belong to the target group in the market segment of cluster 2.
Cluster 6 is the cluster with the most extreme scores;
packages in this cluster have very flexible modelling capabilities, without statistics and animation but with a lot of literature. The high loading variables of the third factor
are approximately the extreme-score variables of this cluster.
For the interested reader
In cluster 7, finally, simulation software with a very attractive price, with very limited animation capabilities and an average overall score.
Anderberg, M.R. (1973): Cluster Analysis for Applications, Academic Press, New York.
Raes, J., Van Breedam, A., Ashayeri, J., Broeckx F. and Gelders, L. (Eds.) (1989): Proceedings of the Two-Day International Conference on Simulation on Microcomputer, Antwerp 26-27/1/1989, University of
lt is remarkable that some clusters are relatively similar. This is due to the relative arbitrariness in the
Antwerp-RUCA.
ALEX Van BREEDAM is a Commercial Engineer (University of Antwerp-RUCA, 1988) and a graduate in Statistics (Free University of Brussels, 1989). He is a Research Assistant in the Department of Statistics at the Faculty of Applied Economics of the University of AntwerpRUCA. In 1989 he was awarded the prize of the Belgian OR Society for his simulation project at a famous Belgian brewery. His major research interests include simulation and vehicle route/n g.
JAN RAES is currently pursuing a Ph.D in Statistical Expert Systems at the University of Anlwerp-RUCA, where he also obtained his degree in Commercial Engineering. He was honoured with the membership of the British OR Society on the occasion of his participation in the Sixth EURO Summer Institue on Decision Support Systems in 1989. An active member of the Board of the Belgian OR Society, he organized, together with the two co-authors, a successful conference on Simulation on Microcomputer in January 1989.
KAREL van de VELDE graduated as a Commercial Engineer in 1989 with a thesis on the evaluation of discrete simulation packages. He is now a student in Computer Science. 12
OR Insight Vol. 3 No. 2AprilJune 1990
Contact addresses
SIMAN/CINEMA (ver. 3.51), System Modelling
GENETIK (ver. 6.50), Insight Logistics Limited, 21 Oxford Street, Woodstock, Oxfordshire 0X7 1TH, UK.
Corporation, The Park Building, 504 Beaver Street, Sewickley, PA 15143, USA.
GPSS/PC (ver. 2), Minuteman Software, P0 Box 171, Stow, MA 01 775-01 71, USA.
SIMPLE_1 (ver. 3.0), Sierra Simulations and Software,
INSIGHT, Systech Inc., P0 Box 509203, Indianapolis, IN
303 Esther Avenue, Campbell, CA 95008, USA.
46250, USA.
SIMSCRIPT 11.5 (ver. 2.3), CAd, 3344 North Torrey Pines Court, La Jolla, CA 92037, USA.
MAST (ver. 2.1), CMS Research Inc., 605 South Main Street, Oshkosh, WI 54901, USA.
PC-SIMULA (ver. 107 Rl), Simula a.s., P0 Box 4403,
MICROSAINT/Animation (ver. 3.1), Rapid Data Ltd,
Torshov, N-0402 Oslo 4, Norway.
Crescent House, Crescent Road, Worthing, West Sussex
TAYLOR, The Dynamic Analyst (ver. 3.12), Fluttert &
BN11 5RW, UK.
Hillen, Spoorlaan 424, 5038 CG Tilburg, The Netherlands.
PASION + QMG, P0 Box 22-783, 14000 DF, Mexico. PC-SOL (ver. 4.0), System Simulation Consultants, 11051 Ring Road, Reston, VA 22090, USA.
TURBOSIM IV, Micro Simulation, 37 William J. Heights, Framingham, MA 01701, USA.
PERSONAL PROSIM (ver. 2.01), Sierenberg & De Gans
WITNESS (ver. 4), Istel Visual Interactive Systems,
b.v., Herbarenerf 7, 2743 HA Waddinxveen, The
Highfield House, Headless Cross Drive, Redditch, Worcs. B97 5EQ, UK.
Netherlands. 13