the corner frequencies and stress drops are high (averaging 100 MPa) confirming previous .... Multitaper methods have long been preferred to calculate source.
Form Approved OMB No. 0704-0188
REPORT DOCUMENTATION PAGE
Public reporting burden for this collection of information is estimated to average 1 hour per response, including the time for reviewing instructions, searching existing data sources, gathering and maintaining the data needed, and completing and reviewing this collection of information. Send comments regarding this burden estimate or any other aspect of this collection of information, induding suggestions for reducing this burden to Department of Defense. Washington Headquarters Services, Directorate for Information Operations and Reports (0704-0188). 1215 Jefferson Davis Highway, Suite 1204, Arlington, VA 222024302. Respondents should be aware that notwithstanding any other provision of law, no person shall be subject to any penalty for failing to comply with a collection of information if it does not display a currently valid OMB control number PLEASE DO NOT RETURN YOUR FORM TO THE ABOVE ADDRESS.
1. REPORT DATE (DD-MM-YYYY) r.Sep-2009 LE AND SUBTITLE
2. REPORT TYPE REPRINT
3. DATES COVERED (From - To) 5a. CONTRACT NUMBER
FA8718-06-C-0024
IC SOURCE SCALING AND DISCRIMINATION IN RSE TECTONIC ENVIRONMENTS
5b. GRANT NUMBER 5c. PROGRAM ELEMENT NUMBER
6260IF 5d. PROJECT NUMBER
6. AlWnOR(S)
RacKeflE. Abercrombie1, Kevin M. Mayeda2, William R. Walter3. Gisela M. Viegas and Rengin Gok1
1010 5e. TASK NUMBER
SM 5f. WORK UNIT NUMBER
Al 8. PERFORMING ORGANIZATION REPORT NUMBER
7. PERFORMING ORGANIZATION NAME(S) AND ADDRESS(ES)
Boston University 881 Commonwealth Avenue Boston, MA 02215-1303
9. SPONSORING / MONITORING AGENCY NAME(S) AND ADDRESS(ES)
10. SPONSOR/MONITOR'S ACRONYM(S)
AFRL/RVBYE
Air Force Research Laboratory 29 Randolph Road Hanscom AFB, MA 01731-3010
11. SPONSOR/MONITOR'S REPORT NUMBER(S)
AFRL-RV-H A-TR-2009-1066 12. DISTRIBUTION / AVAILABILITY STATEMENT
Approved for Public Release: Distribution Unlimited. Boston Boston University'. Weston Geophysical Corporation2, and Lawrence Livermore National Laboratories 13. SUPPLEMENTARY NOTES
Reprinted from: Proceedings of the 2009 Monitoring Research Review 23 September 2009, Tucson, AZ, Volume III pp 419 - 429.
Ground-Based Nuclear Explosion Monitoring Technologies, 21 -
14. ABSTRACT The objectives of this study are to improve low-magnitude (concentrating on M2.5-5) regional seismic discrimination by performing a thorough investigation of* earthquake source scaling using diverse, high-quality datascts from varied tectonic regions. Local-to-regional high-frequency discrimination requires an estimate of how eanhquakes scale with size. Walter and Taylor (2fXl I) developed the Magnitude and Distance Amplitude Corrections (MDAC) method to empirically account for these effects thnmgh regional calibration. The accuracy of these corrections has a direct impact on our ability to identify clandestine explosions in the broad regional areas characterized by low seismicity. Unfortunately our knowledge at small magnitudes (i.e.. mb < -4.0) is ptxrrly resolved, and source scaling remains a subject of on-going debate in the earthquake seismobgy community. Recently there have been a number of empirical studies suggesting scaling of micro-eanhquakes is non-self-similar, yet there are an equal number of compelling studies that would suggest otherwise. It is not clear whether different studies obtain different results because they analyse different earthquakes, or because they use different methods. We investigate eanhquake sources and scaling from different tectonic settings, comparing direct and coda wave analysis methods that both make use of Empirical Green's Function (EGF) earthquakes to remove path effects. We develop improved versions of the two methods, and then apply them to a range of data sets. Our direct wave analysis uses kical recordings of ckisely-kicated, well-correlated eanhquakes, and a multi-taper method to obtain time-domain source-time-tunctkins by frequency division. We only accept an earthquake and EGF pair if they are able to produce a clear, time-domain source pulse. Our improved, and simplified coda wave analysis method uses spectral ratios (as for the direct waves) but relies on the averaging nature of the coda waves to use EGF events that do not meet the strict criteria of similarity required for the direct wave analysis. Both coda and directwave methods are limited by the frequency bandw idth with good signal-to-noise, and recording limitations such as record length, clipping and sample rate. For both direct and coda waves, we fit the spectral ratios and perform a gridsearch about the preferred parameters to ensure the fits are well constrained. We then model the spectral (amplitude) ratio to determine source parameters from both direct P and S waves. We investigate the effects of using different fitting approaches, and source-model variations on the results. We analyze three clusters of aftershocks from the well-recorded sequence following the M5 Au Sable Forks, NY, earthquake to obtain some of the first accurate source parameters for small earthquakes in eastern North America. Each cluster contains a M- 2. and two contain M-3, as well as smaller aftershocks. Using direct waves, we find that the comer frequencies and stress drops are high (averaging HX) MPa) confirming previous work suggesting that intraplate continental earthquakes have higher stress drops than events at plate boundaries. We also demonstrate that a scaling breakdown suggested by earlier work is simply an artifact of their more band-limited data. We also find that the ratio of Energy to Moment is high, around 10-4. We estimate source parameters for the M5 mainshock using similar methods. The stress dn>p and energy/moment ratkr for the mainshock are slightly higher than for the aftershocks. We then apply the coda method to the same sequence to investigate consistency, and uncertainties. The large (M>4) aftershocks of the 1994 Northridge. CA, earthquake are our second choice of sequence for comparison of the methods. These earthquakes already have source parameters determined using time-domain methods (Mori et al.. 2003) and so by applying our spectral coda and direct wave methods, we can compare most appmaches in common use. We also apply one or both methods to a number of other earthquake sequences including those of recent moderate-sized earthquakes in Italy, and the Wells, Nevada, earthquake.
15. SUBJECT TERMS
Seismic scaling. Empirical Green's functions, Spectral ratios 16. SECURITY CLASSIFICATION OF: a. REPORT
UNCLAS
17. LIMITATION OF ABSTRACT
b. ABSTRACT
c. THIS PAGE
UNCLAS
UNCLAS
SAR
18. NUMBER OF PAGES
19a. NAME OF RESPONSIBLE PERSON Robert J. Raistrick 19b. TELEPHONE NUMBER (include area code)
Standard Form 298 (Rev. 8-98) Prescribed by ANSI Std 239.18
2009 Monitoring Research Review: Ground-Based Nuclear Explosion Monitoring Technologies
SEISMIC SOURCE SCALING AND DISCRIMINATION IN DIVERSE TECTONIC ENVIRONMENTS Rachel E. Abercrombie1, Kevin M. Mayeda2, William R. Walter3, Gisela M. Viegas', and Rengin Gok3 Boston University', Weston Geophysical Corporation2, and Lawrence Livermore National Laboratories3 Sponsored by the Air Force Research Laboratory
Award No. FA8718-06-C-0024. Proposal No. BAA06-70
>-
O
o o Q
ABSTRACT The objectives of this study are to improve low-magnitude (concentrating on M2.5-5) regional seismic discrimination by performing a thorough investigation of earthquake source scaling using diverse, high-quality datasets from varied tectonic regions. Local-to-regional high-frequency discrimination requires an estimate of how earthquakes scale with size. Walter and Taylor (2001) developed the Magnitude and Distance Amplitude Corrections (MDAC) method to empirically account for these effects through regional calibration. The accuracy of these corrections has a direct impact on our ability to identify clandestine explosions in the broad regional areas characterized by low seismicity. Unfortunately our knowledge at small magnitudes (i.e., nib < -4.0) is poorly resolved, and source scaling remains a subject of on-going debate in the earthquake seismology community. Recently there have been a number of empirical studies suggesting scaling of micro-earthquakes is non-self-similar, yet there are an equal number of compelling studies that would suggest otherwise. It is not clear whether different studies obtain different results because they analyse different earthquakes, or because they use different methods. We investigate earthquake sources and scaling from different tectonic settings, comparing direct and coda wave analysis methods that both make use of Empirical Green's Function (EGF) earthquakes to remove path effects. We develop improved versions of the two methods, and then apply them to a range of data sets. Our direct wave analysis uses local recordings of closely-located, well-correlated earthquakes, and a multi-taper method to obtain time-domain source-time-functions by frequency division. We only accept an earthquake and EGF pair if they are able to produce a clear, time-domain source pulse. Our improved, and simplified coda wave analysis method uses spectral ratios (as for the direct waves) but relies on the averaging nature of the coda waves to use EGF events that do not meet the strict criteria of similarity required for the direct wave analysis. Both coda and directwave methods are limited by the frequency bandwidth with good signal-to-noise, and recording limitations such as record length, clipping and sample rate. For both direct and coda waves, we fit the spectral ratios and perform a gridsearch about the preferred parameters to ensure the fits are well constrained. We then model the spectral (amplitude) ratio to determine source parameters from both direct P and S waves. We investigate the effects of using different fitting approaches, and source-model variations on the results. We analyze three clusters of aftershocks from the well-recorded sequence following the M5 Au Sable Forks, NY, earthquake to obtain some of the first accurate source parameters for small earthquakes in eastern North America. Each cluster contains a M~ 2, and two contain M~3, as well as smaller aftershocks. Using direct waves, we find that the corner frequencies and stress drops are high (averaging 100 MPa) confirming previous work suggesting that intraplate continental earthquakes have higher stress drops than events at plate boundaries. We also demonstrate that a scaling breakdown suggested by earlier work is simply an artifact of their more band-limited data. We also find that the ratio of Energy to Moment is high, around 10 . We estimate source parameters for the M5 mainshock using similar methods. The stress drop and energy/moment ratio for the mainshock are slightly higher than for the aftershocks. We then apply the coda method to the same sequence to investigate consistency, and uncertainties. The large (M>4) aftershocks of the 1994 Northridge, CA, earthquake are our second choice of sequence for comparison of the methods. These earthquakes already have source parameters determined using time-domain methods (Mori et al., 2003) and so by applying our spectral coda and direct wave methods, we can compare most approaches in common use. We also apply one or both methods to a number of other earthquake sequences including those of recent moderate-sized earthquakes in Italy, and the Wells, Nevada, earthquake.
419
20090914187
2009 Monitoring Research Review: Ground-Based Nuclear Explosion Monitoring Technologies
OBJECTIVES The objectives of this study are to improve low-magnitude regional seismic discrimination by performing a thorough investigation of earthquake source scaling using diverse, high-quality datasets from varied tectonic regions. Local-to-regional high-frequency discrimination requires an estimate of how earthquakes scale with size. Walter and Taylor (2001) developed the MDAC method to empirically account for these effects through regional calibration. The accuracy of these corrections has a direct impact on our ability to identify clandestine explosions in the broad regional areas characterized by low seismicity. Unfortunately our knowledge at small magnitudes (i.e., mh < -4.0) is poorly resolved, and source scaling remains a subject of on-going debate in the earthquake seismology community. Recently there have been a number of empirical studies suggesting scaling of micro-earthquakes is non-self-similar (e.g., Kanamori et al., 1993; Abercrombie, 1995; Mayeda and Walter, 1996; Mori et al., 2003; Stork and Ito, 2004; and Izutani and Kanamori, 2001), yet there are an equal number of compelling studies that would suggest otherwise (e.g., McGarr, 1999; Ide and Beroza, 2001; Imanishi et al., 2004; and Prieto et al., 2004). It is not clear whether different studies reach different conclusions because they use different datasets and scaling varies with location, or because they use different methods. Sonley and Abercrombie (2006) show that small variations in the commonly used methods can lead to significant differences in results. Even in regions that are well studied, such as test sites or areas of high seismicity, we still rely on empirical scaling relations derived from studies taken from half-way around the world at inter-plate regions. In summary, we address the following problems: 1. Do different studies obtain different results because they use different methods, or because they analyse different data sets? We will investigate whether coda and direct wave methods applied to the same datasets provide the same scaling. 2. Is scaling dependent upon the tectonic setting? We will investigate earthquakes from different tectonic settings and depth ranges, using the same coda and direct wave methods. 3. There have been few studies in intra-plate areas where seismicity is low and/or in regions where a clandestine test might occur. The MDAC method currently assumes earthquake source scaling that was derived exclusively from the western United States. Can we extrapolate or transport results from one region to others, or must we calibrate to each specific region? We will analyse earthquakes from both interplate (e.g. California) and intraplate (e.g. Eastern North America) regions to specifically address this question. RESEARCH ACCOMPLISHED Our approach to obtaining improved source parameters for small earthquakes focuses on the direct and coda wave methods: to improve and investigate them both, and then to apply them to diverse data sets. Locally recorded, direct waves from events have been least affected by travel through the earth, and so are thought to be the best candidate for obtaining accurate source parameters. But there are only a limited number of earthquakes that are recorded locally, by sufficient stations to give good azimuthal coverage. Even fewer of these have an equivalently well recorded, very closely located smaller earthquake that meets the stringent criteria required to be a good EGF to remove path effects. This EGF method is the preferred one for isolating the source, but concern about the quality of the EGFs is a major source of uncertainty in studies that use these methods. In contrast, coda waves average radiation from all directions so single-station records should be adequate and previous work suggests that the requirements for the EGF event are much less stringent. It is thus ideal in regions with sparse stations and events so that most events are only well-recorded by a single station. Our approach is to: 1. 2. 3. 4. 5.
Develop an easy to apply coda wave spectral ratio method to obtain source parameters for large groups of earthquakes Identify the mainshock - EGF earthquake pairs that meet stringent criteria for selecting the EGF, and obtain source parameters from the direct waves for this subset of events. Use the direct wave results to confirm, and if necessary correct, the coda wave results Apply these methods to data sets from a range of tectonic environments. Determine the implications of the determined source scaling results for both coda calibration and regional discrimination using MDAC and other similar means of source and path-corrected discriminants.
So far we have developed improved coda wave and direct wave methods that we will apply consistently to all the data sets. The new spectral-ratio method developed in this study makes the coda method much easier and simpler to apply, greatly extending the number of earthquakes that can be studied. The coda wave approach was published by Mayeda et al. (2007). We have applied the coda wave methods to several aftershock sequences in Italy
420
2009 Monitoring Research Review: Ground-Based Nuclear Explosion Monitoring Technologies
(Malagnini and Mayeda 2008, Malganini et al., 2008), and have begun to apply it in eastern North America. In the direct wave study, we have investigated the effects of the various analysis choices commonly made, and also developed criteria for assessing the quality of a particular EGF event. We have performed a very detailed direct wave EGF analysis of aftershocks of the Au Sable Forks earthquake (eastern North America), and obtained some of the best constrained source parameters for earthquakes in this tectonic setting. The direct wave analysis method and results are described by Viegas et al. (2009). In addition to applying both methods to these relatively small data sets, we are all performing a test by analyzing the large (M4-5) aftershocks of the 1994 Northridge, CA, earthquake. Mori et al. (2003) performed a detailed study calculating earthquake source parameters for these earthquakes. They used time domain methods and EGF analysis to calculate stress drop and radiated seismic energy for 47 earthquakes. We are now applying our two frequency domain methods to the same earthquakes, thus enabling us to investigate the differences between three different methods. The principal aims of this comparison work are to search for any systematic differences, and also determine which analysis choices lead to the largest uncertainties. In addition to the possibility of differences between earthquake source spectra obtained from direct and coda waves, in our research we have also uncovered a number of other possible sources of bias in the methods traditionally used by the coda-wave and direct-wave communities in their modeling of the spectra. For example, most direct wave studies fit the spectra individually, whereas the coda-wave studies typically invert a group of events fixing the corner frequency of each earthquake to be the same in all ratios. Also, direct wave studies typically focus on obtaining the parameters for the larger event in an EGF pair, whereas most coda studies ratio all smaller earthquakes to one mainshock in order to obtain parameters for the smaller events in the pairs. We will include analysis of these different approaches in our comparisons. Although they sound small, they can be significant. For example, observations of non-similar scaling in coda wave studies often involve a difference between one or two larger earthquakes and a group of smaller ones (e.g., Malagnini and Mayeda 2008, Malganini et al., 2008). It is possible that this is an artifact from the large earthquakes always being the larger ones in the pairs, and the others the smaller. The Au Sable Forks Earthquake Sequence, Eastern North America: Direct Waves Analysis of earthquakes in stable, intraplate, low seismicity regions is important to characterize these regions, but it is hard because of the sparcity of earthquakes and stations, and hence useful data. Relatively little is known about earthquake sources in intraplate regions, and often relationships based on minimal data, or simply extrapolated from interplate regions are assumed due to lack of local information. For example, Somerville et al. (2002) use the recordings of only 3 moderate-sized earthquakes to propose source scaling relationships for earthquakes in the Northeastern USA and other stable continental regions. Their results imply that earthquakes in the Northeastern USA have relatively high stress drops. This result was confirmed by Shi et al. (1998) who analyzed almost 50 small earthquakes from the region. Their study included 8 empirical Green's function pairs (Shi et al., 1996), but mostly individual earthquakes. They also found a decrease in stress drop with seismic moment, at small magnitudes (< M-3). This may indicate that earthquake source scaling is different in this intraplate region, or else may represent a limit to the resolution as was found earlier in the San Andreas Fault plate boundary region (e.g., Abercrombie and Leary, 1993). Shi et al. (1998) were mostly limited by data availability to using regional recordings at single stations, and so to frequencies less than about 25 Hz. On April 20, 2002 an earthquake of magnitude ML 5.3 occurred in the northeastern Adirondack Mountains - the first earthquake of such size to be recorded by modern regional broadband networks. Following the mainshock, the Lamont-Doherty Earth Observatory deployed a small portable network to monitor aftershocks (Seeber et al., 2002). Between April 22 and November, 2002, 74 small aftershocks detected and located in the epicentral area of the mainshock. These data (200 samples/s) represent the best recorded earthquakes in the region to date, and so provide an unprecedented opportunity to investigate source parameters in this intraplate setting. We calculate the source parameters using two methods commonly applied to direct waves recorded at local stations: spectral modeling of the individual three-component P and S waves (e.g., Abercrombie, 1995), and the Empirical Green's Function (EGF) method (e.g., Mori and Frankel, 1990, Abercrombie and Rice, 2005). Both methods require data with a high-frequency content to work well. Many studies consider the EGF method superior as it corrects for all path and site effects by using a smaller, collocated earthquake as an EGF. The EGF method cannot be used to calculate the seismic moment of the earthquakes, but this is the most reliable information that can be obtained from the individual spectral analysis. Using cross-correlation we identify three clusters of earthquakes with very similar waveforms that include the largest aftershocks recorded by the portable network. All clusters include an M>2, and a
421
2009 Monitoring Research Review: Ground-Based Nuclear Explosion Monitoring Technologies
number of Ml-2 earthquakes, and two clusters also each include an M>3 earthquake. We model the spectra obtained by dividing the spectrum of the large earthquake by the smaller one. We also use regional recordings (100 samples/s) to analyze the M5 mainshock using the largest aftershock (M3.7) as the EGF. These earthquakes are closely located, and the deconvolution produces a source time function, but clearly have a different focal mechanism, and so do not meet the criteria for selecting an EGF that we describe below. Unfortunately, no aftershocks well recorded regionally meet these criteria so we use the largest aftershock, and interpret our results with caution. It is not clear in many studies how close the EGF events are to a perfect Green's function. They are typically too small to obtain focal mechanisms, and the location uncertainties are larger than the preferred separation between events. We select only events that are located within the uncertainties of the large event, and have a high degree of waveform similarity, determined by cross-correlation. As a further test, we transform all the spectral ratios back to the time domain, and we only use pairs where we are able to resolve a clear source pulse. If a source time function is observable in this way, then it demonstrates that the phase components of the spectra are also very similar. This test is similar to the investigation performed by Mori and Frankel (1990) to determine how closely located earthquakes pairs must be for the EGF method to work well. Multitaper methods have long been preferred to calculate source spectra and spectral ratios as they better represent the frequency content of the waveforms than do cosine and other tapers (e.g., Park et al., 1987). Unfortunately, until recently multitaper codes only worked with amplitude spectra and so could not be used to perform the complex deconvolution. We use the multitaper approach recently developed by Prieto et al. (2008) to perform the full complex deconvolution so that we can use the same frequency analysis to obtain both the best spectra, and retrieve the source time functions. We first calculate source parameters using the individual spectra, to determine the seismic moments, and also to compare the results of this standard method with that of the preferred EGF method. Before modeling the individual amplitude spectra, we re-sample them on a logarithmic scale, so that the fits were not biased to the high frequencies. We fit the displacement amplitude spectra with the omega-square source model with the sharper corner preferred by Boatwright (1980) and Abercrombie (1995) to obtain the seismic moment, corner frequency and attenuation Quality factor (Q). We perform a grid search around the preferred parameters to investigate the uncertainties within a range of variance of fit of+5%. We take the mean of all available components and stations to calculate the final value. Following Abercrombie (1995) we assume the circular fault model of Madariaga (1976) to calculate source radius (r), and the solution of Eshelby (1957) for a circular crack to calculate stress drop (Aa). We calculate the radiated seismic energy (Es) by integrating the velocity-squared spectrum, using the data within the available bandwith and the best fitting model to extend the frequency range (Abercrombie 1995). We then apply the EGF method to the earthquakes in the clusters we identified. We use the same amplitude spectra to calculate spectral ratios between the different events, and we also use the extension of the multitaper method to the complex spectra to deconvolve the spectral ratios back to the time domain and so obtain estimates of the source time functions. We only continued the analysis if we obtained a clear source pulse, justifying our choice of EGF event. We resample the spectral ratios on a logarithmic scale (in the same way as the individual spectra) and we model the spectra ratios using the same source model as the individual spectra. We use reasonable constraints on the fitting parameters as a further constraint on the use of EGF pairs and ratios. We then calculate source parameters from the spectral fitting as for the individual spectra. The smallest earthquakes have corner frequencies that are clearly outside the available bandwidth (>80 Hz). The EGF results are preferred because of their better correction for path and site effects. The individual fitting tends to underestimate the corner frequencies (and hence the stress drops) as they get close to the high frequency limit
422
2009 Monitoring Research Review: Ground-Based Nuclear Explosion Monitoring Technologies
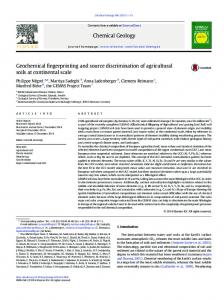
1). The high stress drops we obtain are consistent with the previous studies which find relatively high stress 80 Hz line
30 Hz lire
Figure 1: Stress Drop measurements in Eastern North America. Comparison of the Au Sable sequence, with individual fitting and previous studies. The two studies shown in grey are limited to 30 Hz. The individual measurements underestimate stress drop near the bandwidth limit compared to the EGF. Arrows indicate minimum estimates. No evidence for a breakdown in scaling is seen.
Au Sable Forks. NY (EGF) Au Sabla Forks. NY (Ind) Au Sable Forks. NY (Lg Fit) ENA (Lg Fit) ENA (EGF) Goodnow, NY (EGF) Charlevoix.Quebec (EGF) 10
10" Seismic Moment (N.m)
10'
10
drops for intraplate regions such as eastern North America. They are consistent with the results of Shi et al. (1998) for their EGF events, but we do not see a breakdown in constant stress drop scaling at lower magnitudes, suggesting that this was an artifact of the limited bandwidth available to Shi et al. We obtain relatively high stress drops and apparent stress (proportional to the ratio of E /
1
71 *+A*wHr
f/5 lu
• • r e • 4 A •
"> V> lo-
in
# *Sf A
10'
10"
10
Source Dimension (m)
423
NE America Fenton H« URL SA Mines 1 SA Mines 2 Mammoth Lakes Large Cajon Pass LongValeyLVB " Long Valley EGF LomaPnwa PalmSpnngs SAFOO Assu Brazil SAMines3 ENA Au Sable Forks
Figure 2a. Comparison of the Au Sable Forks results with previous work mainly from the western USA. Figure updated from Abercrombie and Leary (1993), corrected for different source models. Note that recent EGF studies (dark blue) all have higher stress drop than earlier studies.
2009 Monitoring Research Review: Ground-Based Nuclear Explosion Monitoring Technologies
• This Study . Matsuzawa (2004) * Ide et al (2004) • Oye et al (2005) • Yamada et al (2007)
• Imamshi & Ellsworth (2005) . Abercrombie & Rice (2005) . Venkataraman et al (2006) » Venkataraman and Kanamon (2004) • Mori, Abercrombie, & Kanamon (2003)
• Mayeda and Walter (2005)
» Ide, Beroza, Prejean, & Ellsworth (2002
-2-10
34W5678
1
2
-3-
i %
o,4 c
^o -5UJ > Oi~6 ' o _l-7 -8ti
••
%•* "•1• '.* 7
8
i
9
-?-
•
-•
f*
* S *3
w•£
ft
^r
I 10 11
3
•
t
•
-^ ! » •V
5*
V
- -4
Figure 2b. Comparison of the Au Sable Forks results with previous work mainly from the western USA. Figure updated from Ide and Hero/a (2001).
5
+ •>ti
1
•
EJF*
t
r- -7' 12 13 14 15 16 17 18 19 20 21 togM„(Nm)
22
values for the two largest earthquakes. These are less reliable because of the lack of an acceptable EGF event. The Au Sable Forks Earthquake Sequence, Eastern North America: Coda Waves After obtaining reliable, high precision direct wave estimates of the source parameters of the earthquakes in the Au Sable Forks sequence, we then applied the coda-wave methods, in order to compare them. We began by performing a calibration study following the procedure of Mayeda and Walter (1996). For this we could only use regional recordings, and so only the 9 largest earthquakes that were recorded at regional distances. This analysis is therefore limited to the 40 samples/s and 100 samples/s of the regional stations. To obtain the calibration spectra, it was necessary to use an apparent stress of at least 10 MPa, significantly higher than the values typically used in previous studies on the west coast. This is consistent with the direct wave estimate of relatively high stress drop. The coda methods essentially follow the source parameterization and model developed by Walter and Taylor (2001). In this approach, the apparent stress and stress drop are not independent parameters, as they are in the methods typically used for direct wave analysis. This difference is more related to tradition than to any requirements of the different data. In the Walter and Taylor (2001), MDAC approach, the apparent stress is simply proportional to the stress drop, and the radiated seismic energy is dependent on the source model chosen. In direct wave studies, radiated seismic energy is calculated relatively independently of the source model, and hence apparent stress is not directly proportional to stress drop. After performing the calibration, we then calculated spectral ratios of all 8 aftershocks to the mainshock, following the methods of Mayeda et al. (2007), and Malagnini and Mayeda (2008), Figure 3. We compare the corner frequencies obtained from the direct wave and coda wave studies (Figure 4). They agree relatively well for the larger events, but the coda method significantly underestimates the corner frequency and stress drop for the smaller events. This is most likely a bandwidth limitation since the direct wave measurements were made on the local recordings which have larger signal and frequency bandwidth than the regional records. This result serves as a reminder that the coda-wave analyses are subject to similar problems and biases as a result of limited bandwidth as have long been recognized in direct-wave studies. The next step is clearly to use the local records to calculate coda spectral ratios. However, this requires investigation into the use of higher frequency records, resulting from smaller volume scattering in shorter time windows than have previously been used for coda analysis. The window length is limited by the triggered recordings of portable deployments, and the more rapid decay of higher frequency signals. Does it Matter how the Spectral Ratios are Modeled? Mayeda and Malagnini (2009) analyzed the source parameters of the Wells, Nevada, M6 earthquake and 6 of its largest aftershocks using the coda spectral ratio method. They found non self-similar scaling when fitting following the MDAC procedures, and a joint inversion as described by Malagnini and Mayeda (2008) and Malganini et al., (2008). In order to investigate the effects of using different fitting approaches, we fit the same spectra using the fitting methods, and two different source models that we are using for the direct-wave analyses, the Brune (1970)
424
2009 Monitoring Research Review: Ground-Based Nuclear Explosion Monitoring Technologies
model used in MDAC, and the sharper-cornered version of the same (Boatwright 1980). The results are shown in Figure 5. The three different fitting methods all give broadly similar, overlapping results, but do show significant variation, of the order of 40% in seismic moment, 50% in corner frequency, and 100% in stress drop. The variation in seismic moment is perhaps the least expected. In all ratios, an amplitude ratio between the large earthquake (of known, fixed moment) and the smaller earthquake is calculated. In the sharper-corner model, this long-period amplitude level is smaller, and so the moments of the aftershocks are larger.
78-W
76-W
74'W
72-W
70"W
46" N
46-N
44"N
44'N
42"N
42'N
JS*1
468 2 10"' 78"W
76"W
74-W
72'W
48
&nU I0 Frequency (Hz)
2
458 10
7ITW
Figure 3. Coda wave analysis of the Au Sable Forks earthquake sequence, (a) map of the earthquakes and stations used, (b) calibrated source spectra of the MS earthquake (blue) and the 8 larger aftershocks.
425
2009 Monitoring Research Review: Ground-Based Nuclear Explosion Monitoring Technologies
EGF vs Coda Corner Frequency 30
io3
. N
•^v\\
X_X
a
I10'
\N >\
/
-M4.7 M4.7 -M2.8: — M2.5 — M2.5 — M3.2 — M2.6 •
25
f*20
15
' M0.1
—-^
^/
O 10
— M3.1 -M3.0
o UJ
Mainshockto 8 aftershocks
.
-£M3 0
^^
M1.7 10 15 20 Coda Comer Frequency (Hz)
101 Frequency (Hz)
10-
fi
\K—j ....
101 CodaRatb
M5 M37 M3.1
25
Figure 4. Coda spectral ratios of the Au Sable Forks earthquake with the larger aftershocks (left) and comparison of the direct wave and coda wave estimates of the corner frequencies for 5 earthquakes in the Au Sable Forks sequence. The coda data do not have sufficient high frequency bandwidth to resolve the corner frequencies of the smaller earthquakes well.
Results for Wells Coda fitting O 5 x
*4'
-1 15 26
155
16
16.5
17.5
•7
'
18 '
24
2.2 2.0 ^ 1.8
185 *1
Figure 5. Fitting the spectral ratios of the Wells earthquakes using three different methods: combined inversion following MDAC (green), and individually fitting ratios using Brune (1970) model (blue) and the sharper corner version (red).
i
1.6. 1.4
• Sh»rpCo*ncf softwai shape * Coda Gnd tM