4. Title and Subtitle. Seismic Vulnerability and Post-Event Actions for Texas Bridge ...... From scoring the answers to these questions, we categorize individual ...... Sellards (1935) performed a field study investigating an earthquake occurring 12 April .... have undergone various episodes of secondary and tertiary recovery.
TECHNICAL REPORT 0-6916-1 TxDOT PROJECT NUMBER 0-6916
Seismic Vulnerability and Post-Event Actions for Texas Bridge Infrastructure Farid Khosravikia Anderson Potter Vyacheslav Prakhov Georgios Zalachoris Tianjian Cheng Ayushi Tiwari Patricia Clayton Brady Cox Ellen Rathje Eric Williamson Jeffrey Paine Cliff Frohlich
December 2017; Published November 2018 http://library.ctr.utexas.edu/ctr-publications/0-6916-1.pdf
1. Report No. FHWA/TX-18/0-6916-1
Technical Report Documentation Page 2. Government 3. Recipient’s Catalog No. Accession No.
4. Title and Subtitle Seismic Vulnerability and Post-Event Actions for Texas Bridge Infrastructure 7. Author(s) Farid Khosravikia, Anderson Potter, Vyacheslav Prakhov, Georgios Zalachoris, Tianjian Cheng, Ayushi Tiwari, Patricia Clayton, Brady Cox, Ellen Rathje, Eric Williamson, Jeffrey Paine, Cliff Frohlich
5. Report Date December 2017; Published November 2018 6. Performing Organization Code 8. Performing Organization Report No. 0-6916-1
9. Performing Organization Name and Address Center for Transportation Research The University of Texas at Austin 3925 W. Braker Lane, 4th Floor Austin, TX 78759
10. Work Unit No. (TRAIS) 11. Contract or Grant No. 0-6916
12. Sponsoring Agency Name and Address Texas Department of Transportation Research and Technology Implementation Office P.O. Box 5080 Austin, TX 78763-5080
13. Type of Report and Period Covered Technical Report (07/01/2015–12/30/2017) 14. Sponsoring Agency Code
15. Supplementary Notes Project performed in cooperation with the Texas Department of Transportation and the Federal Highway Administration. 16. Abstract The research investigates the seismic vulnerability of bridges in Texas by characterizing seismic hazards in the State, developing computational tools to estimate the likelihood of seismic damage to various bridge types, and providing TxDOT tools to inform post-earthquake response planning and decision-making. 17. Key Words Seismic hazard, vulnerability, fragility, nonlinear bridge modelling 19. Security Classif. (of report) Unclassified
18. Distribution Statement No restrictions. This document is available to the public through the National Technical Information Service, Springfield, Virginia 22161; www.ntis.gov.
20. Security Classif. (of this page) Unclassified
21. No. of pages 350
Form DOT F 1700.7 (8-72) Reproduction of completed page authorized
22. Price
Seismic Vulnerability and Post-Event Actions for Texas Bridge Infrastructure Farid Khosravikia Anderson Potter Vyacheslav Prakhov Georgios Zalachoris Tianjian Cheng Ayushi Tiwari Patricia Clayton Brady Cox Ellen Rathje Eric Williamson Jeffrey Paine Cliff Frohlich
CTR Technical Report:
0-6916-1
Report Date:
December 2017; Published November 2018
Project:
0-6916
Project Title:
Seismic Vulnerability and Post-Event Actions
Sponsoring Agency:
Texas Department of Transportation
Performing Agency:
Center for Transportation Research at The University of Texas at Austin
Project performed in cooperation with the Texas Department of Transportation and the Federal Highway Administration.
Center for Transportation Research The University of Texas at Austin 3925 W. Braker Lane, 4th floor Austin, TX 78701 http://ctr.utexas.edu/
Disclaimers Author's Disclaimer: The contents of this report reflect the views of the authors, who are responsible for the facts and the accuracy of the data presented herein. The contents do not necessarily reflect the official view or policies of the Federal Highway Administration or the Texas Department of Transportation (TxDOT). This report does not constitute a standard, specification, or regulation. Patent Disclaimer: There was no invention or discovery conceived or first actually reduced to practice in the course of or under this contract, including any art, method, process, machine manufacture, design or composition of matter, or any new useful improvement thereof, or any variety of plant, which is or may be patentable under the patent laws of the United States of America or any foreign country.
Engineering Disclaimer NOT INTENDED FOR CONSTRUCTION, BIDDING, OR PERMIT PURPOSES.
Research Supervisor: Dr. Patricia Clayton
v
Acknowledgments The authors would like to extend appreciation to the Texas Department of Transportation for providing the funding for this project. In particular, the authors would like to thank Joe Adams, the TxDOT Project Manager, and members of the Project Monitoring Committee for their assistance and guidance with the research.
vi
Table of Contents Chapter 1. Introduction ............................................................................................................... 1 1.1. Overview ...................................................................................................................... 1 1.2. Project Objectives and Report Outline ........................................................................ 2 Chapter 2. Seismicity of Texas and Surrounding Regions........................................................ 3 2.1. Overview ...................................................................................................................... 3 2.2. Historical Background ................................................................................................. 3 2.3. Induced Earthquake Activity in Four Regions of Texas .............................................. 9 2.3.1. Texas Gulf Coast........................................................................................... 9 2.3.2. Northeast Texas .......................................................................................... 13 2.3.3. West Texas .................................................................................................. 21 2.3.4. Texas Panhandle ......................................................................................... 25 2.4. Natural Earthquakes in Texas .................................................................................... 26 2.4.1. Texas Gulf Coast......................................................................................... 26 2.4.2. Northeast Texas .......................................................................................... 26 2.4.3. West Texas .................................................................................................. 28 2.4.4. Texas Panhandle ......................................................................................... 29 2.5. Seismicity in Regions Neighboring Texas ................................................................. 29 2.5.1. Oklahoma .................................................................................................... 29 2.5.2. The New Madrid Region ............................................................................ 29 2.5.3. Louisiana, New Mexico, and the Gulf of Mexico ...................................... 32 2.5.4. Mexico ........................................................................................................ 33 2.6. Discussion .................................................................................................................. 33 2.6.1. Induced Earthquakes across Texas through Time ...................................... 33 2.6.2. The Multiple Causes of Induced Earthquakes in Texas.............................. 34 2.7. Summary .................................................................................................................... 36 Chapter 3. Texas Geologic Conditions and VS30 Maps ............................................................ 37 3.1. Overview .................................................................................................................... 37 3.2. Geologic Maps of Texas ............................................................................................ 38 3.3. Existing Shear Wave Velocity Profiles...................................................................... 45 3.4. VS30 Proxy Method ..................................................................................................... 49
vii
3.4.1. VS30 Proxy by Geologic Units ..................................................................... 49 3.4.2. VS30 Proxy by Topographic Slope ............................................................... 58 3.4.3. VS30 Proxy by Terrain .................................................................................. 62 3.4.4. VS30 Proxy by P-wave Seismogram............................................................. 66 3.5. Initial Proxy-based VS30 Maps of Texas ..................................................................... 72 3.6. VS30 from In-Situ Measurements ................................................................................ 75 3.7. VS30 Maps of Texas .................................................................................................... 80 3.8. Summary .................................................................................................................... 82 Chapter 4. Representative Ground Motions ............................................................................ 83 4.1. Overview .................................................................................................................... 83 4.2. Catalog of Earthquake Events .................................................................................... 83 4.3. Seismic Stations in Texas, Oklahoma, and Kansas ................................................... 84 4.4. Selection of Ground Motions for Structural Response History Analyses ................. 85 4.5. Summary .................................................................................................................... 93 Chapter 5. Texas Hazard Maps ................................................................................................. 94 5.1. Introduction ................................................................................................................ 94 5.2. Seismic Hazard in the State of Texas ........................................................................ 94 5.3. Ground Motion Model for Texas Hazard Maps ........................................................ 96 5.4. Hazard Maps for Deterministic Earthquake Event Scenarios.................................... 98 5.5. Summary .................................................................................................................. 104 Chapter 6. TxDOT Bridge Inventory and Representative Bridges ..................................... 105 6.1. Overview .................................................................................................................. 105 6.2. Bridge Classes .......................................................................................................... 105 6.3. Bridge Geometric Statistics ..................................................................................... 108 6.3.1. Number of Spans....................................................................................... 109 6.3.2. Span Length .............................................................................................. 112 6.3.3. Deck Width ............................................................................................... 116 6.3.4. Vertical Under-Clearance ......................................................................... 119 6.3.5. Skew Angle ............................................................................................... 120 6.3.6. Year of Construction ................................................................................. 121 6.4. Bridge Components and Typical Details ................................................................. 123 6.4.1. Material Properties .................................................................................... 124 viii
6.4.2. Superstructure ........................................................................................... 124 6.4.3. Substructure .............................................................................................. 134 6.4.4. Bearings .................................................................................................... 148 6.4.5. Damping Ratio .......................................................................................... 154 6.4.6. Loading Direction ..................................................................................... 154 6.4.7. Summary of Random Variables ................................................................ 155 6.5. Bridge Configurations .............................................................................................. 155 6.5.1. Sampling Methodology............................................................................. 156 6.5.2. Bridge Geometric Samples ....................................................................... 158 6.5.3. Bridge Parametric Samples ....................................................................... 161 6.6. Summary .................................................................................................................. 165 Chapter 7. Model Development ............................................................................................... 167 7.1. Overview .................................................................................................................. 167 7.2. General Modeling Assumptions .............................................................................. 167 7.2.1. 2D and 3D Models .................................................................................... 167 7.2.2. Types of Analysis ..................................................................................... 168 7.2.3. Modeling Approach .................................................................................. 169 7.3. Superstructure .......................................................................................................... 170 7.4. Joint .......................................................................................................................... 173 7.5. Bearings ................................................................................................................... 176 7.5.1. Steel Bearings ........................................................................................... 176 7.5.2. Elastomeric Bearings ................................................................................ 187 7.6. Bent .......................................................................................................................... 188 7.6.1. Columns .................................................................................................... 189 7.6.2. Bent Caps .................................................................................................. 200 7.7. Foundation ............................................................................................................... 200 7.8. Abutment.................................................................................................................. 202 7.9. Assembly.................................................................................................................. 204 7.10. Example Nonlinear Time-History Analysis........................................................... 210 7.11. Model Properties of Representative Bridges ......................................................... 219 7.11.1. Steel Girder Bridges ................................................................................ 220 7.11.2. Concrete Girder Bridges ......................................................................... 221
ix
7.11.3. Concrete Slab Bridges............................................................................. 222 7.12. Summary ................................................................................................................ 223 Chapter 8. Fragility Curves ..................................................................................................... 225 8.1. Overview .................................................................................................................. 225 8.2. Analytical Fragility Procedure ................................................................................. 225 8.3. Probabilistic Seismic Demand Model ...................................................................... 227 8.4. Probabilistic Seismic Capacity Model ..................................................................... 231 8.4.1. Columns .................................................................................................... 234 8.4.2. Bearings .................................................................................................... 239 8.4.3. Abutments ................................................................................................. 241 8.4.4. Foundations and Expansion Joints ............................................................ 242 8.5. Component-Level Fragility Curves ......................................................................... 243 8.6. System-Level Fragility Curves ................................................................................ 248 8.7. Summary .................................................................................................................. 253 Chapter 9. Post-Earthquake Action Plans.............................................................................. 255 9.1. Overview .................................................................................................................. 255 9.2. Inspection Criteria .................................................................................................... 255 9.3. Inspection Decisions for Fort Worth Earthquake Scenario ..................................... 257 9.4. Summary .................................................................................................................. 264 References .................................................................................................................................. 265 Appendix A: Records of Earthquakes in Texas ...........................................................................275 Appendix B: Information on the Selected Ground Motions ........................................................296 Appendix C: As-Built Drawings ..................................................................................................302 Appendix D: Appendix D. Girder and Column Spacing and Number ........................................303 Appendix E: Parameter Samples .................................................................................................306 Appendix F: Correlation of Seismic Demands for Bridge Classes..............................................326
x
List of Tables Table 2.1: Five questions to assess how strongly the evidence suggests an earthquake is induced .....................................................................................................................................5 Table 3.1: List of the 1:250,000-scale geologic maps of the Bureau of Economic Geology’s Geologic Atlas of Texas series ..............................................................................................38 Table 3.2: Primary lithologic descriptions for the six rock types defined in this study ................43 Table 3.3 Measured shear wave velocity profiles in Texas ...........................................................47 Table 3.4: Measured shear wave velocity profiles in Texas (cont’d) ............................................48 Table 3.5: Geology-based VS30 proxy relationships for California from Wills and Silva (1998) .....................................................................................................................................50 Table 3.6: NEHRP seismic site classes based on VS30, from BSSC (2001) ...................................51 Table 3.7: Geology-based VS30 proxy relationships for California from Wills and Clahan (2006) .....................................................................................................................................53 Table 3.8: Geology-based VS30 proxy relationships for central and eastern North America from Kottke et al. (2012) .......................................................................................................54 Table 3.9: Geology-based VS30 proxy relationships for central and eastern North America from Parker et al. (2016) ........................................................................................................55 Table 3.10: Median VS30 values for surficial geologic units (Cox et al. 2011) ..............................58 Table 3.11: Summary of slope ranges for VS30 categories from Wald and Allen (2007) ..............60 Table 3.12: Mean VS30 (μlnV) and standard deviation (σlnV) values for different geologic age and rock type groupings, based on data from Zalachoris et al. (2017) ..................................74 Table 3.13: VR40 and VS30 values at seismic station locations in the Dallas/Fort Worth obtained in-situ surface wave measurements .........................................................................79 Table 6.1: Superstructure material types listed in NBI ................................................................106 Table 6.2: Superstructure design types listed in NBI ..................................................................106 Table 6.3: Texas bridge classes ...................................................................................................107 Table 6.4: Span number statistics ................................................................................................111 Table 6.5: Maximum span length statistics..................................................................................113 Table 6.6: Deck width statistics ...................................................................................................117 Table 6.7: Skew angle statistics ...................................................................................................121 Table 6.8: Construction year statistics .........................................................................................122 Table 6.9: Table of required beam sizes (TxDOT 2015) .............................................................126 Table 6.10: Section properties of sampled girders for MSSTEEL configurations ......................126 Table 6.11: MCSTEEL girder parameter comparison .................................................................128 Table 6.12: MC steel girder section properties ............................................................................129 Table 6.13: Bent cap dimensions per bridge class .......................................................................137 Table 6.14: Column properties and reinforcing details for column with different sizes .............139 xi
Table 6.15: Translation foundation stiffness (Ramanathan 2012) ...............................................145 Table 6.16: Summary of parameters and distribution characteristics ..........................................155 Table 6.17: Geometric samples of multi-span continuous steel girder (MCSTEEL) bridges ..............................................................................................................................................159 Table 6.18: Geometric samples of multi-span steel girder (MSSTEEL) bridges ........................159 Table 6.19: Geometric samples of multi-span prestressed concrete girder (MSPC) bridges ......159 Table 6.20: Geometric samples of multi-span reinforced concrete girder (MSRC) bridges .......160 Table 6.21: Geometric samples of single span prestressed concrete girder (SSPC) bridges .......160 Table 6.22: Geometric samples of multi-span continuous reinforced concrete slab (MCRCslab) ......................................................................................................................................160 Table 6.23: Geometric samples of multi-span reinforced concrete slab (MSRC-slab) bridges ..................................................................................................................................161 Table 6.24: MSPC parameters for geometric sample 1 ...............................................................161 Table 6.25: MSPC parameters for geometric sample 2 ...............................................................162 Table 6.26: MSPC parameters for geometric sample 3 ...............................................................162 Table 6.27: MSPC parameters for geometric sample 4 ...............................................................163 Table 6.28: MSPC parameters for geometric sample 5 ...............................................................163 Table 6.29: MSPC parameters for geometric sample 6 ...............................................................164 Table 6.30: MSPC parameters for geometric sample 7 ...............................................................164 Table 6.31: MSPC parameters for geometric sample 8 ...............................................................165 Table 7.1: Column nonlinear modeling parameters (ACI 2016) .................................................193 Table 7.2: Modification factors for development length (ACI, 2014) .........................................195 Table 7.3: Fundamental period of steel girder bridges in the horizontal direction ......................221 Table 7.4: Fundamental period of reinforced and prestressed concrete girder bridges ...............222 Table 7.5: Fundamental period of reinforced concrete slab bridges ............................................223 Table 8.1: PSDM parameter estimations for MCSTEEL bridges................................................229 Table 8.2: PSDM parameter estimations for MSSTEEL bridges ................................................229 Table 8.3: PSDM parameter estimations for MSPC bridges .......................................................229 Table 8.4: PSDM parameter estimations for MSRC bridges .......................................................230 Table 8.5: PSDM parameter estimations for SSPC bridges ........................................................230 Table 8.6: PSDM parameter estimations for MCRC-slab bridges ..............................................230 Table 8.7: PSDM parameter estimations for MSRC-slab bridges ...............................................231 Table 8.8: Qualitative damage state descriptions considering Texas specific details .........................232 Table 8.9: Column limit state comparison ...................................................................................235 Table 8.10: Column limit state values suggested by ASCE 41-17 ..............................................238 Table 8.11: Limit state median and dispersion values for bridge components ............................243 Table 8.12: Correlation of seismic demands for MCSTEEL bridges ..........................................249
xii
Table 8.13: Median PGA (in units of g) and dispersion of fragility curves of the bridge systems .................................................................................................................................251 Table 9.1: Existing response plan of TxDOT to earthquake .......................................................255 Table 9.2: PGA threshold for different bridge classes .................................................................257 Table 9.3: Number of bridges requiring inspection after the hypothetical M6 Fort Worth earthquake scenario ..............................................................................................................264 Table A.1: Catalog of Texas earthquakes having magnitude 3 or greater ...................................276 Table A.2: Catalog of Texas earthquakes, scored to assess whether event may be induced .......284 Table B.1: Information on selected ground motion recordings ...................................................296 Table C.1: As-built drawing inventory ........................................................................................302 Table D.1: Number and spacing of girder and column for MCSTEEL bridges ..........................303 Table D.2: Number and spacing of girder and column for MSSTEEL bridges ..........................303 Table D.3: Number and spacing of girder and column for MSPC bridges..................................304 Table D.4: Number and spacing of girder and column for MSRC bridges .................................304 Table D.5: Number and spacing of girder for SSPC bridges .......................................................304 Table D.6: Number and spacing of column for reinforced concrete slab bridges .......................305 Table E.1: MCSTEEL modeling parameters for geometric sample 1 .........................................306 Table E.2: MCSTEEL modeling parameters for geometric sample 2 .........................................307 Table E.3: MCSTEEL modeling parameters for geometric sample 3 .........................................307 Table E.4: MCSTEEL modeling parameters for geometric sample 4 .........................................308 Table E.5: MCSTEEL modeling parameters for geometric sample 5 .........................................308 Table E.6: MCSTEEL modeling parameters for geometric sample 6 .........................................309 Table E.7: MCSTEEL modeling parameters for geometric sample 7 .........................................309 Table E.8: MCSTEEL modeling parameters for geometric sample 8 .........................................310 Table E.9: MSSTEEL modeling parameters for geometric sample 1 .........................................310 Table E.10: MSSTEEL modeling parameters for geometric sample 2 .......................................311 Table E.11: MSSTEEL modeling parameters for geometric sample 3 .......................................311 Table E.12: MSSTEEL modeling parameters for geometric sample 4 .......................................312 Table E.13: MSSTEEL modeling parameters for geometric sample 5 .......................................312 Table E.14: MSSTEEL modeling parameters for geometric sample 6 .......................................313 Table E.15: MSSTEEL modeling parameters for geometric sample 7 .......................................313 Table E.16: MSSTEEL modeling parameters for geometric sample 8 .......................................314 Table E.17: MSRC modeling parameters for geometric sample 1 ..............................................314 Table E.18: MSRC modeling parameters for geometric sample 2 ..............................................314 Table E.19: MSRC modeling parameters for geometric sample 3 ..............................................315 Table E.20: MSRC modeling parameters for geometric sample 4 ..............................................315 xiii
Table E.21: MSRC modeling parameters for geometric sample 5 ..............................................315 Table E.22: MSRC modeling parameters for geometric sample 6 ..............................................316 Table E.23: MSRC modeling parameters for geometric sample 7 ..............................................316 Table E.24: MSRC modeling parameters for geometric sample 8 ..............................................316 Table E.25: SSPC modeling parameters for geometric sample 1 ................................................317 Table E.26: SSPC modeling parameters for geometric sample 2 ................................................317 Table E.27: SSPC modeling parameters for geometric sample 3 ................................................318 Table E.28: SSPC modeling parameters for geometric sample 4 ................................................318 Table E.29: SSPC modeling parameters for geometric sample 5 ................................................319 Table E.30: SSPC modeling parameters for geometric sample 6 ................................................319 Table E.31: SSPC modeling parameters for geometric sample 7 ................................................320 Table E.32: SSPC modeling parameters for geometric sample 8 ................................................320 Table E.33: MCRC-slab modeling parameters for geometric sample 1 ......................................320 Table E.34: MCRC-slab modeling parameters for geometric sample 2 ......................................321 Table E.35: MCRC-slab modeling parameters for geometric sample 3 ......................................321 Table E.36: MCRC-slab modeling parameters for geometric sample 4 ......................................321 Table E.37: MCRC-slab modeling parameters for geometric sample 5 ......................................322 Table E.38: MCRC-slab modeling parameters for geometric sample 6 ......................................322 Table E.39: MCRC-slab modeling parameters for geometric sample 7 ......................................322 Table E.40: MCRC-slab modeling parameters for geometric sample 8 ......................................323 Table E.41: MSRC-slab modeling parameters for geometric sample 1 ......................................323 Table E.42: MSRC-slab modeling parameters for geometric sample 2 ......................................323 Table E.43: MSRC-slab modeling parameters for geometric sample 3 ......................................324 Table E.44: MSRC-slab modeling parameters for geometric sample 4 ......................................324 Table E.45: MSRC-slab modeling parameters for geometric sample 5 ......................................324 Table E.46: MSRC-slab modeling parameters for geometric sample 6 ......................................325 Table E.47: MSRC-slab modeling parameters for geometric sample 7 ......................................325 Table E.48: MSRC-slab modeling parameters for geometric sample 8 ......................................325 Table F.1: Correlation of the seismic demands for MCSTEEL bridges ......................................326 Table F.2: Correlation of the seismic demands for MSSTEEL bridges ......................................326 Table F.3: Correlation of the seismic demands for MSPC bridges .............................................326 Table F.4: Correlation of the seismic demands for MSRC bridges .............................................327 Table F.5: Correlation of the seismic demands for SSPC bridges ...............................................327 Table F.6: Correlation of the seismic demands for MCRC-slab bridges .....................................327 Table F.7: Correlation of the seismic demands for MSRC-slab bridges .....................................328
xiv
List of Figures Figure 2.1: Earthquakes in Texas with magnitude M ≥3 since 1975...............................................4 Figure 2.2: Texas seismograph stations ...........................................................................................6 Figure 2.3: Texas oil and gas wells ..................................................................................................7 Figure 2.4: Location and maximum monthly injection volumes for active injection wells in Texas ........................................................................................................................................8 Figure 2.5: Strength of evidence supporting an induced cause for Texas earthquakes 1847– 2015........................................................................................................................................10 Figure 2.6: Map locations of earthquake sequences discussed in this report ................................11 Figure 2.7: Map of subsidence in the Goose Creek Oil Field, Texas (Pratt and Johnson 1926) ......................................................................................................................................11 Figure 2.8: Felt reports and injection disposal wells near the 20 October 2011 MW4.8 Fashing earthquake ................................................................................................................12 Figure 2.9: Felt report summary for the 25 April 2010 m3.9 Alice earthquake ............................14 Figure 2.10: Felt report summary for the 9 April 1932 M4.0 Wortham-Mexia earthquake..........15 Figure 2.11: Earthquakes, injection wells, and production wells at the Dallas-Fort Worth International Airport ..............................................................................................................17 Figure 2.12: Earthquakes and injection wells in the 2012–13 Timpson sequence ........................19 Figure 2.13: Earthquakes near Azle and regional geologic structure ............................................21 Figure 2.14: Earthquakes 2009–2011 and gas injection wells near Snyder TX ............................24 Figure 2.15: Seismicity 1976–1979 and oil fields of the Permian Basin.......................................25 Figure 2.16: Petroleum fields and felt intensities for the 20 June 1936 Panhandle earthquake (Frohlich and Davis 2002) ...................................................................................27 Figure 2.17: Felt area map for the 16 August 1931 Valentine earthquake (Frohlich and Davis 2002) ............................................................................................................................28 Figure 2.18: Seismicity of Oklahoma for 1973–2016, as reported by the U.S. Geological Survey ....................................................................................................................................30 Figure 2.19: Location of mapped faults in southern Oklahoma, including the Meers Fault (M) (Crone and Luza 1990) ...................................................................................................31 Figure 2.20: Estimated felt area map for the New Madrid, Missouri earthquake, December 1811........................................................................................................................................32 Figure 3.1: Map showing the distribution of the 38 map sheets that comprise the Geologic Atlas of Texas ........................................................................................................................39 Figure 3.2: Generalized geologic map of Texas (modified from Barnes, 1992) ...........................40 Figure 3.3: Physiographic map of Texas (modified from Wermund, 1996) .................................41 Figure 3.4: Spatial distribution of mapped units ............................................................................44 Figure 3.5: Locations of Vs measurements in Texas .....................................................................46
xv
Figure 3.6: Histogram showing the distribution of all measured VS30 values for Quaternary alluvium from Wills and Silva (1998) ...................................................................................51 Figure 3.7: California maps showing 7 site conditions in the left and 19 geologic categories. In the right from Wills and Clahan (2006).............................................................................54 Figure 3.8: Geologic map for Port-au-Prince, Haiti from Cox et al. (Cox et al. 2011) .................57 Figure 3.9: Typical VS30 values for Holocene units in different areas ...........................................59 Figure 3.10: Correlations of measured VS30 (m/sec) versus topographic slope (m/m) ..................60 Figure 3.11: Estimated VS30 map for the continental United States east of the Rocky Mountains ..............................................................................................................................61 Figure 3.12: Flow chart (Iwahashi and Pike 2007) for automated nested-means classification of topography ...................................................................................................64 Figure 3.13: Nested-means half/half partitioning shown diagrammatically (Iwahashi and Pike 2007) for gray-scaled images of three input variables and 8, 12, and 16 output classes ....................................................................................................................................65 Figure 3.14: Terrain map of California (Iwahashi and Pike 2007) with locations (black circles) of 853 VS30 values (Yong et al. 2012) .......................................................................66 Figure 3.15: Plot describing mean VS30 values found in terrain types in California .....................66 Figure 3.16: Schematic sketch showing the incident P-wave and reflected P- and SV-waves (Kim et al. (2016)) .................................................................................................................67 Figure 3.17: Surface ground motion (velocity) time series ...........................................................68 Figure 3.18: Schematic sketch of ray path for the crustal structure simplified to two layers (Kim et al. 2016) ....................................................................................................................69 Figure 3.19: Shear-wave velocities to depth z (VsZ) estimated for 31 selected stations. ..............71 Figure 3.20: P-wave velocity profiles of 16 crustal models in EPRI report: Guidelines for Determining Design Basis Ground Motions (EPRI, 1993) ...................................................72 Figure 3.21: Distribution of VS30 across Texas, Oklahoma, and Kansas (Zalachoris et al. 2017) ......................................................................................................................................74 Figure 3.22: Proxy-based VS30 map of Texas ................................................................................76 Figure 3.23: Locations of VS measurements in Texas, color-coded based on VS30 values ...........78 Figure 3.24: Comparison of estimated VS30 values and VS30 values obtained from in-situ measurements at seismic stations in Dallas-Fort-Worth area ................................................80 Figure 3.25: Spatial interpolation of VS30 across Texas based on in-situ VS measurements and P-wave seismogram VS30 estimates.................................................................................81 Figure 3.26: Recommended VS30 map of Texas based on integrated VS30 data from in-situ VS measurements, P-wave seismogram VS30 estimates, and geology-based VS30 protocol ..................................................................................................................................82 Figure 4.1: (a) Locations and magnitudes of selected earthquake events, (b) Locations of seismic recording stations in Texas, Oklahoma, and Kansas ................................................84 Figure 4.2: Ground motion database utilized in this study ............................................................86 Figure 4.3: Earthquake events selected for this study....................................................................87 xvi
Figure 4.4: Histograms of ground motion parameters for the selected recordings ........................89 Figure 4.5: Schematic of the determination of a target response spectrum based on IBC ............90 Figure 4.6: Estimated target response spectra for Dallas and West Texas ....................................90 Figure 4.7: Response spectra of the selected ground motions for different bins of PGA values .....................................................................................................................................91 Figure 4.8: Comparison of normalized response spectra between the selected ground motions with and predictions by GMPEs ..............................................................................92 Figure 5.1: USGS 2017 1-year seismic hazard map – PGA (Petersen et al. 2017) .......................95 Figure 5.2: USGS 2017 1-year seismic hazard map – Sa (1.0 sec)(Petersen et al. 2017). .............95 Figure 5.3: Variation of peak ground acceleration (PGA), and spectral acceleration at 1.0 sec with epicentral distance ...................................................................................................98 Figure 5.4: Detailed VS30 distribution across the Dallas-Fort Worth basin and the El Paso study areas ..............................................................................................................................99 Figure 5.5: Hazard maps for peak ground acceleration, for M = 5.0 and M = 6.0 – Dallas ........100 Figure 5.6: Hazard maps for spectral acceleration at 1.0 sec, for M = 5.0 and M = 6.0 – Dallas ...................................................................................................................................100 Figure 5.7: Hazard maps for peak ground acceleration, for M = 5.0 and M = 6.0 – DallasFort Worth International Airport..........................................................................................101 Figure 5.8: Hazard maps for spectral acceleration at 1.0 sec, for M = 5.0 and M = 6.0 – Dallas-Fort Worth International Airport ..............................................................................101 Figure 5.9: Hazard maps for peak ground acceleration, for M = 5.0 and M = 6.0 – Fort Worth ...................................................................................................................................102 Figure 5.10: Hazard maps for spectral acceleration at 1.0 sec, for M = 5.0 and M = 6.0 Fort Worth ............................................................................................................................102 Figure 5.11: Hazard maps for peak ground acceleration, for M = 5.0 and M = 6.0 – El Paso ..............................................................................................................................................103 Figure 5.12: Hazard maps for spectral acceleration at 1.0 sec, for M = 5.0 and M = 6.0 – El Paso .................................................................................................................................103 Figure 6.1: TxDOT bridge locations in scope of study ...............................................................108 Figure 6.2: Profile of a typical three-span bridge ........................................................................109 Figure 6.3: Cross section of a typical steel girder bridge ............................................................109 Figure 6.4: PMFs of number of spans for multi-span simply supported bridge classes ..............110 Figure 6.5: PMFs of number of spans for multi-span continuously supported bridge classes ..............................................................................................................................................110 Figure 6.6: Sampling range for number of spans of MCRC-slab bridge class ............................112 Figure 6.7: Histograms of maximum span length for multi-span simply supported bridge classes ..................................................................................................................................114 Figure 6.8: Histograms of maximum span length for multi-span continuous bridge classes ......115 Figure 6.9: Histogram of maximum span length for single span bridge types ............................115
xvii
Figure 6.10: Histograms of deck width for multi-span simply supported bridge types ..............117 Figure 6.11: Histograms of deck width for multi-span continuous bridge types.........................118 Figure 6.12: Histogram of deck width for single span bridge types ............................................118 Figure 6.13: Sampling range for deck width of MSPC ...............................................................119 Figure 6.14: Histogram for vertical under-clearance ...................................................................120 Figure 6.15: Diagram depicting skew angle ................................................................................120 Figure 6.16: Histograms of construction year for multi-span simply supported bridge classes ..................................................................................................................................122 Figure 6.17: Histograms of construction year for multi-span continuous bridge types...............123 Figure 6.18: Histograms of construction year for single span bridge types ................................123 Figure 6.19: Bridge component classification for different bridge classes .................................125 Figure 6.20: Linear regressions of girder sections of MCSTEEL bridges ..................................128 Figure 6.21: Typical transvers superstructure cross-section (TxDOT 2004) ..............................130 Figure 6.22: PC girder sections ....................................................................................................131 Figure 6.23: RC girder standard section ......................................................................................132 Figure 6.24: Histogram for types of above ground substructure .................................................135 Figure 6.25: Multi-column bent (Nielson 2005) ..........................................................................136 Figure 6.26: Histogram for types of bent caps .............................................................................136 Figure 6.27: Typical bridge bent, and bent cap detail (TxDOT 1962) ........................................137 Figure 6.28: Typical column cross-section and details (TxDOT 1962) for (a) 30-inch diameter and (b) 24-inch diameter (TxDOT 1970) columns ...............................................139 Figure 6.29: Histogram for types of below-ground substructure .................................................141 Figure 6.30: Typical foundation systems .....................................................................................143 Figure 6.31: Translational foundation stiffness vs. shaft/pile diameter .......................................145 Figure 6.32: Common seat type abutments (Nielson 2005) ........................................................146 Figure 6.33: Integral type abutment .............................................................................................146 Figure 6.34: Horizontal abutment behavior .................................................................................147 Figure 6.35: Typical steel bearings (Mander et al. 1996) ............................................................149 Figure 6.36: Typical steel rocker bearing used in Texas .............................................................150 Figure 6.37: Typical elastomeric bearing (TxDOT 2017) ...........................................................151 Figure 6.38: RC girder and slab bearing details ..........................................................................153 Figure 6.39: Generation of bridge parameter samples by the Latin Hypercube Sampling Approach (Pan 2007) ...........................................................................................................158 Figure 7.1: Bridge global and local coordinate systems (Aviram et al. 2008) ............................169 Figure 7.2: Bridge deck grid model (Filipov 2012) .....................................................................172 Figure 7.3: Deck mass distribution (Filipov 2012) ......................................................................172 Figure 7.4: Deck pounding model (Nielson, 2005) .....................................................................174
xviii
Figure 7.5: Linear contact spring behavior ..................................................................................174 Figure 7.6: Bilinear pounding element behavior .........................................................................175 Figure 7.7: Pounding element hysteresis .....................................................................................176 Figure 7.8: Nonlinear behavior associated with friction..............................................................177 Figure 7.9: Nonlinear behavior associated with restraining ........................................................177 Figure 7.10: Low-type sliding bearing specimen (Mander et al. 1996).......................................178 Figure 7.11: Low-type sliding bearing, longitudinal model (Mander et al. 1996) ......................178 Figure 7.12: Low-type sliding bearing, transverse model (Mander et al. 1996) .........................179 Figure 7.13: Low-type sliding bearing, longitudinal model-test comparison ..............................179 Figure 7.14: Low-type sliding bearing, transverse model-test comparison .................................180 Figure 7.15: Low-type fixed bearing specimen (Mander et al. 1996) .........................................180 Figure 7.16: Low-type fixed bearing, longitudinal model (Mander et al. 1996) .........................181 Figure 7.17: Low-type fixed bearing, transverse model (Mander et al. 1996) ............................181 Figure 7.18: Low-type fixed bearing, longitudinal model-test comparison ................................182 Figure 7.19: Low-type fixed bearing, transverse model-test comparison ...................................182 Figure 7.20: High-type rocker bearing specimen (Mander et al., 1996)......................................183 Figure 7.21: High-type rocker bearing, longitudinal model (Mander et al., 1996) .....................183 Figure 7.22: High-type rocker bearing, transverse specimen (Mander et al., 1996) ...................184 Figure 7.23: High-type rocker bearing, longitudinal model-test comparison ..............................184 Figure 7.24: High-type rocker bearing, transverse model-test comparison .................................185 Figure 7.25: High-type fixed bearing specimen (Mander et al., 1996)........................................185 Figure 7.26: High-type fixed bearing, longitudinal model (Mander et al., 1996) .......................186 Figure 7.27: High-type fixed bearing, transverse specimen (Mander et al., 1996) .....................186 Figure 7.28: High-type fixed bearing, longitudinal model-test comparison ................................187 Figure 7.29: High-type fixed bearing, transverse model-test comparison ...................................187 Figure 7.30: Steel dowel analytical model (Choi, 2002) .............................................................188 Figure 7.31: Column modeling approaches .................................................................................189 Figure 7.32: Column fiber section (Nielson 2005) ......................................................................190 Figure 7.33: Typical column reinforcement in Texas (TxDOT 1962) ........................................191 Figure 7.34: Column backbone curve (ACI 2016) ......................................................................192 Figure 7.35: Modified column backbone curve ...........................................................................192 Figure 7.36: Flexural member stiffness coefficients....................................................................194 Figure 7.37: Column model .........................................................................................................197 Figure 7.38: Sample column backbone curve ..............................................................................198 Figure 7.39: Column testing vs. modeling hysteresis (shear controlled) .....................................199 Figure 7.40: Column testing vs. modeling hysteresis (flexure-controlled) .................................200
xix
Figure 7.41: Winkler Foundation Model (McGann et al. 2011) ..................................................201 Figure 7.42: Pile/shaft element hysteresis ...................................................................................202 Figure 7.43: Abutment models (Nielson, 2005) ..........................................................................203 Figure 7.44: Modified soil model ................................................................................................203 Figure 7.45: Abutment soil element hysteresis ............................................................................204 Figure 7.46: Model schematic for a continuous bridge ...............................................................205 Figure 7.47: Model schematic for a simply-supported bridge .....................................................206 Figure 7.48: Element layout at column bottom ...........................................................................207 Figure 7.49: Element layout at column top..................................................................................208 Figure 7.50: Element layout at bent for a continuous bridge .......................................................208 Figure 7.51: Element layout at bent for a simply-supported bridge ............................................209 Figure 7.52: Element layout at abutment .....................................................................................209 Figure 7.53: Bridge model schematic ..........................................................................................211 Figure 7.54: Bridge mode shape, transverse displacement (Period = 0.51 s) ..............................212 Figure 7.55: Bridge mode shape, longitudinal translation (Period = 0.39 s) ...............................213 Figure 7.56: Bridge mode shape, rotation (Period = 0.35 s) ........................................................213 Figure 7.57: Sample ground motion history ................................................................................214 Figure 7.58: Deck displacement response-history (longitudinal direction) .................................214 Figure 7.59: Deck displacement response-history (transverse direction) ....................................215 Figure 7.60: Deck rotation response-history................................................................................215 Figure 7.61: Column bottom spring hysteresis ............................................................................216 Figure 7.62: Column top spring hysteresis ..................................................................................216 Figure 7.63: Fixed bearing bilinear spring hysteresis ..................................................................217 Figure 7.64: Fixed bearing hysteretic spring hysteresis...............................................................217 Figure 7.65: Rocker bearing bilinear spring hysteresis ...............................................................218 Figure 7.66: Rocker bearing hysteretic spring hysteresis ............................................................218 Figure 7.67: Impact spring hysteresis ..........................................................................................218 Figure 7.68: Abutment soil spring hysteresis ..............................................................................219 Figure 7.69: Abutment shaft spring hysteresis ............................................................................219 Figure 7.70: Bent shaft spring hysteresis .....................................................................................219 Figure 8.1: Analytical fragility function procedure .....................................................................227 Figure 8.2: Illustration of parameters of the PSDM in the transformed space ............................228 Figure 8.3: Bayesian updating of distribution of moderate damage state for columns (Nielson 2005) .....................................................................................................................233 Figure 8.4: Depiction of column performance by design era (Ramanathan, 2012) .....................237 Figure 8.5: Component fragility curves of MCSTEEL bridges ...................................................245
xx
Figure 8.6: Component fragility curves of MSSTEEL bridges ...................................................245 Figure 8.7: Component fragility curves of MSPC bridges ..........................................................246 Figure 8.8: Component fragility curves of SSPC bridges............................................................246 Figure 8.9: Component fragility curves of MSRC bridges ..........................................................247 Figure 8.10: Component fragility curves of MCRC-slab bridges ...............................................247 Figure 8.11: Component fragility curves of MSRC-slab bridges ................................................248 Figure 8.12: Bi-variate joint probability density function ...........................................................250 Figure 8.13: Bridge fragility curves .............................................................................................252 Figure 9.1: Fragility curves for MSSTEEL bridge class .............................................................256 Figure 9.2: Hazard map with MCSTEEL bridges .......................................................................258 Figure 9.3: Hazard map with MSSTEEL bridges ........................................................................259 Figure 9.4: Hazard map with MSPC bridges ...............................................................................260 Figure 9.5: Hazard map with MSRC bridges...............................................................................261 Figure 9.6: Hazard map with MCRC-slab bridges ......................................................................262 Figure 9.7: Hazard map with MSRC-slab bridges .......................................................................263
xxi
Chapter 1. Introduction 1.1. Overview Historically, seismic activity in the State of Texas has not been a source of concern due to the infrequency and low magnitudes of seismic events experienced in the state. Thus, standard bridge details and design practices developed and used by the Texas Department of Transportation (TxDOT) have not explicitly considered seismic hazards. In recent years, however, seismologists have detected a significant increase in the frequency of seismic events occurring across the state (e.g., an average rate of two seismic events per year prior to 2008 has increased to an average of almost twelve events per year in recent years), many of which are thought to be a result of human activity (Frohlich et al. 2016a). The largest earthquakes that have been recorded to date in the State of Texas are the 1931 Valentine Earthquake (6.3 moment magnitude) and the 1995 Alpine Earthquake (5.7 moment magnitude), both thought to be from natural causes. The events in Texas that are believed to be human-induced have yet to reach such large magnitudes. For example, the largest human-induced event in Texas is believed to be the 2011 Fashing earthquake, registering a moment magnitude of 4.8; however, the 2011 earthquake in Prague, Oklahoma (moment magnitude 5.7) and the 2016 earthquake in Pawnee, Oklahoma (moment magnitude 5.8) indicate that potentially human-induced earthquakes can reach higher magnitudes. When considering the lack of seismic detailing for bridges in Texas, the sharp increase in seismicity across the state and the potential for larger magnitude earthquakes (i.e., greater than magnitude 5) has raised significant concern about the seismic vulnerability of Texas bridges. Bridges are vital links in a highway transportation system, and their functionality following an earthquake event plays a major role in the response and recovery of the affected region. With almost 53,000 bridges in the state of Texas, it is important for TxDOT to evaluate the vulnerability of these critical structures and to develop an effective plan to assess the functionality of the state’s transportation network following a seismic event. To evaluate the potential seismic risks to bridges in the State of Texas, it is necessary to characterize the seismic hazards in the State and the seismic vulnerability, or fragility, of the Texas bridge population. Seismic hazard maps can be used to geographically show the distribution of level of shaking that is expected in an earthquake event. To develop seismic hazard maps for Texas, one must develop models to predict the intensity of ground shaking based on earthquake magnitude, distance from the epicenter, and local soil, or site, conditions. Additionally, maps characterizing the local soil conditions across the State must also be developed, which is particularly necessary in Texas where such data are limited. This report presents the research done to characterize and map seismic hazards and site classification (i.e., characterized by the Vs30 parameter) across the State. Additionally, to characterize the seismic vulnerability of the bridge infrastructure in Texas, fragility curves can be produced to predict the likelihood of bridge damage following a given level of earthquake shaking. Developing seismic fragility curves for Texas bridges requires an understanding of the inventory, structural detailing, and seismic behavior of typical bridges in the
1
State. Computational models of representative bridge archetypes subjected to Texas-specific ground motions can be used to evaluate seismic vulnerability. Ultimately, fragility curves produced in this research project can be used to develop a post-event action plan to identify bridge types and bridge components more likely to experience damage. Establishing a post-event response plan based on such a seismic vulnerability assessment can help ensure public safety and facilitate economic and timely bridge inspections following a seismic event.
1.2. Project Objectives and Report Outline The main goal of the present project is to evaluate the seismic vulnerability of Texas bridges and to recommend a plan of action for post-earthquake response based on the seismic vulnerability of various bridge types. To do so, the following major tasks, each of which are discussed in separate chapters in this report, are included in this project: • Assessing the seismicity of Texas and surrounding areas. (Chapter 2) • Assessing the geologic conditions in Texas and estimate the Vs30 maps over the state of Texas. (Chapter 3) • Developing a suite of ground motions representative of the seismic hazards and geologic conditions across the State of Texas. (Chapter 4) • Introducing seismic hazards of Texas and developing hazard maps for deterministic earthquake event scenarios. (Chapter 5) • Characterizing the Texas bridge inventory and creating continuous and simply-supported steel, prestressed, and reinforced concrete bridge samples with geometric and material properties representative of those found in the TxDOT inventory. (Chapter 6) • Developing nonlinear bridge component models for those bridge samples based on past experimental, analytical, and numerical research done on bridge components, and assembling these component models into full bridge models for response-history analysis. (Chapter 7) • Generating fragility curves for various bridge classes, which describe the probability of a bridge structure reaching a certain level of damage when subjected to different levels of ground motion intensity. (Chapter 8) • Recommending a post-event action plan for TxDOT to identify and prioritize the most vulnerable bridges for inspection and repair efforts, given earthquake location and magnitude. (Chapter 9)
2
Chapter 2. Seismicity of Texas and Surrounding Regions 2.1. Overview This chapter provides relevant background information pertaining to seismicity of Texas and surrounding regions. Much of this chapter, prepared by Dr. Cliff Frohlich as part of this research project, is published in an article entitled, “A historical review of induced earthquakes in Texas,” authored by Frohlich, Heather DeShon, Brian Stump, Chris Hayward, Matt Hornbach, and Jake Walter, which was published in the Seismological Research Letters in August 2016 (Frohlich et al. 2016b). This chapter discusses what is known about induced (human-caused) and natural (tectonic) earthquakes in Texas. Because earthquake hazards vary across the state, a discussion of induced and natural seismicity is provided separately for four specific regions of Texas, including Gulf Coast, Northeast Texas, West Texas, and Texas Panhandle. Then, the seismicity of neighboring states that may affect Texas, including Oklahoma, Louisiana, and New Mexico, are discussed.
2.2. Historical Background In Texas, earthquakes have occurred in close association with activities accompanying petroleum production since 1925. Frohlich et al. (2016a) developed a five-question test to categorize individual events as “tectonic,” “possibly induced,” “probably induced” or “almost certainly induced.” In Texas, the probably induced and almost certainly induced earthquakes are broadly distributed geographically—in the Fort Worth Basin of north Texas, the Haynesville Shale play area of east Texas, along the Gulf Coast in south Texas, and the Permian Basin of west Texas. As the technologies applied to manage petroleum fields have evolved, induced earthquakes have been associated with different practices. In fields being driven by primary recovery prior to 1940, earthquakes occurred in fields extracting high volumes of petroleum from shallow strata. Subsequently, as field pressures decreased and secondary recovery technologies became common, earthquakes also occurred in association with waterflooding operations. Since 2008, the rate of earthquakes with magnitudes greater than 3 has increased from about two per year to twelve per year; much of this change is mostly attributable to earthquakes occurring within a few km of wastewater disposal wells injecting at high monthly rates. For three sequences monitored by temporary local seismograph networks, most hypocenters had focal depths at and deeper than the depth of injection and occurred along mapped faults situated within two km of injection sites. The record clearly demonstrates that induced earthquakes have been broadly distributed in several different geographic parts of Texas over the last 90 years. There has been widespread recognition among seismologists since the 1960s that wastewater injection and other activities commonly associated with petroleum production can sometimes induce earthquakes (Healy et al. 1968; Nicholson and Wesson 1990; Suckale 2009). In recent years there has been a renaissance of interest in induced earthquakes, beginning after October-November
3
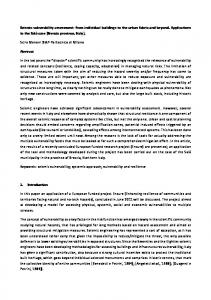
2008 when ten felt earthquakes occurred near an injection well on the Dallas-Fort Worth airport (Frohlich 2012). Figure 2.1 represent the rate of the earthquakes with magnitude greater that three in the state of the Texas. Earthquakes are as cataloged in Table A1 (available in the appendices to this report). Note that beginning about 2008, the rate increased from about two per year to about 12 per year, and this increase occurred in the Northeast, Gulf Coast, and West Texas regions, but not in the Panhandle. As seen in the figure, the events in north Texas were subsequently followed by noticeable increases in the occurrence rate of earthquakes elsewhere in the midwestern U.S. (Petersen et al. 2015), especially in Oklahoma (Keranen et al. 2014; Walsh and Zoback 2015), Arkansas (Horton 2012) and other regions in Texas. There have been 162 Texas earthquakes having M≥3 occurring since 1975 and reported by the National Earthquake Information Center (NEIC) and the International Seismological Centre (ISC); of these, 94 have occurred since 2008. For more information upon these earthquakes one can visit Table A-1 and Table A-2.
Figure 2.1: Earthquakes in Texas with magnitude M ≥3 since 1975 Few geographic regions have had a petroleum industry for as long as, or as vigorous as, Texas. Thus, a review of Texas earthquakes associated with petroleum production activities is useful for comparison with induced earthquakes elsewhere and provides insight about how this phenomenon changes over time scales of decades or greater. One objective of this review is to assemble the available evidence concerning induced Texas earthquakes, including difficult-to-find publications describing older events.
4
Another objective is to evaluate and categorize individual Texas earthquake using a standardized set of criteria. Towards this end we apply a five-question test to evaluate the strength of evidence suggesting an earthquake is induced (Frohlich et al. 2016a). This five-question test (Table 2.1) is based on similar tests proposed some twenty years ago (Davis and Frohlich 1993; Davis et al. 1995). However, the questions have been simplified to apply to both injection- and extractioninduced earthquakes and some questions relating to subsurface pressures and geomechanical modeling have been removed because this information is available for only a small fraction of reported earthquakes. From scoring the answers to these questions, we categorize individual earthquakes as “almost certainly induced,” “probably induced,” “possibly induced” or “tectonic.” Table 2.1: Five questions to assess how strongly the evidence suggests an earthquake is induced QT. Timing: In this location, are earthquakes of this character known to begin only after the commencement of nearby petroleum production or fluid injection operations that could induce seismic activity? QS. Spatial correlation: Are the epicenters spatially correlated with such production or injection operations; i.e., within 5 km for well-determined epicenters, or within 15 km otherwise? QD. Depth: Is information available concerning focal depths of earthquakes at this location, and does this suggest some depths are shallow, probably occurring at or near production or injection depths
For each earthquake and each question QT, QS, QD, QF and QP, answer “Yes,” “Possibly,” or “No” and then score: +1.0 if answer is “Yes; +0.5 if answer is “Possibly”; +0.0 if answer is “No.” Then, to assess how likely it is the earthquake is induced, sum the scores and: If sum = 0.0-1.0: If sum = 1.5–2.0: If sum = 2.5–3.5: If sum = 4.0-5.0:
T PsI PrI ACI
tectonic. possibly induced. probably induced. almost certainly induced.
QF. Faulting: Near production or injection operations, are there mapped faults, or linear groups of epicenters that appear to lie along a fault? Here “near” is within 5 km if the earthquake or earthquake sequence of interest has welldetermined epicenters, or within 15 km otherwise. QP. Published analysis: Is there a credible published paper or papers linking the seismicity to production or injection operations?
Texas earthquakes associated with petroleum operations and here categorized as induced have occurred since 1925, but the amount and quality of data available to evaluate a possible causal relationship has changed considerably over time. Figure 2.2 represents seismograph stations in Texas over time. Prior to about 1970 Texas had few seismograph stations, and much of the available information came from felt-report studies. As late as 2005, there were only six continuously-operating seismic stations in Texas providing publicly available data (Figure 2.2), and thus epicenters reported by the NEIC typically had uncertainties of 5–10 km or more (Frohlich 2012; Petersen et al. 2015). At present, there are 17 permanent seismograph stations providing continuous real-time waveform data, and in 2015 the Texas legislature, in response to concern 5
about induced earthquakes, funded a program to install 22 additional stations and establish a statewide monitoring network (Texas House Bill 2 2015). This legislative action and the anticipated expansion of seismic monitoring in Texas provide additional motivation to categorize previously recorded earthquake activity, as we are presently transitioning to an era where Texas seismicity will be more effectively monitored. In addition to these broadband stations, Oklahoma, Arkansas, and New Mexico presently operate statewide seismograph networks to monitor regional seismic activity.
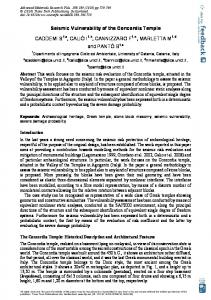
Figure 2.2: Texas seismograph stations Figure 2.3 presents Texas oil and gas wells. The map shows historically significant petroleum fields, and active oil and gas wells as compiled in 2013 by the Texas Bureau of Economic Geology from data supplied by the Texas Railroad Commission. As seen in the figure, petroleum production has been broadly distributed across Texas for almost a century (Hinton and Olien 2002; Olien 2010). The first oil field in Texas with a substantial economic impact was in 1894 near Corsicana, situated about midway between Dallas and Mexia in northeast Texas. The famed Spindletop strike was in 1901 close to Beaumont along the Gulf Coast near the Louisiana border. The Goose Creek Field, south of Houston on the Gulf Coast, opened in 1908 and reached maximum production in 1918. During the 1920s, oil production continued along the Gulf Coast and in northeast Texas. The Mexia and Wortham Fields were discovered in 1920 and 1924. Fields also began producing at numerous locations in the Panhandle and the Permian Basin. The Panhandle Field began producing commercially in 1921; several fields in west Texas opened between 1921 and 1929. In the 1930s and subsequently development of new fields across Texas continued, and earthquakes
6
have been associated with several of these fields: 1930 marked the discovery of the East Texas Field, then one of the largest in the world, and probably responsible for the 1957 Gladewater earthquake; the Stratton Field, apparently responsible for the 1997 and 2010 Alice earthquakes, opened in 1938; the Kelly-Snyder and Cogdell Fields opened in 1948 and 1949; the Imogene and Fashing Fields opened in 1944 and 1958.
Crs: Corsicana GC: Goose Creek Pnh: Panhandle
ET: East Texas KS: Kelly-Snyder ST: Spindletop
F-I: Fashing-Imogene MW: Mexia-Wortham Str: Stratton
Figure 2.3: Texas oil and gas wells The production of oil and gas is often accompanied by the extraction of significant amounts of connate water—water trapped in sedimentary pore spaces. Since the 1930’s much of this produced water has been re-injected into the producing reservoir to improve hydrocarbon recovery. Two such methods are re-injection to maintain reservoir pressure, and waterflooding operations that move oil laterally from water-injection wells to producing wells. Finally, the process of injecting chemicals and/or gases such as CO2 to bring about “tertiary recovery” or “enhanced oil recovery” is widespread nowadays, and has been in use for decades. These technologies are contrasted with the “primary recovery” phase of production, when natural subsurface pressures are sufficient to produce petroleum without waterflooding or other treatments.
7
In other fields, no commercial benefit is achieved from injecting into the producing reservoir, and because produced water is often highly saline, alternate means of water disposal must be employed. Most often, this is accomplished by injection into specially designed and permitted water disposal wells. These disposal wells are numerous and many have been in operation for decades; there are currently tens of thousands of active disposal wells in Texas (Figure 2.4).
Figure 2.4: Location and maximum monthly injection volumes for active injection wells in Texas Much of the present concern about induced seismicity focuses on the development of so-called “unconventional” sources of petroleum—gas or oil that is bound up in strata having permeabilities too low to allow fluid to flow easily. The combination of the technologies of horizontal drilling and hydrofracturing made it possible to selectively increase subsurface permeability and thus exploit unconventional sources. Both technologies had been developed more than 60 years ago, but only began to be exploited on a massive scale in Texas since about 2003 in the Barnett Shale of northeast Texas, since about 2008 in the Haynesville Shale of east Texas, since about 2009 in the Eagle Ford of south Texas, and since about 2011 in the Permian Basin of west Texas. Hydrofracturing in a horizontally-drilled well typically requires water volumes two to three times greater than in a vertical well (Nicot and Scanlon 2012). And when hydrofractured wells enter the
8
production phase much of the injected water returns to the surface as wastewater that requires disposal. For the most part, induced seismicity associated with unconventional petroleum development is associated with wastewater disposal, not the hydrofracturing process itself.
2.3. Induced Earthquake Activity in Four Regions of Texas By applying the five-question test and scoring system to our compilation of Texas earthquakes with reported magnitudes of 3 and greater (Table A-1 and Table A-2, available in the appendices to this report), Figure 2.5 shows the strength of evidence supporting an induced cause for Texas earthquakes 1847–2015. As seen in the figure, it is found that induced earthquakes occurred between 1925 and the present. Some earthquakes are associated with fluid injection, while others are associated with production and/or fluid extraction. Most of these earthquakes are small (magnitude M ≤ 4); however, at least four have had magnitudes of 4.6 and higher. Altogether, for the 162 Texas earthquakes having M≥3 and occurring between 1975 and 2015, 42 (26%) are characterized as almost certainly induced, 53 (33%) as probably induced, 45 (28%) as possibly induced, and the remaining 21 (13%) as tectonic. In the remainder of this section, the most significant induced earthquakes and earthquake sequences in four different geographic regions of Texas are described.
2.3.1. Texas Gulf Coast Goose Creek – 1925: probably induced. Small earthquakes accompanied ground subsidence of up to a meter associated with the production of more than 16x106 m3 of oil, beginning in 1916, from the Goose Creek Field along San Jacinto Bay east of Houston, now called Baytown (Figure 2.6 and Figure 2.7). Gray-shaded areas in Figure 2.6 indicate extent of the Permian Basin, the Barnett Shale, the Haynesville Shale producing area, and the Eagle Ford Shale producing area. None of the available sources list specific dates for the occurrence of these earthquakes, but contemporary descriptions noted that they “shook the houses, displaced dishes, spilled water, and disturbed the inhabitants generally” (Pratt and Johnson, 1926). Commercially important production in the Goose Creek field came from sand lenses at depths of 1000 to 4000 ft (300 to 1200 m). In Pratt and Johnson (1926) and Yerkes and Castle (1976) there are maps of the subsided region, pictures of surface faults or “fractures,” and discussion of the mechanics. Because the subsidence submerged much of the land surface overlying the field to below sea level, the State of Texas, hoping to collect the revenues from oil produced, sued Humble Oil for the rights to the field, which no longer being on land, was not subject to private ownership (Pratt and Johnson 1926). The State lost the suit as the court ruled that the subsidence was an “act of man” caused by the extraction of oil and was not a natural event. Thus, one notable feature of the Goose Creek earthquakes is that there is a court ruling and a 90-year-old precedent supporting the assertion that oil and gas activities induce land subsidence, and accompanying earthquakes in Texas. Fashing – 1973–2012: almost certainly induced. Since Christmas Eve (local time) in 1973, several felt earthquakes have occurred near Fashing in Atascosa County, TX. Events include an 9
M3.6 on 23 July 1983 (Pennington et al., 1986), an M4.3 on 9 April 1993 (Davis et al. 1995), and an MW4.8 20 October 2011 (Frohlich and Brunt 2013). The highest felt intensities were reported as modified Mercalli intensity (MMI) VI, occurred in and near the Fashing gas field in both 1993 and 2011, and fell off to MMI III or less at distances beyond 30 km (Figure 2.6 and Figure 2.8). Focal mechanism for this event is as reported by St. Louis University (Herrmann et al., 2011). The highest-intensity region of this earthquake was situated more than 15 km from the nearest active injections wells, and thus is unlikely to be induced by injection. However, Frohlich and Brunt (Frohlich and Brunt, 2013) showed that earthquakes here in 1973, 1983 and this event followed increases in the rate of extraction of water and petroleum from wells situated within the MMI VVI region shown here (redrawn from Frohlich and Brunt, 2013). A focal mechanism for the 2011 earthquake (Frohlich and Brunt 2013; Herrmann et al. 2011) indicated normal faulting along a NESW trending fault (see Figure 2.8). Pennington et al. (1986) summarized the history of gas production at the Fashing Field. The Fashing Field is in the Edwards Limestone along the upthrown side of a normal fault. Production began in 1958 from horizons at 3.4 km depth; initial bottomhole pressure was 35.2 MPa in 1958 but by 1983 pressures along the fault had dropped to 7.1 MPa, or about 20 per cent of the initial values. Their investigation concluded the Fashing earthquakes up to that time were related to fluid withdrawal (i.e., gas production operations).
Figure 2.5: Strength of evidence supporting an induced cause for Texas earthquakes 1847–2015
10
Cb: locations of 2009–2011 earthquakes near Cleburne
GW: locations of 1957 earthquakes near Gladewater
Figure 2.6: Map locations of earthquake sequences discussed in this report
Note: Here, subsidence contours are in feet, and dots are locations of oil wells. Figure 2.7: Map of subsidence in the Goose Creek Oil Field, Texas (Pratt and Johnson 1926) 11
Circles: Squares: Grey: NEIC: ISC:
indicate locations and MMI values of felt reports injection disposal wells gas fields the epicenter as reported by the National Earthquake Information Center the epicenter as reported by the International Seismological Centre
Figure 2.8: Felt reports and injection disposal wells near the 20 October 2011 MW4.8 Fashing earthquake Investigations of the subsequent earthquakes in 1993 and 2011 reached similar conclusions (Davis et al. 1995; Frohlich and Brunt 2013). Frohlich and Brunt (2013) noted that the 1973, 1993, and 2011 earthquakes all coincided with marked increases in extraction volumes of oil and water from wells in the region experiencing MMI V and greater during the 2011 earthquake. In the five years prior to the 2011 earthquake the nearest active injection disposal wells were 15 km and more distant from the epicentral region. The studies conclude that all the Fashing earthquakes are induced but caused by extraction, not injection.
12
Alice – 1997 and 2010: almost certainly induced. Two nearly identical mbLg3.9 earthquakes occurred on 24 March 1997 (Bilich et al., 1998) and 25 April 2010 (Frohlich et al., 2012) near Alice, TX, about 75 km west of Corpus Christi (Figure 2.6 and Figure 2.9). Labels of MMI levels III and V-VI, in Figure 2.9, indicate locations where individuals provided felt information. Three individuals within the MMI V-VI isoseismal region reported experiencing MMI V or MMI VI. Location labeled “crack” indicates the reported location of 1.6 km-long northeast-southwest crack following the 1997 earthquake. Symbols +, X, and *, respectively, indicate the NEIC epicenters for the 1997 and 2010 earthquakes, and the location for both events determined by Frohlich et al. (2012). Dark and light grey areas are oil and gas fields; mapped faults are from Ewing (1990). Figure reproduced from Frohlich et al. (2012). Their intensities reached MMI V-VI in a region about 10–20 km SE of Alice and approximately along the mapped trace of the Vicksburg Fault and the boundary of the Stratton oil and gas field, which has produced 76x109 m3 of gas and about 16x106 m3 of oil since production commenced in 1938. Analysis of secondary arrivals and surface waves suggested the earthquakes had focal depths of 3 km or less, the approximate depth of the producing Frio formation in the Stratton Field. Following the 1997 earthquake, one resident reported that a 1.6 km-long SW-NE-trending crack had appeared in fields within the highestintensity region. Evidence that supports an induced cause includes the absence of any previously reported regional earthquakes, the shallow focal depths, and the epicenters near the boundary of a field that has produced high volumes of oil and gas for many decades. Elsewhere along the Gulf Coast. Small felt earthquakes occurring in 1984 and subsequently have occurred in Atascosa County about 35 km northwest of Fashing near Pleasanton and Jourdanton, coincident with the Imogene Oil Field. As in the Fashing Field, production in the Imogene Field is also from an upthrown normal fault, at 2.4 km depth, and began in 1944. Following the 1984 earthquake, a small local seismograph network recorded aftershocks that were “found to be at or near the fault contact of the producing horizon of the Imogene Field” (Pennington et al. 1986). This suggests these earthquakes are almost certainly induced, although caused by extraction, not injection. Felt earthquakes have also been reported in Falls City, TX, about 20 km northeast of Fashing in Karnes County (Davis et al. 1995; Olson and Frohlich 1992). These include a magnitude mbLg3.6 on 20 July 1991 and an mbLg4.3 on 7 April 2008. Although Olson and Frohlich (1992) suggested that the 1991 event might be caused by fluid withdrawal, Frohlich and Brunt (2013) noted that the 1991 quake followed an increase in injection beginning in 1990 at nearby disposal wells. Increases in both injection and production occurred prior to the 2008 earthquake. A focal mechanism for the 2008 earthquake (Herrmann et al. 2011) indicated normal faulting along a NE-SW trending strike. As suggested by all the investigations mentioned here, these earthquakes are probably induced.
2.3.2. Northeast Texas Mexia-Wortham – 9 April 1932: almost certainly induced. This earthquake, with an estimated magnitude of M4.0, shook down bricks from several chimneys in Wortham but was only barely 13
perceptible to people at several towns about 20 miles away (Figure 2.6 and Figure 2.10). As seen in Figure 2.10, the relatively high intensities (MMI VI) coinciding with the Wortham Field, and the much lower intensities (III and less) at distances exceeding about 20 km suggest a shallow focal depth. Figure redrawn from Frohlich and Davis (2002).This indicates the focal depth must have been quite shallow. Sellards (1933) reported that the earthquake caused a crack that extended across the highway between the towns of Wortham and Mexia. The regions of highest intensities included the Wortham and Mexia Fields, which had produced more than 15x106 m3 of oil at that time. Sellards (1933) noted that “the fact that the tremor was centered in a region of large oil production lends force to the idea that the tremor may have been caused by adjustment in the land surface incident to operations in the oil fields,” and subsequent publications have also reached this conclusion (Yerkes and Castle 1976).
Figure 2.9: Felt report summary for the 25 April 2010 m3.9 Alice earthquake
14
Roman numerals: dashed lines: Shaded regions
Modified Mercalli Intensities county boundaries major oil fields established prior to 1932
Figure 2.10: Felt report summary for the 9 April 1932 M4.0 Wortham-Mexia earthquake Gladewater – 19 March 1957: probably induced. A series of four earthquakes, the largest having magnitude M4.7, were felt most strongly between Gladewater and Longview and occurred directly above the northern part of the East Texas Field in the area of the highest density of wells. Frohlich and Davis (2002) presented arguments both for and against an induced cause, noting that “The East Texas Field was, at the time of discovery in 1930, the largest field in the Western Hemisphere. By [1957] more than 600x106 m3 of oil had been extracted from the field. The relatively high magnitude and large felt area (45,000 km2) are difficult to explain if it was induced by fluid withdrawal. Moreover, it seems unlikely that a quake with magnitude as great as 4.7 would occur at the relatively shallow production depth of 1 km.” The available information doesn’t provide accurate information about the epicenter or focal depth of this earthquake.
15
Unfortunately, there is no detailed published case history describing the 1957 Gladewater sequence and evaluating its relationship to regional petroleum operations; Frohlich and Davis’s (2002) twopage summary is the most comprehensive source available. Nevertheless, because historical earthquakes are unknown at this location, because of the huge volume of fluid removed from the East Texas Field, because fluid removal over decades-and-longer intervals appears to have induced many of the earthquakes elsewhere in Texas described above, and because published sources have suggested the Gladewater earthquakes may have been induced (Yerkes and Castle 1976), we now categorize this sequence as probably induced. Dallas-Fort Worth International Airport – 2008–2013: almost certainly induced. Beginning on 30 October 2008 people living near the Dallas-Fort Worth International Airport reported experiencing felt earthquakes (Figure 2.6 and Figure 2.11). In Figure 2.11, triangles are 11 earthquakes occurring in 2008 and 2009 and located using data collected by a six-station temporary network; squares are injection disposal wells; circles and white pentagons are bottom-hole and surface locations, respectively, of producing horizontal natural gas wells. Earthquake focal depths were approximately 4.5 km; their epicenters were within 0.5 km of a well that began injecting about 16,000 m3/mo at 4.2 km depth, beginning about seven weeks before the first earthquake was reported. Figure 2.11 is reproduced from Frohlich et al. (2011). These were the first earthquakes known in the Dallas-Fort Worth metropolitan area (DFW) in historical times (i.e., since about 1860). Scientists at Southern Methodist University (SMU) deployed a six-station seismograph network that recorded numerous aftershocks between November 2008 and January 2009. Analysis of these data (Frohlich et al., 2011; Reiter et al., 2012) indicated that all well-recorded events occurred at focal depths of about 4.5 km along an approximately 1-km-long NE-SW linear trend coinciding with a previously mapped fault. The epicenters were within about a km of a wastewater disposal well on the DFW airport property. This well had begun injection operations only seven weeks before the first earthquakes occurred, injecting into the Ellenburger formation at rates of about 48,000 m3/mo between 12 Sept. 2008 and August 2009. Activity at the airport continued well after injection ceased in 2009; the largest earthquake with magnitude mbLg3.4 occurred on 30 September 2012. About eight months after injection ceased, a second sequence of earthquakes began to the NE along the extension of the NE-SW trending linear cluster about 2 km from the injection well. Because this sequence began after injection ceased, Janska and Eisner (2012) suggest the entire DFW airport sequence may be tectonic in origin and unrelated to injection. However, the fact that earthquakes sometimes occur after injection ceases is well known (Healy et al. 1968; Nicholson and Wesson 1990; Petersen et al. 2016b; Suckale 2009) Ellsworth, 2013). Thus, we and others (Frohlich et al., 2011; National Research Council, 2012) conclude that the DFW airport earthquakes were induced because of the absence of historical seismicity prior to injection, the proximity of the injection well to a known mapped fault, the onset of activity only six weeks after injection commenced in 2008, the frequency and magnitude of these events compared to other active, naturally occurring EQ zones, and the earthquake depths at and below the depth of injection.
16
Cleburne – 2009–2012: almost certainly induced. Beginning in June 2009 residents of Cleburne, situated about 60 km south of Fort Worth, reported experiencing felt earthquakes that continued until at least June 2012. The largest reported magnitude was mbLg3.5 for an earthquake on 24 June 2012. Scientists at Southern Methodist University installed a five-station temporary network to record this activity (Justinic et al. 2013) and were able to locate accurately 38 earthquakes occurring along a 2–3 km-long NS trending linear feature, with best-determined focal depths of 3.5–4.2 km. The centroid of these locations was 1.3 km from a saltwater disposal well that began injecting in 2007 at depths of 2.4–3.1 km, and 3.2 km distant from a well that injected at depths of 3.2–3.3 km from September 2005 through July 2009. We know of no mapped faults in the public archive for this location, but faulting throughout the oil and gas production layers in the Fort Worth basin in neighboring counties is not uncommon (Railroad Commission of Texas, 2015). Focal mechanisms determined for two events indicate normal faulting along a NS-trending direction that corresponds to the linear trend of located events.
Figure 2.11: Earthquakes, injection wells, and production wells at the Dallas-Fort Worth International Airport
17
Because of the absence of historical seismicity prior to injection, the proximity of the injection wells, and the depths of some earthquakes depths near the depth of injection, we conclude this sequence is almost certainly induced. Timpson – 2012–2014: almost certainly induced. On 10 May 2012 an earthquake with MW3.9 occurred in east Texas a few km southeast of Timpson (Figure 2.6 and Figure 2.12); on 17 May 2012 there was a larger MW 4.8 event that produced intensities up to MMI VII. Waveform modeling for the 17 May mainshock was consistent with a focal depth of 4.5 km (Frohlich et al. 2014). Focal mechanisms reported for this event indicated strike-slip faulting (Figure 2.12). Note that best-located events form a planar group extending from about 2–5 km depth (see cross section A-A’ in Figure 2.12) coinciding with a mapped fault (dark line near B-B’ on map in Figure 2.12), and situated within 1–3 km of wells ‘south’ and ‘north’ injecting at ~1.8 km depth. Prior to the 2012 mainshock, injection rates at north well were ~16,000 m3/mo; at south well they were ~24,000–48,000 m3/mo. Figures redrawn from Frohlich et al. (2014).
18
Circles:
earthquakes
White circles:
Triangles:
temporary seismic stations
Grey circles:
Squares:
injection disposal darkest wells circles:
epicenters for earthquakes occurring prior to installation of temporary network, including the MW4.8 17 May 2012 event. epicenters determined when network was partially installed; darkest circles are best-located hypocenters occurring after installation of all eight stations.
Figure 2.12: Earthquakes and injection wells in the 2012–13 Timpson sequence By February 2013 eight temporary seismograph stations had been installed (Frohlich et al., 2014). These stations recorded numerous aftershocks with epicenters situated along a NW-SE trending, SW dipping mapped fault that had been reported by Jackson (1982). Focal depths for the bestdetermined aftershocks were between 1.5 and 4.5 km. The aftershock sequence was situated about 2–3 km from two wastewater injection wells that had been injecting 16,000 m3/mo or more since 2006–2007 at depths of about 1.9 km. A search of records at station NATX in Nacogdoches, about 35 km distant, revealed that several small earthquakes apparently from the same focus had 19
occurred in 2008, 2010 and 2011 (Frohlich et al. 2014) and subsequent reanalysis of Transportable Array data revealed additional earthquakes that occurred between 2010 and 2012 (Walter et al. 2016). Fan et al. (2014) simulated the spatial and temporal evolution of the pore pressure and stress fields in this region using a coupled finite-element geomechanical model and concluded that it was plausible that injection induced this earthquake sequence. Even in the absence of the modeling, the sequence occurrence along a mapped fault, the focal depths of the events, and the proximity, timing and volume of the injection, all support the conclusion that this sequence was almost certainly induced. Azle – 2013–2015: almost certainly induced. Beginning in November 2013, a series of earthquakes occurred near the city of Azle, about 25 km northwest of Fort Worth. As of 2015 the sequence includes eight earthquakes having magnitude M ≥ 3; the two largest were MbLg3.6 events occurring on 20 November 2013 and 8 December 2013. Like other Fort Worth Basin event sequences, there was no history of prior seismic activity. Scientists at SMU and the USGS deployed a temporary seismograph network and were able to locate accurately 283 events occurring between December 2013 and April 2014 (Figure 2.6 and Figure 2.13) (Hornbach et al. 2015). Figure 2.13 is revised from Hornbach et al. (2015). The seismicity occurred at depths between 1.5 km and 8 km on two steeply dipping, conjugate faults consistent with the general strike of the Newark East fault zone, a mapped fault system that extends NE-SW across the seismically active region. Focal mechanisms were consistent with normal faulting. There are two wastewater injection wells and multiple production wells within 3 km of the seismic activity. Between June 2009 and 2014 injection was ongoing at the closest disposal well at depths of about 2.5 km and rates of 30,000–80,000 m3/mo. Two gas and brine producing wells of interest were situated directly above the earthquake activity, but specific monthly production volumes of brines were not available. Geomechanical modeling of pore-pressure diffusion (Hornbach et al. 2015) indicated that the combination of brine production and wastewater injection was sufficient to generate subsurface pressure changes that could induce earthquakes on near-critically stressed faults. Because of the absence of historical seismicity prior to injection, the proximity of the injection wells, the relatively high volumes injected compared to other regional wells, the timing of high injection rates with felt seismicity, and the depths of earthquakes at and below the depth of injection, we conclude this sequence is almost certainly induced.
20
earthquake Temporary Triangles: Star: Map location epicenters seismograph station Figure 2.13: Earthquakes near Azle and regional geologic structure
Circles:
Elsewhere in northeast Texas: Frohlich (2012) analyzed data collected between November 2009 and September 2011 by the EarthScope Transportable Array and located 67 earthquakes. All of the more accurately located events were grouped in eight distinct locations, and each of these groups was situated within 3.2 km of one or more injection disposal wells having maximum injection rates of 24,000 m3/mo or more. Two of these groups (Dallas-Fort Worth and Cleburne) are among those discussed above. Because of the proximity to high-volume injection wells and the absence of regional historical seismicity, earthquakes in the remaining six groups are probably induced. The most numerous of the eight groups had 32 earthquakes and was situated in northeastern Johnson County near Venus, about 40 km southeast of Fort Worth and 30 km northeast of Cleburne. This focus has continued to be seismically active up into 2015, including an MbLg4.0 earthquake on 7 May 2015. To further investigate this activity, scientists at Southern Methodist University and The University of Texas at Austin have installed several temporary seismograph stations. A focal mechanism for this 2015 earthquake indicates normal faulting.
2.3.3. West Texas Snyder – 1974–1982: almost certainly induced. Two sequences of earthquake activity have occurred in association with the Cogdell Field about 20 km north of Snyder. The first began in 1974 and lasted until 1982; the largest earthquake, with magnitude mb 4.6, occurring on 16 June
21
1978. The field began producing in 1949, and waterflooding of the producing reservoir began in April 1956. The injection began at the edges of the field and migrated inward over time; the injection rates increased and exceeded more than 300,000 m3/mo by November 1974 when the first known earthquake occurred. A surface-wave analysis of the 1978 earthquake (Voss and Herrmann 1980)found normal faulting and estimated a depth of 3 km. The USGS operated a temporary seismograph network from February 1979 to August 1981 (Harding 1981) and recorded 20 locatable earthquakes having mean depths of 1.9 km. Both results are consistent with the injection depth of 2.1 km. Davis and Pennington (1989) investigated this sequence and attributed it to the waterflooding of the Cogdell oil field. They modeled fluid pressures in the field and concluded that the earthquakes occurred at the boundaries of regions having low fluid pressures adjacent to higher-pressure regions. We conclude this sequence is almost certainly induced because of the absence of historical earthquakes prior to 1974, the huge and sustained injection volumes, the earthquake depths at about the depth of injection, and the supporting modeling evidence. Snyder – 2006–2012: probably induced. Following more than 20 years with no reported earthquakes, a second sequence of activity in the Cogdell oil field (Figure 2.6 and Figure 2.14) began in 2006; between 2006 and 2015 NEIC reported 24 earthquakes having M ≥ 3, including an MW 4.4 earthquake on 11 September 2011. Four focal mechanisms determined for this sequence included two strike-slip and two normal faulting events (Figure 2.14). Earthquakes occurring 1974–1982 in the Cogdell Field have been attributed to waterflooding operations in the Cogdell Field (Davis and Pennington, 1989). However, the 2000–2011 earthquakes mapped here appear to be associated with super-critical CO2 gas injection (Gan and Frohlich, 2013). As the history of waterflooding and gas injection are highly similar in the Cogdell, Kelly-Snyder, and Salt Creek Fields, it is presently unclear why earthquakes occur primarily in and near the Cogdell Field. Gan and Frohlich (2013) evaluated EarthScope Transportable Array records to investigate this sequence. They found no evidence that this second sequence was attributable to waterflooding; instead they found that it coincided with a program to inject super-critical CO2 in the Cogdell Field. For the Cogdell Field, super-critical CO2 injection rates averaged about 113 million m3/mo between 2004 and 2012, and there was a temporary increase to more than 225 million m3/mo in August 2006, just as the first earthquake in the sequence occurred. Although we have no knowledge of mapped regional faults or information about the focal depths of this sequence, we conclude it is probably induced. If so, the MW4.4 earthquake is the largest known earthquake induced by injection of super-critical CO2. Permian Basin 1966–present: probably induced. Between December 1975 and September 1979 a 12-station seismograph network was deployed in west Texas to assess seismic risk associated with a proposed nuclear waste disposal site in southeastern New Mexico (Figure 2.6 and Figure 2.15). The network recorded more than 2000 earthquakes of which about 1300 were located. There were several different investigations analyzing these data (Doser et al. 1992; Keller et al. 1987; Rogers and Malkiel 1979); all found that much of this seismicity occurred within several active oil and gas fields, notably the War-Wink, Kermit-Keystone, and Apollo-Hendrick Fields. The investigations all concluded the seismicity was probably induced, but more than one mechanism
22
was responsible. For example, some events seemed to be associated with enhanced recovery efforts, and others with production. Felt earthquakes had not been reported in or near the locations of these petroleum fields prior to 1966; between 1966 and 1978 there have been several reported earthquakes having M ≥ 3, including one with M3.9 on 25 January 1976. Because the region was settled much earlier, Rogers and Malkiel (1979) suggest that earthquakes were mostly rare or absent prior to about 1966. Although the relationship between seismicity and petroleum operations appears to be complex, and many active fields there have no earthquakes, we conclude that the majority of Permian basin earthquakes are probably induced.
23
Filled circles Squares Beach-balls
Earthquakes located by Gan and Frohlich (2013) using data from nearby USArray temporary stations Super-critical CO2 gas injection wells Reported focal mechanisms for four of the mapped earthquakes
Figure 2.14: Earthquakes 2009–2011 and gas injection wells near Snyder TX
24
Note: Symbols “*” and “+” are epicenters relocated using data collected by temporary seismograph stations (triangles) operational from 1976–1979; “+” symbols are epicenters located with data from fewer than 4 stations. Oil fields are irregular-shaped regions enclosed by thin lines; bold lines are boundaries of the Central Basin Platform. Several investigators have noted that earthquakes are associated with the Keystone (labeled K) and War Wink (W) Fields, and seismicity within Crane County and Ector County is generally co-located with oil field outlines. Figure reproduced from Doser et al. (1992).
Figure 2.15: Seismicity 1976–1979 and oil fields of the Permian Basin
2.3.4. Texas Panhandle In Texas, the largest historical earthquakes other than the 1931 and 1995 west Texas events occur in the Panhandle, where earthquakes having magnitudes exceeding M5 (as determined from felt areas) have occurred on 20 July 1925 (M5.4), 20 June 1936 (M5.0), and 12 March 1948 (M5.2) (Frohlich and Davis 2002). Of these, the 1948 earthquake was centered in the northwest corner of the Panhandle where we know of no contemporaneous petroleum production. However, for both 25
the 1925 and 1936 earthquakes (Figure 2.6 and Figure 2.16), the region of maximum intensities coincided with the giant Panhandle oil and gas field. This, along with the observation that no confirmed earthquakes are known in the region prior to 1910 when petroleum was first discovered here, has led to speculation that Panhandle earthquakes are induced (Frohlich and Davis 2002; Pratt and Johnson 1926). Although the assertion would be credible for the 1936 earthquake (more than 50x106 m3 of oil were produced from the Panhandle Field prior to 1938), it is less plausible in 1925, as vigorous petroleum production was just getting underway then. Moreover, prior to 1910 the population of the Panhandle was scant, and earthquakes occurring then might have gone unnoticed. No information is currently available concerning the focal depths of Panhandle earthquakes, and epicentral locations are not very accurate. Nevertheless, many of the Panhandle earthquakes in Tables A1 and A2 (available in the appendices to this report) have occurred near active production or injection operations. But while it is possible some Panhandle earthquakes are induced, at present there is insufficient evidence to conclude an induced cause is probable. However, in the analysis of Weingarten et al. (2015), some Panhandle events do qualify as earthquakes “associated” with injection. Clearly, more research concerning Panhandle earthquakes is warranted.
2.4. Natural Earthquakes in Texas 2.4.1. Texas Gulf Coast The Gulf Coast and some communities in central Texas to the north (such as Austin) were settled in the first half of the 19th century. For smaller earthquakes (M < 4.5) occurring prior to 1970 or so the only information available often comes from felt reports, as there were few or no regional seismograph stations then. Searches of contemporary newspapers and journals has uncovered a few reports of apparent earthquakes occurring between 1847 and 1952. Very approximate magnitudes have been assigned to these events from an assessment of the felt reports. None of these apparent earthquakes was assigned a magnitude larger than 4.1. These reported apparent earthquakes occurred in Seguin (14 February 1847, M3.6), Manor (1 May 1873, M3.1), Paige (5 January 1887, M4.1), Wellborn (31 January 1887, M3.3; Austin (Creedmoor, 9 October 1902, M3.9), Hempstead (8 May 1910, M3.8), and Orange (17 October 1952, M3.3).
2.4.2. Northeast Texas Analysis of contemporary accounts suggests an earthquake may have occurred near Rusk on 8 January 1891 (M4.0), although there is some question about this (see Frohlich and Davis, 2002). Sellards (1935) performed a field study investigating an earthquake occurring 12 April 1934 (M4.2) along the Texas-Oklahoma at Trout Switch (a spur on the railroad).
26
Between 24 April and 19 August 1964, a series of small earthquakes (largest, M4.4) occurred in Sabine County near Hemphill, and many of these were recorded on a temporarily-deployed seismograph. These events occurred while the nearby Sam Rayborn Reservoir dam was under construction, and before construction began on the nearby Toledo Bend Reservoir dam; thus, they appear to be natural, and not reservoir-induced earthquakes. On 31 May 1997 a small earthquake (M3.4) occurred in Hunt County near Commerce.
Roman numerals: Dark grey: Light grey:
Modified Mercalli Intensities Oil field Gas field
Figure 2.16: Petroleum fields and felt intensities for the 20 June 1936 Panhandle earthquake (Frohlich and Davis 2002)
27
2.4.3. West Texas The state’s largest historical natural earthquakes are in West Texas—one occurring near Valentine (16 August 1931, M6.0), the other near Alpine (14 April 1995, M5.7). The 1931 earthquake had intensities as high as MMI IX in the epicentral area; both earthquakes were felt over most of Texas (Figure 2.17). Both these earthquakes are part of a band of natural seismicity extending from El Paso roughly southeast and paralleling the Rio Grande River; this is the seismically most active region in Texas.
Roman numerals: dashed lines:
Modified Mercalli Intensities county boundaries
Figure 2.17: Felt area map for the 16 August 1931 Valentine earthquake (Frohlich and Davis 2002) 28
There are two contemporary studies of the 1931 Valentine earthquakes (Sellards, 1933), and Doser (1987) analyzed regional records to determine a focal mechanism. Perhaps surprisingly, the 1995 Alpine earthquake is less well-studied, as there has been no journal publication focusing on this event, although several published papers have used seismic waves from this earthquake to investigate regional crustal and mantle structure.
2.4.4. Texas Panhandle The Texas Panhandle is the second most active seismic region in Texas, as numerous earthquakes with M>3 have occurred there in the 20th century, including three with magnitudes of M5.0 or greater. These occurred on 30 July 1925 (Borger, M5.4), 20 June 1936 (Borger, M5.0), and 12 March 1948 (Dalhart, M5.2). Of these the 1948 Dalhart earthquake is surely natural, as it occurred in the northwest corner of the Panhandle where there was little or no petroleum production. However, both the 1925 and 1936 Borger earthquakes occurred within or on the boundary of the Panhandle Field, a huge oil and gas field that was undergoing development prior to 1925. There is little information to evaluate whether these earthquakes are induced or natural, as virtually the only published investigations are Udden (1926), Sellards (1939) and Frohlich and Davis (2002). No confirmed earthquakes are known in the Panhandle region before petroleum development began somewhat before 1920. However, census records indicate that there were virtually no inhabitants in the Panhandle prior to 1900, possibly explaining the absence of reported earthquakes, if earthquakes there are of natural origin.
2.5. Seismicity in Regions Neighboring Texas 2.5.1. Oklahoma The largest historically reported earthquakes in Oklahoma had magnitudes of about M5.6. These occurred on 22 October 1882 near Fort Gibson (M5.6, Frohlich and Davis, 2002), 9 April 1952 near El Reno (M5.7, Frohlich and Davis), and 5 November 2011 near Prague and Sparks (M5.6). All historical Oklahoma earthquakes having magnitudes exceeding M5 have occurred in the central and northern parts of the states; none have occurred near the Oklahoma-Texas border (Figure 2.18). Note that activity is relatively sparse in the southern half of the state. However, the Meers Fault in southern Oklahoma (Figure 2.19) is visible at the surface and has been investigated extensively (Crone and Luza 1990; Ramelli and Slemmons 1990). Paleoseismic studies involving trenching, etc., indicate that the Meers Fault was seismically active 1200–1300 years ago, and activity could have magnitudes of M7.0–7.5 or larger. There is some evidence that recurrence intervals are ~100,000 years; however, this is not well established.
2.5.2. The New Madrid Region Between December 2011 and February 1812 three earthquakes occurred near New Madrid, Missouri, which have been widely reported to have magnitudes as large as M8 (Johnston and 29
Schweig, 1996). A more recent analysis by Hough et al. (2000) concluded that the magnitudes were probably significantly smaller (M7.4–7.5). However, for many locations in northeastern Texas it is likely that the 1811-1812 earthquakes are the source of the highest MMI levels experienced over the past several hundred years (Figure 2.20). At these distanced (~800 km) the peak frequencies of shaking would be relatively low, but are of interest as these might affect some components of bridges. There were no felt reports in Texas due to the low population density in 1811. Isoseismal lines shown in Figure 2.20 were inferred from a summary of felt reports from east of the Mississippi River.
Figure 2.18: Seismicity of Oklahoma for 1973–2016, as reported by the U.S. Geological Survey
30
Figure 2.19: Location of mapped faults in southern Oklahoma, including the Meers Fault (M) (Crone and Luza 1990)
31
Note: Dashed lines are county boundaries.
Figure 2.20: Estimated felt area map for the New Madrid, Missouri earthquake, December 1811
2.5.3. Louisiana, New Mexico, and the Gulf of Mexico Earthquakes are relatively rare in Louisiana. The largest historical earthquakes have had magnitudes of about M4.0. These include the 16 October 1983 earthquake in Lake Charles (M3.9; Stevenson and Agnew, 1988), with an epicenter relatively close to the Texas-Louisiana border. Recent evidence suggests that some small (~M2) Louisiana earthquakes may be induced (Walter et al. 2016). Most of the larger historically recorded felt earthquakes in New Mexico occurred in the central and western part of the state, in the neighborhood of Socorro and Albuquerque. None of these appear to have had a magnitude as large as M6.0. On 2 January 1992 an earthquake with magnitude M5.0 occurred in Rattlesnake Canyon in Lea County New Mexico, near the Texas-New Mexico border. Sanford et al. (1993) investigated this event, determined a focal mechanism, and suggested it might be induced.
32
Seismicity in the Gulf of Mexico is generally rare, although an M5.8 earthquake occurred on 10 September 2006 in the eastern Gulf, more than 400 km from the Texas-Louisiana boundary. Along the Texas coast the Gulf of Mexico is virtually aseismic (Frohlich, 1983).
2.5.4. Mexico Earthquakes with magnitudes of M7.5–8.0 occur with regularity in Mexico. However, these large events are all situated on the Pacific coast, with epicenters more than 600 km from any location in Texas. Although surface waves from some of these earthquakes might occasionally be felt in Texas and causes low-frequency effects (perceptible swaying of tall building, sloshing of swimming pools, seiches) they don’t otherwise pose a hazard.
2.6. Discussion 2.6.1. Induced Earthquakes across Texas through Time Earthquakes induced by human activity occur in several different areas of Texas (Figure 2.5), and for some events the evidence they are induced is exceptionally strong. This is particularly true for three recent sequences of earthquakes associated with wastewater disposal in deep wells. These are the Dallas-Fort Worth International Airport sequence of 2008–2013 (Frohlich et al., 2011); the Timpson sequence surrounding the M4.8 earthquake of 17 May 2012 (Frohlich et al., 2014); and the Azle sequence beginning in 2013 (Hornbach et al. 2015). All three sequences occurred in regions where prior seismic activity was unknown; all three had accurately-determined epicenters situated within about two kilometers of active injection wells with maximum monthly injection rates of 24,000 m3 or greater; all three sequences had accurately-determined hypocenters with focal depths at approximately the depth of injection and at greater depths; and epicenters for all three sequences occurred within a few km of known mapped subsurface faults. Induced earthquakes are not just a recent phenomenon in Texas. The evidence that petroleum operations induced earthquakes in 1925 (Goose Creek) and 1932 (Mexia-Wortham) is credible, in spite of the fact that no seismographs recorded these events. In both cases careful field investigations (Pratt and Johnson, 1926; Sellards, 1933) established the presence of surface cracks, and in Mexia a pattern of felt reports suggested the source was shallow and coincident with the area where high-volume extraction was underway. The geologists who performed these field investigations, Wallace E. Pratt and Elias H. Sellards, were established and well-respected scientists with strong ties to industry—Pratt was employed by Humble Oil and was among the founders of the American Association of Petroleum Geologists, and Sellards was Director of the Texas Bureau of Economic Geology. Both made statements in academic publications suggesting the earthquakes were caused by petroleum extraction: Pratt and Johnson (1926) noted the earthquakes accompanied land subsidence and concluded that this was “directly caused by extraction of oil, water, gas, and sand from beneath the surface.” Sellards (1933) noted that “the tremor may have been caused by adjustment of the land surface incident to the operations in the oil fields” and to support this, presented calculations indicating that cumulative production in the
33
fields was 60–100x106 m3 of oil and water, and 20x106 m3 of gas. Their statements suggesting an induced cause for the Goose Creek and Mexia-Wortham earthquakes are notable, especially as induced earthquakes were virtually unknown at that time.
2.6.2. The Multiple Causes of Induced Earthquakes in Texas Mechanisms other than wastewater injection appear to be responsible for several Texas earthquake sequences. These mechanisms include fluid extraction for the 1932 Mexia-Wortham earthquake and the M4.8 2011 earthquake near Fashing (Pennington et al., 1986; Frohlich and Brunt, 2013); near-surface subsidence associated with fluid extraction (Goose Creek); enhanced oil recovery (Snyder earthquake M4.6 1978: Davis and Pennington, 1989); and super-critical CO2 injection (Snyder earthquake M4.3 2011: Gan and Frohlich, 2013). Indeed, over the past century in Texas, the apparent causes of induced earthquakes have changed as the technologies used to extract petroleum have evolved. Prior to 1940 most fields in Texas produced from relatively shallow strata, were in the primary recovery phase, and often were managed to produce oil as quickly as possible. The resulting removal of large volumes often led to changes in subsurface stress conditions, surface and/or subsurface faulting and cracking, and (sometimes) earthquakes. The 1925 Goose Creek and 1932 Wortham-Mexia earthquakes are prime examples. As subsurface pressures declined in some of the larger fields, operators realized that waterflooding was necessary to maintain production (secondary recovery). This process began as early as 1938 in the East Texas Field, and was in widespread use across Texas when it was initiated in 1956 in the Cogdell Field near Snyder. Pennington et al. (1986) argue that waterflooding was responsible for the 16 June 1978 Snyder earthquake sequence. For the 1957 Gladewater earthquake, waterflooding of the East Texas Field may have contributed to its occurrence; however, an alternate cause is redistribution of subsurface stress, which is a plausible mechanism considering the huge volumes of petroleum produced here from strata at depths of 1–2 km. Like the East Texas Field, many other fields in Texas have long and complex production histories, sometimes making it difficult to assign a single cause to associated earthquakes. Examples of such fields are in the Permian Basin, where numerous fields were discovered in the 1920s and subsequently have produced large volumes of petroleum from different strata, and over the decades have undergone various episodes of secondary and tertiary recovery. New shale-play fields, typically in basinal settings not co-located with the older fields, today are undergoing vigorous hydrofracturing operations. Other fields with long and various production histories and earthquakes include the Stratton Field (and the 1997 and 2010 Alice earthquakes) along the Gulf Coast, and the Fashing Field (and its earthquakes 1974–2011) south of San Antonio; in both cases the earthquakes are almost certainly induced, but the complex history makes it difficult to isolate one causal mechanism. In contrast, the evidence indicates that a single cause—wastewater injection that activates nearby subsurface faults—is primarily responsible for many induced Texas earthquake sequences
34
occurring since 2008. These include the 2008–2013 Dallas-Fort Worth International Airport sequence, the 2009–2010 Cleburne sequence, the 2012 Timpson sequence, and the 2013–2015 Azle sequence. There also appear to be several other persistent loci of seismic activity associated with injection disposal wells elsewhere in northeast Texas (Frohlich 2012). However, if we compare the seismicity in northeast Texas and Oklahoma, the Texas seismicity tends to be clustered around a small number of distinct sites whereas in Oklahoma, the associated seismicity is aerially more extensive and distributed geographically over a much larger area (Walsh and Zoback 2015). There are also considerably fewer Texas earthquakes having M>3. The difference may occur because the injection in northeast Texas is mostly to dispose of fluids produced following hydrofracturing operations, and the seismicity is concentrated around a few wells having higher rates of injection (Frohlich 2012). In contrast, in Oklahoma much of the disposal is from large volumes of water coproduced during conventional oil production, and subsequently reinjected into deeper sedimentary formations that appear to be in hydraulic communication with crystalline basement (Walsh and Zoback 2015). In Oklahoma, the overpressuring and associated seismicity appears to extend over entire formations, rather than just around individual wells. Although the Texas data support the assertion that when earthquakes occur, they often are situated within a few km of high-rate injection wells, or near fields where large volumes of oil and gas have been produced over many years from relatively shallow strata, the converse is not true. That is, the majority of high-rate disposal wells and highly productive petroleum fields are not associated with nearby earthquakes. Nevertheless, it is important to emphasize that while association is not causation, we cannot dismiss the correlations in time and space over a long operational history, reported at multiple sites and noted in numerous peer-reviewed publications. At present it is still poorly understood why seismicity occurs in some environments and not in other apparently similar situations. For Texas, we anticipate that this understanding will improve over time as the Texas seismograph network improves and more seismic data are collected, and as future research efforts target areas like the Panhandle and the Permian basin that have been seismically active and where considerable information is available about regional geology. While Texas provides examples of earthquakes associated with extraction, secondary recovery, and wastewater injection, at present there have been no reported examples where hydrofracturing operations themselves directly caused felt earthquakes or earthquakes with magnitudes M3 or greater, such as have been observed in Alberta, British Columbia, Ohio, Oklahoma and elsewhere (Eaton and Mahani 2015; Farahbod et al. 2015; Holland 2011; Skoumal et al. 2015). However, this is unsurprising considering that earthquakes associated with hydrofracturing are usually smallmagnitude events and seismic station coverage in Texas is relatively sparse. Similarly, we are unaware of any reservoir-induced earthquakes in Texas (i.e., earthquakes associated with the filling of surface-water impoundments). This is unsurprising considering that nearly all such earthquakes occur beneath reservoirs having maximum depths of 50 m or more (Gupta 2002). Only two reservoirs in Texas have depths exceeding 50 m (Lake Travis at 65 m, and Lake Amistad at 60 m), and neither have nearby earthquakes.
35
2.7. Summary Earthquakes induced by human activity occur in several different areas of Texas, and for some events the evidence they are induced is exceptionally strong. Induced earthquakes are not just a recent phenomenon in Texas. The evidence that petroleum operations induced earthquakes in 1925 (Goose Creek) and 1932 (Mexia-Wortham) is credible, in spite of the fact that no seismographs recorded these events. Mechanisms other than wastewater injection appear to be responsible for several Texas earthquake sequences. These mechanisms include fluid extraction for the 1932 Mexia-Wortham earthquake and the M4.8 2011 earthquake near Fashing; near-surface subsidence associated with fluid extraction (Goose Creek); enhanced oil recovery; and super-critical CO2 injection (Snyder earthquake M4.3 2011). Indeed, over the past century in Texas, the apparent causes of induced earthquakes have changed as the technologies used to extract petroleum have evolved.
36
Chapter 3. Texas Geologic Conditions and VS30 Maps 3.1. Overview The influence of local soil and rock conditions including local rock type and geologic context on ground motion and potential earthquake damage has been recognized for many years (Kramer 1996). In general, less rigid soil and rock types (e.g., unconsolidated sand, gravel and clay) undergo more severe ground motion than do more rigid soil and rock types (e.g., granite, limestone and sandstone) for a far field seismic event. Given that measurements of near-surface rock properties are sparse and unequally distributed across Texas, one approach to estimating seismic properties statewide is to leverage knowledge of the distribution and types of rocks and sediments from previously published geologic maps and group the units by some parameters that reasonably correlate with seismically relevant properties. One approach to estimating the geographic variation in seismic response from geologic maps has been to group geologic units by age, under the assumption that younger units are associated with a larger seismic response than are older rocks in most cases. In many large geographic areas, there is a general correlation between the age of a geologic unit and its rigidity, but that correlation may only be a secondary one that reflects the greater proportion of rigid, crystalline rocks in regions dominated by older Paleozoic and Precambrian units, and the corresponding greater proportion of less rigid sedimentary strata (shales, mudstones, and semi-consolidated gravel, sand, and clay) in geologically younger areas. An alternative approach, if the data are available, is to associate dominant rock types with mapped geologic units, estimate physical properties of those major rock types from published analyses of these or similar rock types, and then group the geologic units by dominant rock types with similar physical properties regardless of geologic age. Across Texas, initial project-related investigations suggest that there may be as many as 30 or 40 primary rock types that could be derived from published geologic maps and could form the basis for a map depicting the distribution of those primary types. The primary lithologic units could then be aggregated into a smaller number of rock units having similar seismic response. The goal is to combine the dozens of primary types into perhaps four or five aggregated units that would likely range from the least-rigid group (unconsolidated sands, silts, and clays) to the most rigid group (crystalline rocks). Using this approach, similar rock types of differing ages would be grouped together and considered to have similar seismic properties rather than be assigned properties based on age of the mapped unit alone. To conduct the grouping process by physical properties of soil and rock, a parameter is needed to relate the physical properties and ground motion amplification. VS30, as the time-averaged shear wave velocity of the top 30m, has been proved to be a proper evaluation of ground motion amplification and adopted as the key parameter for seismic design in ASCE 7 and AASHTO Seismic Design Specifications. Therefore, this chapter also provides a brief discussion on the existing shear wave velocity profiles and VS30 proxy methods. Then, the in-situ VS30 measurements
37
made as part of this research project are presented. Finally, the VS30 maps developed for Texas using in-situ measurements and proxy methods are shown.
3.2. Geologic Maps of Texas Maps showing the distribution of geologic units over parts of the state have been created by numerous individuals, groups, and agencies and exist at a variety of scales. Most of the regionally systematic mapping ranges from 7.5-minute quadrangle scale (1:24,000) showing the most detail (but incomplete statewide coverage), to statewide compilations at 1:500,000 (Barnes, 1992). The most detailed maps of the entire state are the 1:250,000-scale maps of the Bureau of Economic Geology’s Geologic Atlas of Texas. This series, consisting of 38 maps (Figure 3.1 and Table 3.1) that each cover one degree of latitude and two degrees of longitude, was published as a compilation of more detailed maps at larger scales where available, along with new mapping at the 1:250,000 scale. These maps, published between 1964 and 1987 in print-only format, are periodically revised and updated as new mapping is completed. Atlas-series maps have been combined to produce the 1:500,000-scale statewide geologic map of Texas (Figure 3.2). Table 3.1: List of the 1:250,000-scale geologic maps of the Bureau of Economic Geology’s Geologic Atlas of Texas series Map sheet Author Map sheet Author Brown and others, 1972 Barnes, 1981 Abilene Llano Eifler and Barnes, 1969 Eifler and others, 1967 Amarillo Lubbock Proctor and others, 1974a Twiss and Barnes, 1979 Austin Marfa Brewton and others, McAllenShelby and others, 1968 Beaumont 1976b Brownsville Aronow and others, 1975 Shelby and others, 1967 Beeville-Bay City Palestine Eifler and others, 1974 Eifler and Barnes, 1976 Big Spring Pecos Eifler and others, 1974 Eifler and others, 1970 Brownfield Perryton Kier and others, 1976 Eifler and others, 1968 Brownwood Plainview Eifler and others, 1978 Eifler and others, 1975 Clovis San Angelo Aronow and Barnes, 1968 Brown and others, 1974 Corpus Christi San Antonio Crystal City-Eagle Brown and others, 1976 Proctor and others, 1974b Seguin Pass McGowen and others, Eifler and others, 1984 Dalhart Sherman 1967 McGowen and others, McKalips and Barnes, Dallas Sonora 1972 1981 Waechter and Barnes, Shelby and others, 1966 Del Rio Texarkana 1977 Emory PeakBrown and others, 1979 Eifler and others, 1983 Tucumcari Presidio Anderson and others, Pieper and others, 1964 Fort Stockton Tyler 1982 Eifler and others, 1976 Dietrich and others, 1967 Hobbs Van Horn-El Paso Aronow and Barnes, 1968 Proctor and others, 1970 Houston Waco Brewton and others, Wichita FallsHentz and Brown, 1987 Laredo 1976a Lawton
38
Figure 3.1: Map showing the distribution of the 38 map sheets that comprise the Geologic Atlas of Texas
39
Figure 3.2: Generalized geologic map of Texas (modified from Barnes, 1992)
40
Figure 3.3: Physiographic map of Texas (modified from Wermund, 1996)
41
The aforementioned 1:250,000-scale Geologic Atlas of Texas maps have now been digitized and converted to an ArcGIS-compatible format. For each of the 38 sheets, geologic units were mapped as individual polygons associated with attribute fields including the geologic formation symbol. The symbols include letters designating the geologic age and an abbreviation for the formation name. The symbols and the detailed formation descriptions were used to create new attribute fields that designate the geologic unit ages and primary and secondary lithologic types. That process, along with some standardization of lithologies, yielded 48 different primary lithologies. A simplified version of the 1:500,000-scale geologic map of Texas (Figure 3.2) shows the regional distribution of geologic units that can serve as the basis for grouping rock units with similar seismic response. When combined with the similarly scaled map of the major physiographic regions of Texas (Figure 3.3), which is largely controlled by the distribution of geologic units and their topographic expression, a framework for grouping geologic units can be developed that takes into account primary rock types, geologic and geomorphic setting, and landscape age. Subsequently, the 48 different primary lithologies were divided into 6 different groups of lithologic types based on the relative stiffness of the formation. Table 3.2 presents the six different groups of lithologic types. The first three groups refer to lithologic descriptions attributed to soil deposits, while the last three groups include primary rock types associated with soft-to-hard rock formations. More specifically, Group A includes alluvium or terrace deposits, Group B contains fine-grained sediments of clay, silt, and loess, and Group C includes coarse-grained sediments of sand and gravel. Group D includes units of soft-rock formations of varying degrees of cementation, such as mudstone, claystone, siltstone, sandstone, conglomerate, marl, and shale. Groups E and F consist of units characterized by hard-rock formations, such as chalk, limestone, and evaporate (Group E), and chert, basalt, granite, and rhyolite (Group F). Table 3.2 lists all of the primary lithologies included for each of the 6 rock-type groups. Figure 3.4a shows the spatial distribution of the mapped units based on the 6 rock-type groups, and Figure 3.4b shows the spatial distribution of the same units based on geologic age. The distribution of the geologic units based on primary lithology and geologic age can be used to estimate seismic properties, such as VS30, statewide.
42
Table 3.2: Primary lithologic descriptions for the six rock types defined in this study Rock Type Group
Primary Lithologic Description
A
alluvium, colluvium
B
clay, fill, mud, silt
C
gravel, rock debris, sand
D
breccia, caliche, claystone, conglomerate, marl, mudstone, sandstone, shale, siltstone
E
chalk, dolomite, gypsum, limestone
F
agglomerate, amphilbolite, andesite, ash, basalt, chert, diorite, extrusives, gneiss, granite, igneous rocks, ignimbrite, intrusive, leptite, melarhyolite, meta-igneous rocks, metaquartzite, meta-sedimentary rocks, porphyry, pyroclastics, rhyolite, schist, serpentinite, syenite, trachyte, tuff
As seen in Figure 3.4, the Gulf Coastal Plain consists predominantly of Tertiary to Quaternary age formations that are dominantly unconsolidated to semi-lithified terrigenous deposits (Groups A, B, and C). Cretaceous-age marls and chalks (Groups D and E) border the upper Gulf Coastal Plain and underlie a substantial fraction of the urban corridor that includes parts of San Antonio, Austin, and Dallas. These strata are likely more rigid than those of the Gulf Coastal Plain, but not as rigid as the dominant limestones and dolomites of the Cretaceous rocks forming the adjacent Edwards Plateau (Group E). Lithified Paleozoic strata underlie the North-Central Plains, and consist of sandstones, siltstones, shales, and carbonates (Groups D and E) with Vs that can be as large as those of the Edwards Plateau limestones or as small as those of the Tertiary-age sediments of the upper Gulf Coastal Plain (Groups B and C). The Precambrian granites and metamorphic rocks that underlie the Central Texas Uplift are among the oldest and stiffest rocks in Texas. The mountains and intervening basins within the Basin and Range province of far west-Texas are underlain by geologic units that range in age from Precambrian to Quaternary and in lithology from soft unconsolidated sediments that fill the basins to stiff igneous and metamorphic rocks that form the ranges. In the High Plains province of northwestern Texas, semi-consolidated to unconsolidated sediments of Tertiary and Quaternary age overlie stiffer sedimentary rocks of Paleozoic and Mesozoic age. The thickness of the younger units and associated burial depth of the generally stiffer Paleozoic and Mesozoic strata are important characteristics that will influence seismic properties such as VS30.
43
(a)
Rock Type: Group A Group B Group C Group D Group E Group F
a) based on primary rock type group (Table 3.2) (b)
Geologic Age: Quaternary - Holocene Quaternary - Pleistocen Quaternary - Undivided Tertiary Mesozoic Paleozoic Precambrian
b) based on geologic age Figure 3.4: Spatial distribution of mapped units
44
3.3. Existing Shear Wave Velocity Profiles As stated in Section 3.1, VS30 is important in quantifying physical properties of geological units and evaluating ground motion amplification. A major objective of this research project is to provide a map of VS30 values across the State of Texas for more accurate estimations of ground shaking hazards. Thus, it is necessary to retrieve VS30 values from existing shear wave velocity profiles to provide reference for representative VS30 values for each geological units. Additional in-situ VS30 measurements are made as part of this project, as described in Section 3.6, to supplement the existing shear wave velocity profiles. As part of the PEER Next Generation Attenuation – East (NGA-East) project (http://peer.berkeley.edu/ngaeast/), a database of 2,754 shear wave velocity (Vs), measured profiles in Central and Eastern United States (CEUS), were retrieved from the literature (Goulet et al. 2014). In this database, a limited number of shear wave velocity measurements within the state of Texas can be found. Table 3.3/Table 3.4 summarize the information regarding these Vs profiles in Texas, in terms of their literature source, location, reported VS30 value, as well as the associated rock unit name and geologic period. Figure 3.5 illustrates the color-coded median VS30 value for each location. As it can be seen from Figure 3.5, almost all available Vs measurements in Texas are located along the Gulf Coastal Plain, with the only exception being a few Vs in situ data from the Comanche Peak Nuclear Power Plant.
45
Figure 3.5: Locations of Vs measurements in Texas
46
Table 3.3 Measured shear wave velocity profiles in Texas Source Dames and Moore (1974)
Holzer et al. (2010)
Longitude Reported Rock Unit Name (deg) VS30 (m/s)
Location
Latitude (deg)
Alien’s Creek
29.63
-96.06
CMN001 CMN002 CMN003 CMN005 CMN006 CMN007 CMN008 CMN011 CMN013 CMN015 CMN022 CMN016 CMN019 CMN021 CMN023 CMN027 CMN032 CMN024 CMN031 CMN025 CMN026 CMN004 CMN009 CMN010 CMN012 CMN014 CMN018 CMN017 CMN020 CMN028 CMN029 CMN030 MGA001 MGA002 MGA003 MGA004 MGA008 MGA005 MGA007 MGA006 MGA010 MGA009
25.95 25.95 25.96 25.97 25.97 25.98 25.99 26.02 26.03 26.03 26.05 26.04 26.04 26.06 26.07 26.12 26.07 26.08 26.09 26.09 26.11 25.96 26.00 26.01 26.02 26.03 26.04 26.05 26.05 26.06 26.11 26.12 28.75 28.76 28.77 28.77 28.79 28.80 28.80 28.80 28.83 28.83
-97.55 -97.56 -97.57 -97.58 -97.59 -97.60 -97.60 -97.61 -97.63 -97.65 -97.62 -97.66 -97.70 -97.62 -97.62 -97.66 -97.58 -97.63 -97.54 -97.64 -97.65 -97.58 -97.60 -97.61 -97.62 -97.64 -97.68 -97.67 -97.72 -97.67 -97.61 -97.57 -95.77 -95.77 -95.79 -95.61 -95.63 -95.60 -95.62 -95.61 -95.64 -95.64
Comanche Peak
32.30
47
-97.79
309.84
1188.32 217.00 214.00 201.00 233.00 233.00 233.00 236.00 236.00 236.00 234.00 259.00 221.00 232.00 227.00 225.00 221.00 236.00 231.00 201.00 228.00 232.00 232.00 240.00 240.00 236.00 275.00 247.00 241.00 234.00 221.00 224.00 228.00 197.00 199.00 211.00 155.00 158.00 174.00 158.00 175.00 168.00 167.00
Beaumont Formation Glen Rose Formation
Alluvium
Period Quaternary Cretaceous
Quaternary
Table 3.4: Measured shear wave velocity profiles in Texas (cont’d) Longitude Reported Rock Unit Name (deg) VS30 (m/s)
Source
Location
Latitude (deg)
Holzer et al. (2010)
BZA014 BZA004 BZA015 BZA016 BZA017 BZA019 BZA005 BZA018 BZA006 BZA007 BZA002 BZA003 BZA001 BZA020 BZA013 BZA011 BZA008 BZA012 BZA009 BZA010
28.87 28.87 28.88 28.88 28.88 28.88 28.89 28.89 28.90 28.91 28.98 28.98 28.98 29.01 29.04 29.06 29.06 29.06 29.07 29.07
-95.59 -95.45 -95.58 -95.57 -95.56 -95.58 -95.48 -95.57 -95.51 -95.55 -95.30 -95.27 -95.29 -95.22 -95.27 -95.23 -95.27 -95.24 -95.26 -95.25
248.00 188.00 229.00 214.00 195.00 226.00 222.00 219.00 179.00 211.00 159.00 181.00 155.00 175.00 200.00 192.00 154.00 195.00 210.00 199.00
B-1000 B-1012 B-2000 STP 4 STP 3 STP 1 STP 2
32.30 32.30 32.30 28.80 28.80 28.80 28.80
-97.79 -97.79 -97.79 -96.04 -96.04 -96.04 -96.04
1035.47 1061.33 1199.23 271.30 279.76 284.83 288.50
-94.90 -94.90 -94.90 -94.90 -94.90 -94.90 -95.30 -95.30 -95.30 -95.30
190.31 203.95 206.84 207.62 209.15 216.09 204.53 210.39 213.11 226.42
Luminant Generation Company LLC (2009)
STP Nuclear Operating Company (2011) Exelon Nuclear Texas Holdings LLC (2008)
unknown location
Victoria County Power Block
1 Amoco Oil Refinery, Site No.2 2 Amoco Oil Refinery, Site No.2 Hoar and 1 Amoco Oil Refinery, Site No.1 Stokoe (1982) 2 Amoco Oil Refinery, Site No.1 3 Amoco Oil Refinery, Site No.1 3 Amoco Oil Refinery, Site No.2 S. R. Bertron Electric Generating Station 1 Stokoe and Mok S. R. Bertron Electric Generating Station 2 (1987) S. R. Bertron Electric Generating Station 3 S. R. Bertron Electric Generating Station 4 Site of Union Texas Petroleum Gas Plant near Sour Lake, Texas 1 Stokoe et al. Site of Union Texas Petroleum Gas Plant near (1983) Sour Lake, Texas 2 Site of Union Texas Petroleum Gas Plant near Sour Lake, Texas 3 American Petrofina Plant 1 Stokoe (1983) American Petrofina Plant 2 American Petrofina Plant 3
32.30
28.58 29.40 29.40 29.40 29.40 29.40 29.40 29.70 29.70 29.70 29.70 30.10 30.10 30.10 29.80 29.80 29.80
48
-97.79
-97.00
-94.40 -94.40 -94.40 -93.90 -93.90 -93.90
663.79
Period
Alluvium
Quaternary
Glen Rose Formation
Cretaceous
Beaumont Formation (sand)
Quaternary
Lissie Formation undivided
Quaternary
Beaumont Formation
Quaternary
Beaumont Formation
Quaternary
206.06
Beaumont Formation (sand)
Quaternary
225.00 228.91 232.01
Alluvium
Quaternary
238.74
198.86 207.25
3.4. VS30 Proxy Method Due to the lack of existing shear wave velocity profiles, there is a strong demand to measure VS30 values along Texas. However, since measurements can only be conducted at limited locations, a reliable VS30 proxy method is also needed to map the VS30 values for the whole State of Texas by exploiting these measurements. Generally, VS30 proxy can be done by geologic units or P-wave seismogram. Here, an overview of these existing VS30 proxy methods is presented.
3.4.1. VS30 Proxy by Geologic Units 3.4.1.1. West Coast America Wills and Silva (1998) were the first to publish a geology-based VS30 proxy relationship for estimating VS30. Their relationship was developed only for the state of California. It was based on a statistical study of 556 sites with measured VS30 values and known surface geology. They predominantly grouped sites into the following five main geologic categories, each with a number of sub-categories (refer to Table 3.5), except the Great Valley Sequence: a) Quaternary Units with nine sub-categories b) Tertiary Sedimentary Rocks with twelve sub-categories c) Great Valley Sequence d) Franciscan Complex with seven sub-categories e) Crystalline Rocks with four sub-categories When choosing the sites with measured VS30, Wills and Silva (1998) used sites where geologic units are similar in the upper 30m and excluded sites where the soil profile has an abrupt geologic transition in the upper 30m. This kind of sites usually exist near the boundaries between two zones with distinct surface geologic conditions and mean VS30 value, so the estimated VS30 values in Table 3.5 may not be applicable for the boundary areas. In fact, since soil profiles in the upper 30m near the boundaries may not be able to be attributed to any single geologic unit, the problem to estimate VS30 values for these boundary areas may not be solved by the VS30 proxy method itself. While average VS30 values and standard deviations were calculated for most of the geologic subcategories, the variability of VS30 values within each sub-category could be considerable. For example, Figure 3.6 shows the distribution of 189 measured VS30 values for Quaternary alluvium as a sub-category in Quaternary Units (refer to Table 3.5). The VS30 values in this sub-category have a mean value of 284 m/s with a standard deviation of 85 m/s. However, the VS30 values often ranged from about 100 to 500m/s, with a few outliers up to 650 m/s. According to NEHRP site classification (Table 3.6), this wide range of VS30 values includes soil profiles from Site Class C to E. Thus, further sub-categorization within units of similar geologic age is clearly important. Furthermore, the mean VS30 values for some sub-categories may fall near the boundary VS30 values between two adjacent site classes. For instance, the Quaternary (older) alluvium has a mean VS30 49
value of 368m/s with a standard deviation of 80m/s, as shown in Table 3.5. The mean VS30 value is near the boundary VS30 value (i.e., 360m/s) between Site Class C and D. Therefore, it would be difficult to determine which site class the Quaternary (older) alluvium belongs to. A good solution is to resort to other VS30 proxy methods when encountering such a situation. Table 3.5: Geology-based VS30 proxy relationships for California from Wills and Silva (1998)
50
Figure 3.6: Histogram showing the distribution of all measured VS30 values for Quaternary alluvium from Wills and Silva (1998) Table 3.6: NEHRP seismic site classes based on VS30, from BSSC (2001)
Wills et al. (2000) developed a site-condition map for the State of California based on geology and NEHRP site classification, as shown in the left of Figure 3.7. In their approach, geologic units were first grouped with similar age and properties (e.g., grain size, hardness). Then, a VS30 class based on NEHRP site classification was assigned to each group. For geologic units which had a typical VS30 value near the boundary value of two VS30 classes, intermediate classes (i.e., class BC, CD, DE) were assigned and the mean VS30 values of the two adjacent classes were set as the start and end values for corresponding intermediate classes. Groups with the same VS30 class or intermediate class were regarded as one site condition, so there are in total 7 site conditions, namely B, BC, C, CD, D, DE, E. To validate the accuracy of the NEHRP site classification map, the 556 sites with measured VS30 values in Wills and Silva (1998) were plotted onto the map to check if the measured VS30 values fall in the site classification assigned to the site location. The result was 74% of the sites with measured VS30 values fell in the expected site classifications. Many of the
51
misclassified sites have a soil profile where harder material at shallow depth were found below a thin, young alluvium at the surface (Wills and Clahan 2006). This phenomenon justifies the statement that sites where the soil profile has an abrupt geologic transition in the upper 30m may not be classified properly only by geology-based VS30 proxy relationships. Wills and Clahan (2006) refined the geology-based VS30 proxy relationship developed by Wills et al. (2000) by using 19 geologic categories instead of the 7 site conditions, as shown in the right of Figure 3.7 and Table 3.7. Three features are used to describe each category. The first feature is the general geologic unit (e.g., Qal, Quaternary alluvium) and the second feature is a qualitative description of the unit (i.e., thickness and particle size). The last feature is the location of each category within California, which indicates that local conditions are important in some cases and caution should be exercised when extrapolating region-specific studies to other areas. By following this VS30 proxy relationship the originally misclassified sites in the site-condition map developed by Wills et al. (2000) fell in the right category, but the cost is that each category is specifically for a certain area and the geology-based VS30 proxy relationship loses generality. While it is possible that geology-based VS30 proxy relationships developed for California may provide some insights into VS30 estimates in Texas, most geology units shown in Table 3.7 refer to very specific areas in California, for which similar conditions may not exists in Texas, or may only exist in a small area. For instance, Qal (Quaternary alluvium) within California is divided into seven sub-categories in Table 3.7, but Qal is very limited in Texas (refer to Figure 3.2) and only exists along river drainages in the Gulf Coastal Plains. Furthermore, Mesozoic and Paleozoic formations account for large parts of Central Texas, and these units are not referred to in Table 3.5 and Table 3.7. 3.4.1.2. Central and Eastern Region of North America Kottke et al. (2012) developed geology-based VS30 proxy relationships for central and eastern North America, as the geologic conditions are quite different from that of western North America. They developed their VS30 proxy by dividing the geologic conditions in central and eastern North America into 3 main types: glaciated, non-glaciated and residual soils, as shown in Table 3.8. Each main type was split based on geologic age, resulting in 5 major units, and further sub-divided based on depositional environment, resulting in 19 categories in total. The VS30 values reported for nonglaciated units are mean values based on Vs measurements. For glaciated units, the VS30 values are computed from a simple calculation based on a two-layer model. The first layer is a sediment layer of specified thickness (refer to Table 3.8) and shear wave velocity typical of an analogous soil type in non-glaciated units. The second layer is a rock layer with a shear wave velocity of 3000m/s. Due to a lack of data, VS30 values for residual soils, Old Glacial Sediments and some of the NonGlacial Sediments were not proposed. Since glacial deposits do not exist in Texas, the only available data in Table 3.8 that might be applicable to Texas are the VS30 values for Young and Old Non-Glacial Sediments.
52
Table 3.7: Geology-based VS30 proxy relationships for California from Wills and Clahan (2006)
53
Figure 3.7: California maps showing 7 site conditions in the left and 19 geologic categories. In the right from Wills and Clahan (2006)
Table 3.8: Geology-based VS30 proxy relationships for central and eastern North America from Kottke et al. (2012)
54
Parker et al. (2016) developed a new geology-based VS30 proxy relationships for central and eastern North America based on statistical analysis of 2754 sites with measured VS30 values. The sites were first grouped by attributes including geologic age, lithology, glaciation history and location relative to know basins. An F-test (Cook and Weiberg, 1999; Akritas, 2015) was performed to test if there are distinct trends in the log mean of VS30, standard deviation of the log mean and trend with 30 arc-sec slope gradient. The sites were regrouped until all groups passed the F-tests. Finally, the sites were classified into 16 groups, as shown in Table 3.9. The relationship between the VS30 values and 30 arc-second slope gradients are also investigated by semi-log and log-log regression:
ln(Vs 30= ) c0 + c1s
(3-1)
ln(Vs 30= ) c2 + c3 ln( s )
(3-2) where 𝑉𝑉𝑆𝑆30 is the mean shear wave velocity in the upper 30m in units of m/s, 𝑠𝑠 is the 30 arc-second slope gradients in units of m/m, and 𝑐𝑐0 , 𝑐𝑐1, 𝑐𝑐2 , 𝑐𝑐3 are regression parameters.
If either 𝑐𝑐1 or 𝑐𝑐3 exceed their 95% confidence intervals, there are statistically significant relationship between gradient and VS30 and the value of these parameters would be reported in Table 3.9. Table 3.9 provides useful reference values for Cenozoic units, but still only limited values for Mesozoic and Paleozoic units, which are common in Texas. It also shows geomorphology such as basins may have a significant effect on local VS30 values. Table 3.9: Geology-based VS30 proxy relationships for central and eastern North America from Parker et al. (2016)
3.4.1.3. Other Areas of the World Cox et al. (2011) conducted a seismic site classification microzonation for Port-au-Prince, Haiti based on 35 shear wave velocity profiles and a regional geologic map, as shown in Figure 3.8. The representative VS30 value for each geologic unit is taken as the median VS30 value for all VS30 values derived from shear velocity profiles for corresponding geologic units, as shown in Table 3.10.
55
Cox et al. (2011) also noted that further efforts are required for accurate site classification. For instance, potential presence of soft clay or liquefiable soil may alter the classification of some areas with Holocene alluvial deposits and coastal artificial fills from Site Class C or D to Site Class E or F. Since such details vary from region to region, it would be important to perform specific investigations of the targeted area. Stewart et al. (2014) compiled shear wave velocity profiles for Greece and tested a geology-based VS30 proxy method (Wills and Clahan 2006), a gradient-based VS30 proxy method (Wald and Allen 2007) and a terrain-based VS30 proxy method (Yong et al. 2012). Results show all methods are biased towards the collected data. Then Stewart et al. (2014) developed a geology-topography hybrid VS30 proxy method for Greece similar to what has already been discussed above in regards to Parker et al. (2016). Sites were grouped by geological units and Eq. (3.2) were used to correlate gradient with VS30 in each geological unit. Therefore, there was one pair of parameters (𝑐𝑐2 , 𝑐𝑐3 ) for each geological unit except the Mesozoic unit, where no strong relationship between gradient and VS30 was found and simply a mean VS30 value was assigned. The whole process of testing existing VS30 proxy methods and development of new VS30 proxy methods suggest the VS30 proxy methods developed in one area may not be not be proper for other areas and new VS30 proxy methods for the area of interest should be considered.
56
Figure 3.8: Geologic map for Port-au-Prince, Haiti from Cox et al. (Cox et al. 2011)
57
Table 3.10: Median VS30 values for surficial geologic units (Cox et al. 2011)
To get an idea of the similarity of VS30 values for the same geological units in different areas, Typical VS30 values of Holocene units are summarized and presented in Figure 3.9. Note the data collected from glaciated areas in Central and Eastern North America are excluded since it is expected to yield distinct VS30 values for geologic conditions that do not exist in Texas. While all mean values of VS30 fall in Site Class D, the four sets of data clearly show distinct trends. VS30 values for Holocene soils in Central and Eastern North America are generally lower than VS30 values in other areas and may even fall in Site Class E, which has high amplification factors. Another interesting phenomenon is that Greece, which has neither the most collected data nor largest area, shows the highest variance of VS30 values and has more than 40% percent possibility to fall in Site Class C. This comparison shows that while geology-based VS30 proxy may provide some good reference to start with, specific investigation into correlations between VS30 values and local geological conditions are usually needed.
3.4.2. VS30 Proxy by Topographic Slope The idea behind using topographic slope as a proxy for estimating VS30 is almost intuitive: stiff (i.e., high shear wave velocity) materials are more likely to support a steep slope after millions of years of geotectonic movement and weathering. While void ratio and mean effective stress are the main factors controlling shear modulus of soil (Fumal and Tinsley 1985), mean effective stress does not vary greatly from site-to-site over the top 100 ft/30 m of subsurface. However, void ratio, particle size/shape, and cementation can vary significantly from site-to-site and these factors have a strong influence on both topographic slope and shear stiffness in soils. For rock, shear modulus is mainly determined by hardness and fracture spacing, which are also indicated by topography. Wald and Allen (2007) first correlated VS30 with topographic slope on the basis of large datasets of measured VS30 values from the U.S., Taiwan and Italy. The data are divided into two categories according to local tectonic structure: active tectonic regions and stable continental regions. Wald and Allen (2007) suggest areas with a mean slope less than 0.05m/m be classified as a stable continental region, otherwise the area should be classified as an active tectonic region. Correlations
58
between VS30 and topographic slope are developed for each category, as shown in Figure 3.10 and Table 4.9. Thus, VS30 estimates can be derived if local topographic data is available. One obvious advantage of the slope-based VS30 proxy method is the ease with which it can be applied over large regions. The only data required is a regional topographic map, which is easy to obtain with the aid of satellite imaging. The other advantage over geology-based VS30 proxy methods is that unlike geologic units, topographic slope is a quantitative factor that enables smooth transitions of VS30 over large areas. Wald and Allen (2007) developed a VS30 map for the Central and Eastern U.S., including Texas, as shown in Figure 3.11. While the general qualitative trend of the map is consistent with basic conditions in Texas, note that data used to develop the map involves no data from Texas so general and local bias may exist. For example, when the slopebased VS30 proxy relationships were applied to Salt Lake City, Utah, the VS30 estimates were found to be significantly higher, on average, than those from measured Vs profiles, as the green crosses were generally lower than the color-coded polygons shown in Figure 3.10(a). Wald and Allen (2007) also found VS30 and topographic slope are hard to correlate for specific geological terrains and processes. The explanation behind the inconsistency is that other mechanism may also have a significant influence on VS30, such as aging, weathering, and cementation. Besides that, different resolution in topographic data may affect the correlation, especially for large-scale mapping. Nevertheless, topographic slope is a valuable parameter worth investigating for estimating VS30 and the correlation may be adapted to conditions in Texas by utilizing measured VS30 values. Colorcoded polygons represent VS30 and slope ranges are consistent with ranges given in Table 3.11 from Wald and Allen (2007). 500 450
Class C
400
VS30 (m/s)
350 300
Class D
250 200 150
Class E
100 50 0 California (Wills and Clahan, 2006)
Central and Eastern North America (Parker et al., 2016)
Port-au-Prince, Haiti (Cox et al., 2011)
Greece (Stwart et al,2014)
Note: boxes show VS30 from Mean of ln (VS30) ± Standard Deviation of ln (VS30)
Figure 3.9: Typical VS30 values for Holocene units in different areas
59
(a) Active tectonic region
(b) Stable continental region (Wald and Allen 2007)
Figure 3.10: Correlations of measured VS30 (m/sec) versus topographic slope (m/m)
Table 3.11: Summary of slope ranges for VS30 categories from Wald and Allen (2007)
60
Note: This figure is derived from topographic slope and slope-VS30correlations for stable continental regions from Wald and Allen (2007).
Figure 3.11: Estimated VS30 map for the continental United States east of the Rocky Mountains Yong et al. (2008) developed another topography-based VS30 proxy method by applying an integrated digital imaging analysis approach. The method was divided into 5 steps: 1) Identify slopes from the relative Digitalized Elevation Model (rDEM) and assign terrain units as classes including mountains, piedmonts and basins according to slopes. 2) Discriminate the lithology using spectral features in Advanced Spaceborne Thermal Emission and Reflection Radiometer (ASTER). For details refer to Kahle and Rowan (1980), Abrams and Hook (1995) and Yong (2007). 3) Compare the spatial distribution of lithology determined in step 2 with terrain units determined in step 1 to verify the correlation between physical properties and terrain units. 4) Assign the range of shear-wave velocities for all terrain units based on Wills and Silva (1998). 5) Verify the identified lithology with independent geological investigations. Yong et al. (2011) applied similar technique for seismic microzonation of Port-au-Prince, Haiti except measured shear-wave velocity profiles from Cox et al. (2011) were used for calibration. The resulted seismic microzonation agreed well with that from Cox et al. (2011). Essentially this method correlates topography with geology and used geology-based VS30 proxy methods for seismic microzonation. It uses more satellite data than Wald and Allen (2007) to establish a robust correlation between topography with geology. However, on the crucial step of assigning VS30 values it inherits the advantage and disadvantages in geology-based VS30 proxy
61
methods. Thus, an accurate correlation between local geology and VS30 values is the prerequisite for this method.
3.4.3. VS30 Proxy by Terrain Yong et al. (2012) introduced a terrain-based VS30 proxy method for the State of California. The approach consists of two steps. The first step is to classify the targeted area into different terrain types. An automated topography classification scheme introduced by Iwahashi and Pike (2007) was adopted to perform the classification based on Shuttle Radar Topography Mission Digital Elevation Models (30 arcsec SRTM DEMs). In the scheme three parameters representing the geometric signature were specified: slope gradient, local convexity and surface texture. Slope gradient was the most important parameter of all the three and could be easily inferred from DEMs. Local convexity was defined as the percentage of convex-upward cells with an arbitrary 10-cell radius and was a necessary parameter to classify areas with low-relief features. Local convexity can be derived from DEMs by applying an image-processing operation called a Laplacian filter. Surface texture is used to quantify topographic spacing in DEMs. It was defined as the number pits and peaks within a radius of ten cells. The pits and peaks were identified from differences between the original DEM and a second DEM derived by a spatial convolution filtering technique called median filtering. After the three parameters were extracted from the SRTM DEM, a straightforward process was applied to divide the targeted area into 16 terrain types based on the mean value of all three parameters. To better illustrate the terrain type determination process, after each partition the group which has a value higher than the mean value is labelled as Hi, whereas the group which has a value lower than the mean value is labelled as Li. Here, i represents the corresponding parameter used for partitioning, where i = g, c, t refers to the slope gradient, local convexity, and surface texture, respectively. For example, group HgLc means data in this group has a gradient higher than the mean gradient in the first partition and a convexity lower than mean convexity in the second partition. The process can be described by these steps: 1)
Calculate the mean gradient Mg0, mean convexity Mc0 and mean texture Mt0 of the whole dataset.
2)
Do the first partition on the whole dataset based on gradient using Mg0. Results are either Hg or Lg.
3)
Do the second partition on the Hg group based on convexity using Mc0. Results are either HgHc or HgLc.
4)
Do the third partition on the HgHc and HgLc groups based on texture using Mt0. Results are either HgHcHt, HgHcLt, HgLcHt, or HgLcLt. These are the first four final terrain types.
5)
Calculate the mean gradient Mg1, mean convexity Mc1 and mean texture Mt1 of the group Lg.
6)
Repeat step 1 for the Lg group. Meaning re-partition the Lg group based on gradient using Mg1. Results are either LgHg or LgLg.
62
7)
Repeat step 2 for only the LgHg group. Meaning, re-partition the LgHg group based on convexity using Mc1. Results are either LgHgHc or LgHgLc.
8)
Repeat step 3 for both the LgHgHc and LgHgLc groups. Meaning, re-partition these groups based on texture using Mt1. Results are either LgHgHcHt, LgHgHcLt, LgHgLcHt, LgHgLcLt. These are the fifth through eighth final terrain types.
9)
Calculate the mean gradient Mg2, mean convexity Mc2 and mean texture Mt2 of the group LgLg.
10) Repeat step 1 for the LgLg group. Meaning re-partition the LgLg group based on gradient using Mg2. Results are either LgLgHg or LgLgLg. 11) Repeat step 2 for both groups. Meaning re-partition the LgLgHg and LgLglg groups based on convexity using Mc2. Results are either LgLgHgHc, LgLgHgLc, LgLgLgHc, LgLgLgLc. 12) Repeat step 3 for all resulted groups in step 9. Meaning re-partition the LgLgHgHc, LgLgHgLc, LgLgLgHc and LgLgLgLc groups based on texture using Mt2. Results are the last eight final groups. Readers can also refer to Figure 3.12 and Figure 3.13 for the whole process. Note Figure 3.12 and Figure 3.13 provides the partition methods to group areas into 8, 12 and 16 terrain types. The principles are essentially the same and the method to group areas into 16 terrain types are used here. In Figure 3.12, criteria are mean values of slope gradient, local convexity, and surface texture, which change to accommodate increasingly low-relief topography depending on number of classes requested (8, 12, or 16). Grid cells steeper than the mean gradient of the study area are distributed among classes 1–4 by first threshold calculation in all three options; for an eight-class output, the remaining cells fall into classes 5–8; for 12 classes, the latter cells are instead allotted among classes 5–12 by reduced parameter means (second threshold); for 16 classes, cells not placed in classes 1–8 are similarly parsed at the third threshold into classes 9–16. By applying this process Yong et al. (2012) divided California into 16 terrain types, as shown in Figure 3.14. Yong et al. (2012) used 853 measured and inferred VS30 values (locations shown in Figure 3.14) to assign average values in each terrain type, except terrain type 13 due to a lack of data, as shown in Figure 3.15. Yong et al. (2012) also compared this method with the geologybased method of Wills et al. (2000) and the topography-based method of Wald and Allen (2007) based on the 853 measured and inferred VS30 values. Results showed that the terrain-based method had the lowest typical standard deviation. Yong et al. (2012) stated this method took into account both the geology and topography information so it was more robust than a proxy method based solely on either geology or topography. The key step in most VS30 proxy methods is to classify areas into meaningful groups that could be representative of common shear wave velocity. While personal knowledge and experience are heavily involved in this step for geology- and topography-based methods, this terrain-based method is relatively automatic and objective. Classifications are done only according to relative values of local areas (i.e., mean values of slope gradient, local convexity and surface texture). This feature enables application of this method to any part of the world without any modification.
63
However, typical VS30 values assigned to each terrain type in one area of the world may provide little information for the same terrain type in other areas because they may have distinct shear stiffness properties relative to the absolute mean values of slope gradient, local convexity and surface texture. Thus, this method heavily depends on the abundance of existing local measured and reliably inferred VS30 values. For now, only a limited number of Vs profiles are available in Texas and most of them are located along the Gulf Coastal Plain. More data need to be collected to apply this method for Texas.
Figure 3.12: Flow chart (Iwahashi and Pike 2007) for automated nested-means classification of topography
64
Note: sequence of operations proceeds from top down. Shaded rectangles represent grid cells below the mean of variable in that row; open rectangles are cells above the mean; rectangles within two dot– dashed boxes are same as those immediately above. Rectangle size is symbolic only and does not represent number of grid cells.
Figure 3.13: Nested-means half/half partitioning shown diagrammatically (Iwahashi and Pike 2007) for gray-scaled images of three input variables and 8, 12, and 16 output classes
65
Figure 3.14: Terrain map of California (Iwahashi and Pike 2007) with locations (black circles) of 853 VS30 values (Yong et al. 2012)
Note: No estimate is provided for Terrain-type 13 (Yong et al. 2012) Figure 3.15: Plot describing mean VS30 values found in terrain types in California
3.4.4. VS30 Proxy by P-wave Seismogram Kim et al. (2016) proposed a new method to infer VS30 by P-wave seismogram. The theoretical background is an analytic expression of the radial displacement to vertical displacement ratio on 66
the free-surface of a half-space from a single, incident plane P-wave, as shown in Figure 3.16. The ratio can be derived from the solution by Aki and Richards (2002) as:
U R −2VS p cos j = (3-3) 1 − 2VS 2 p 2 U Z where 𝑈𝑈̇𝑅𝑅 is the radial displacement at the ground surface, 𝑈𝑈̇𝑍𝑍 is the vertical displacement at the ground surface, 𝑉𝑉𝑆𝑆 is the shear wave velocity of the half-space medium, 𝑗𝑗 is the angle of the shear wave reflected back down from the ground surface, and 𝑝𝑝 is the ray parameter. The ray parameter can be expressed as: p=
sin j VS
(3-4)
By substituting Eq. (3-4) into Eq. (3-3), Eq. (3-5) becomes:
U R = − tan 2 j U Z
(3-5)
Figure 3.16: Schematic sketch showing the incident P-wave and reflected P- and SV-waves (Kim et al. (2016)) 𝑈𝑈̇𝑅𝑅 and 𝑈𝑈̇𝑍𝑍 can be retrieved from recorded ground velocity time histories or integration of ground acceleration time histories. The direction 𝑈𝑈̇𝑅𝑅 is from hypocenter to station and can be derived by rotating two recorded horizontal components numerically. Kim et al (2016) suggested using the first portion of the time series to get rid of the interference from other waves. Figure 3.16 is an example from Kim et al (2016) used to illustrate how 𝑈𝑈̇𝑅𝑅 and 𝑈𝑈̇𝑍𝑍 are retrieved from velocity time histories. The two records are from the 2011-03-16 M 4.3 Hawkesbury earthquake at station 67
CN.OTT and the 2005-05-01 M 4.2 Shady Grove earthquake at station NM. TUMT. The lower two plots in Figure 3.17 are the zoomed-in views at the very beginning of the velocity histories. Basically, Kim et al (2016) used the first peak value of 𝑈𝑈̇𝑍𝑍 and corresponding value of 𝑈𝑈̇𝑅𝑅 at the same moment to get j by Eq. (3-5). Kim et al (2016) estimated ray parameter p by assuming a simplified two-layer crustal velocity model, as shown in Figure 3.18. The ray parameter can be calculated from solving Eq. (3-6): R R sin(arctan( 1 )) sin(arctan( 2 )) D1 D2 = p = V p1 V p2
(3-6)
R1 + R2 = R
where 𝑅𝑅1 𝑎𝑎𝑎𝑎𝑎𝑎 𝑅𝑅2 are the horizontal travelled distances of P-wave in the upper and lower layers, respectively, between the station location and the epicenter, 𝐷𝐷1 is the thickness of the upper layer, 𝐷𝐷2 is the vertical distance from the hypocenter to the boundary of the upper and lower layer, 𝑉𝑉𝑃𝑃1 𝑎𝑎𝑎𝑎𝑎𝑎 𝑉𝑉𝑃𝑃2 are the P-wave velocity of the upper and lower layer, respectively, and 𝑅𝑅 is the horizontal distance from the epicenter to station. 𝑉𝑉𝑃𝑃1 , 𝑉𝑉𝑃𝑃2 , 𝐷𝐷1 , 𝐷𝐷1 are retrieved from an assumed crustal model. Kim et al (2016) used crustal models from EPRI (1993) for Central and Eastern North America (CENA). R can be easily calculated once the earthquake hypocenter is known. Then, p can be solved from Eq. (3-4).
Figure 3.17: Surface ground motion (velocity) time series
68
Figure 3.18: Schematic sketch of ray path for the crustal structure simplified to two layers (Kim et al. 2016) For distant earthquakes, usually R>>D, then p ≈ 1/ V p 2
(3-7)
In most cases 𝑉𝑉𝑃𝑃1 < 𝑉𝑉𝑃𝑃2 because generally P-wave velocity increases with increasing depth. Therefore, the estimation can be justified by considering two extreme cases:
Case 1: 𝑉𝑉𝑃𝑃1 → 0, Based on the principle that waves travel in the fastest path from source to receiver, P-waves travel to the boundary between layer 1 and layer 2 right below the station, then
it travels almost vertically to the station (Path 1), as shown in Figure 3.18, sin 𝑖𝑖 =
1
𝐷𝐷 �1+( 2 )2
.
𝑅𝑅
Case 2: 𝑉𝑉𝑃𝑃1 → 𝑉𝑉𝑃𝑃2 , the two-layer crustal model reduces to a one-layer crustal model and waves travel in a straight path from source to receiver. So P-wave travels in Path 2, as shown in Figure 3.18, sin 𝑖𝑖 =
1
𝐷𝐷 𝑅𝑅
�1+( )2
.
Since R>>D>D2, in both cases sin 𝑖𝑖 ≈ 1, so 𝑝𝑝 = for any intermediate value of 𝑉𝑉𝑃𝑃1.
sin 𝑖𝑖 𝑉𝑉𝑃𝑃2
≈ 1/𝑉𝑉𝑃𝑃2. This relationship should be valid
Once 𝑈𝑈̇𝑅𝑅 , 𝑈𝑈̇𝑍𝑍 and p are known, j can be computed from Eq. (3-5), thus 𝑉𝑉𝑆𝑆 can be computed from Eq. (3-2). The estimated Vs from this method is equivalent to the time-averaged shear-wave velocity from the ground surface to a depth z (VsZ). Kim et al. (2016) assumed the depth z to be the product of the pulse duration of the source time function and the shear wave velocity (τp × VsZ). Kim et al. (2016) also recommended using velocity time histories from small earthquakes with a magnitude MW of 3-4 and a pulse duration of 0.1 seconds for these small earthquakes. There is still a need to convert VsZ to VS30. According to the study of Boore et al. (2011) and Boore (2004), there is a strong correlation between VS30 and VsZ. Kim et al. (2016) developed the correlation between VsZ to VS30 as: 69
log Vs 30= c0 + c1 log Vsz
(3-8)
To determine the constants 𝑐𝑐0 and 𝑐𝑐1, Kim et al. (2016) used a database of 821 Vs profiles measured in CENA from published reports and Nuclear Power Plant (NPP) license applications. For z30m, pairs of 𝑐𝑐0 and 𝑐𝑐1 for z=50~200m and intervals of 25m are developed. However, at each depth the same values of 𝑐𝑐0 and 𝑐𝑐1 are developed for glaciated and non-glaciated region due to lack of data. In short, the method can be divided into the following steps: a) Determine 𝑈𝑈̇𝑅𝑅 , and 𝑈𝑈̇𝑍𝑍 from velocity time histories and calculate j by Eq. (3-5).
b) Apply appropriate crustal models and calculate the ray parameter p by Eq. (3-6) or Eq. (3.7).
c) Calculate VsZ by Eq. (3-2) and determine z as VsZ/10. d) Use z to find corresponding pair of 𝑐𝑐0 and 𝑐𝑐1. Then use Eq. (3.8) to convert VsZ to VS30.
Kim et al. (2016) compared the estimated VsZ with measured VsZ for 31 selected stations, as shown in Figure 3.19. The number next to the station name in Figure 3.19 represents the number of earthquake events used to estimate the shear-wave velocities. Boxplot shows the minimum and maximum (outside bars), 25th and 75th percentile (gray box), and the median (bar inside of gray box). It appears that there are differences between the mean estimated VsZ and the measured VsZ for more than half of the selected stations are more than 20%. Furthermore, the range in estimated Vsz values spans hundreds of meters per second in most cases. So, while this method is attractive and a potentially valuable tool to estimate VS30 over large, well-instrumented areas, results may be quite unstable. There are possibly two reasons for this instability. One reason is that the selection of 𝑈𝑈̇𝑅𝑅 and 𝑈𝑈̇𝑍𝑍 is subjective. Theoretically the ratio between 𝑈𝑈̇𝑅𝑅 and 𝑈𝑈̇𝑍𝑍 is constant at every moment according to Eq. (3-3), but in reality, it is very common for the velocity time histories of 𝑈𝑈̇𝑅𝑅 and 𝑈𝑈̇𝑍𝑍 to show completely different trends at different moments in time. Under such circumstances is it appropriate to use the first peak value or an averaged value over a short duration? Since the answer is unclear, for now it is a good strategy to use only “good” velocity time histories. Here are a few recommendations for picking “good” velocity time histories. a) Use records from small, distant earthquakes (i.e., MW 760 m/s) within at the Precambrian and Paleozoic igneous and metamorphic units of the Llano Uplift and within the Paleozoic shales, siltstones, and sandstones of the North-Central Plains. Nonetheless, it should be noted that the interpolated VS30 map shown in Figure 3.21 does not capture short distance variations in geology and subsurface conditions, because the spacing between VS30 estimates is generally large (about 75 km).
73
VVS30 < 200 200 m/s m/s SZ < 200 200m/s m/s 1500 m/s
(a) Locations and Magnitudes (b) Locations of seismic recording Figure 4.3: Earthquake events selected for this study
87
Figure 4.7 illustrates the computed response spectra for the selected ground motions. Response spectra are categorized based on the corresponding peak ground acceleration. Both horizontal components are included. Four PGA bins were defined; PGA < 0.05 g, 0.05 g ≤ PGA < 0.1 g, 0.1 g ≤ PGA < 0.3 g, and PGA > 0.3 g. Figure 4.7 also depicts the median response spectra for the recordings from each PGA bin (red line), as well as the target spectra for the three distinct regions. Accordingly, 357 individual component records were characterized by PGA less than 0.05 g, 26 records had PGA between 0.05 g and 0.1 g, 12 records had PGA values between 0.1 g and 0.3 g, while 5 records had PGA values greater than 0.3 g. Based on Figure 4.7, the selected ground motions can be considered representative of the seismic hazard in Texas, as estimated via the constructed target spectra (Figure 4.6). Although the ground motions having PGA less than 0.05 g produce response spectral values that are slightly lower than the Rest of Texas target spectrum, this target spectrum was constructed as the upper limit response for most areas in Texas excluding West Texas and the Dallas-Fort Worth area. Records with PGA between 0.05 g and 0.1 g compare relatively well with the Dallas-Fort Worth target spectrum, while ground motions with PGA greater between 0.1 g and 0.3 g produce spectral accelerations that on average match the West Texas target spectrum. Nonetheless, it is important to note that since most motions with PGA between 0.05 g and 0.3 g are recorded at short distances and are from relatively smaller magnitude earthquakes (median MW = 4.9 and Rhyp = 18 km for motions with 0.05 g ≤ PGA < 0.1 g; median MW = 4.3 and Rhyp = 7 km for motions with 0.1 g ≤ PGA < 0.3 g), they are lacking long period energy. Thus, these motions do not compare well with the target spectra at periods greater than approximately 0.2 sec. These comparisons with the target spectra indicate that the recorded motions need to be scaled to larger intensities to better represent the expected frequency content at periods greater than 0.2 sec. Finally, the ground motions with PGA > 0.3 g produce substantially higher spectral accelerations than the three target spectra, for all periods. Even though these records do not seem to be representative of the seismic hazard within the state of Texas, as defined by the 1-year seismic hazard maps, they can provide an upper limit, worst case scenario for the assessment of critical infrastructure across Texas.
88
Figure 4.4: Histograms of ground motion parameters for the selected recordings
89
Spectral Acceleration (g)
0
0
0
0
Period (sec) Figure 4.5: Schematic of the determination of a target response spectrum based on IBC
SDS (g)
Dallas 0.18
West Texas 0.35
Rest of Texas 0.05
SD1 (g)
0.025
0.035
0.01
0.4 Dallas
Spectral Acceleration (g)
0.35
West Texas 0.3
Rest of Texas
0.25 0.2 0.15 0.1 0.05 0 0.001
0.01
0.1
1
10
Period (sec) Figure 4.6: Estimated target response spectra for Dallas and West Texas
90
Figure 4.7: Response spectra of the selected ground motions for different bins of PGA values To further assess the frequency content of the selected ground motions, the spectral accelerations of the selected recordings are compared against predictions by several ground motion models (GMMs), for four magnitude bins (4.0 ≤ MW < 4.5, 4.5 ≤ MW < 5.0, 5.0 ≤ MW < 5.5, and MW ≥ 5.5) in Figure 4.8. The median MW, Rhyp, and VS30 values for each magnitude bin (Figure 4.8) are used to compute the model predictions. All spectral accelerations are normalized by the corresponding PGA values (Figure 4.8) to better evaluate the frequency content of the motions. The following ground motion predictive models are used as reference: i) the Hassani and Atkinson (2015) (HA15), developed as part of the Next Generation Attenuation (NGA)-East project; ii) the Atkinson (2015) (A15) model developed for small-to-moderate events at short hypocentral distances with application to regions with induced seismicity; and iii) the Adjusted Hassani and Atkinson (2015) model (Zalachoris and Rathje, 2017) (Adjusted HA15).
91
Figure 4.8: Comparison of normalized response spectra between the selected ground motions with and predictions by GMPEs The Adjusted HA15 model, developed by Zalachoris and Rathje (2017), using the ground motion database for Texas, Oklahoma, and Kansas described in Section 4.2, understandably, provides the best fit to the selected ground motions, for all magnitudes. The “small-magnitude” A15 model, developed using data from Western United States (WUS), predicts a response spectral shape richer at periods greater than 0.1 s. This difference is expected because of the difference in attenuation characteristics between WUS and CEUS. Finally, the HA15 GMPE, developed using the NGAEast ground motion database, seems to provide a spectral shape that peaks at relatively lower periods (i.e., T < 0.1 s) than the selected ground motions. This is possibly due to the fact that the selected ground motions were recorded during potentially induced events in Texas, Oklahoma, and Kansas, which are believed to be associated with lower stress drops (Hough 2014), and thus lower corner frequencies than natural seismicity. Contrary, the NGA-East ground motion database (Goulet et al. 2014) primarily includes data from natural events in CEUS, hence the difference in the frequency content observed in Figure 4.8. 92
4.5. Summary This chapter described a suite of ground motions to be used in this study to represent Texas seismicity. The processes associated with the creation of a database of over 5,000 ground motions recorded in Texas, Oklahoma, and Kansas was presented. A subset of 200 three-component recordings were selected from the ground motion database to be used for the structural response history analyses to be presented in Chapter 9 of this report. The selected ground motions span a magnitude range from 4 to 5.8 and a range of hypocentral distances from 5 km to 420 km. It was shown that the corresponding computed PGA values, which range from 0.0025 g to 0.595 g, are generally consistent with the seismic hazard in the state of Texas, as assessed by USGS. Furthermore, the frequency content of the selected ground motions was evaluated by comparing the spectral accelerations from the selected motions with several ground motion prediction models.
93
Chapter 5. Texas Hazard Maps 5.1. Introduction This chapter provides hazard maps developed for Texas, as well as a description of the process associated with the development of these hazard maps. The organization of this chapter is as follows. First, a brief description of the seismic hazard in the Central and Eastern United States (CEUS) is provided. Such a description is used to define the level of ground motion that can be considered “representative” at different locations throughout the CEUS, and particularly in the State of Texas. Subsequently, the Ground Motion Model (GMM), as well as the VS30 map of Texas used for the development of the final hazard maps are discussed. Finally, the constructed hazard maps for two deterministic earthquake scenarios occurring at four different locations in Texas are presented.
5.2. Seismic Hazard in the State of Texas One of the most recent assessments of the seismic hazard in the Central and Eastern United States (CEUS) that includes contributions from both induced and natural earthquakes was published by the United States Geological Survey (USGS) by Petersen et al. (2016a, 2017). More specifically, the USGS developed short-term, 1-year seismic hazard forecasts for 2016 and 2017 for the CEUS using input models, which consider alternative earthquake catalogs, maximum magnitudes and ground motion models. As a result, seismic hazard maps for 1-percent probability of exceedance in 1 year were developed. Figure 5.1 and Figure 5.2 illustrate the corresponding 2017 seismic hazard maps for peak ground acceleration (PGA) and spectral acceleration (Sa) at a period of 1.0 sec, respectively. Based on Figure 5.1, the ground shaking corresponding to 1-percent probability of exceedance in 1 year reaches 0.25 g and 0.125 g in West Texas and the Dallas-Fort Worth area, respectively, while for the rest of the state of Texas the hazard does not exceed 0.025 g. The aforementioned assessment by USGS (Petersen et al. 2016a, 2017) utilized a probabilistic framework for the quantification of the seismic hazard in CEUS. Nonetheless, the present report focuses on providing simplified hazard maps based on deterministic scenarios of earthquake events. This report presents extreme earthquake scenarios, namely events with magnitudes M = 5.0 and M = 6.0, occurring at four different locations, selected based on population density and/or current seismicity trends. These four locations were selected: i) Dallas, ii) Dallas-Fort Worth International Airport, iii) Fort Worth, and iv) El Paso. To develop the hazard maps for these scenarios, we use a newly developed Ground Motion Model (GMM), particularly tuned to the observed—and potentially induced—seismicity in the States of Texas, Oklahoma, and Kansas (Zalachoris and Rathje 2017). Moreover, to account for the effects of the local site conditions on the expected level of ground shaking, the comprehensive VS30 map of Texas, as presented in Chapter 3, is utilized.
94
Figure 5.1: USGS 2017 1-year seismic hazard map – PGA (Petersen et al. 2017)
Figure 5.2: USGS 2017 1-year seismic hazard map – Sa (1.0 sec)(Petersen et al. 2017).
95
5.3. Ground Motion Model for Texas Hazard Maps Earthquake engineering design and assessment requires reliable estimates of ground motions that may be produced by future earthquakes. Such prediction requires a detailed and accurate modeling of earthquake source and attenuation characteristics. The increasing number of recorded motions from past events provide an empirical basis to constrain the model parameters for ground motion prediction. Taking advantage of the observational data, numerous statistical models have been developed that predict the probability distributions of observed ground motion parameters. These statistical models are generally referred to as Ground Motion Prediction Equations (GMPEs) or Ground Motion Models (GMMs). Typically, GMMs are based on regression analysis that fit a predefined functional form to data from recordings. As a result, a ground motion parameter is related to a set of variables describing the earthquake source, the wave propagation path, and local site conditions (Douglas, 2003). The models generally are in the form: ln(𝒀𝒀) = 𝒇𝒇𝒔𝒔𝒔𝒔𝒔𝒔𝒔𝒔𝒔𝒔𝒔𝒔 (𝑚𝑚𝑚𝑚𝑚𝑚𝑚𝑚𝑚𝑚𝑚𝑚𝑚𝑚𝑚𝑚𝑚𝑚, 𝑚𝑚𝑚𝑚𝑚𝑚ℎ𝑎𝑎𝑎𝑎𝑎𝑎𝑎𝑎𝑎𝑎) + 𝒇𝒇𝒅𝒅𝒅𝒅𝒅𝒅𝒅𝒅𝒅𝒅𝒅𝒅𝒅𝒅𝒅𝒅 (𝑚𝑚𝑚𝑚𝑚𝑚𝑚𝑚𝑚𝑚𝑚𝑚𝑚𝑚𝑚𝑚𝑚𝑚, 𝑑𝑑𝑑𝑑𝑑𝑑𝑑𝑑𝑑𝑑𝑑𝑑𝑑𝑑𝑑𝑑) + 𝒇𝒇𝒔𝒔𝒔𝒔𝒔𝒔𝒔𝒔 (𝑖𝑖. 𝑒𝑒. , 𝑠𝑠ℎ𝑒𝑒𝑒𝑒𝑒𝑒 𝑤𝑤𝑤𝑤𝑤𝑤𝑤𝑤 𝑣𝑣𝑣𝑣𝑣𝑣𝑣𝑣𝑣𝑣𝑣𝑣𝑣𝑣𝑣𝑣, 𝑉𝑉𝑆𝑆 )
(5.1)
where 𝑓𝑓𝑠𝑠𝑠𝑠𝑠𝑠𝑠𝑠𝑠𝑠𝑠𝑠 is the earthquake source term, 𝑓𝑓𝑑𝑑𝑑𝑑𝑑𝑑𝑑𝑑𝑑𝑑𝑑𝑑𝑑𝑑𝑑𝑑 is the site-to-source distance term, 𝑓𝑓𝑠𝑠𝑠𝑠𝑠𝑠𝑠𝑠 is the site effects term (or “Site Amplification Model”), and 𝑌𝑌 is the ground motion parameter. Common predicted ground motion parameters are: Peak Ground Acceleration (PGA), Peak Ground Velocity (PGV), and Pseudo Spectral Acceleration (PSA) at various spectral periods (T). As expressed by Equation (5.1), the key elements of most GMPEs include: Earthquake Magnitude, as quantified through Moment Magnitude (𝑀𝑀𝑊𝑊 )
Style of faulting (mechanism): Reverse (RV), or Strike-Slip (SS), or Normal (N) Source-to-site distance, typically quantified via 𝑅𝑅𝑅𝑅𝑅𝑅𝑅𝑅 : the distance to fault rupture
Soil conditions, usually parameterized via 𝑉𝑉𝑆𝑆30 : the time-averaged shear wave velocity of the upper 30 m Depth to bedrock (i.e., 𝑍𝑍1.0 , depth to 𝑉𝑉𝑆𝑆 = 1.0 𝑘𝑘𝑘𝑘/𝑠𝑠)
In the past decades, hundreds of GMMs have been developed (Douglas 2016) for application in various tectonic regions (i.e., shallow crustal, subduction zones, stable continental). The selection of the most appropriate GMM for a certain application is one of the most crucial decisions for the development of seismic hazard maps. In particular, for the State of Texas, the observed seismicity has been associated with and possibly “induced” by human activities, such as fluid injection or extraction (Hough 2014). Due to their nature, the induced events are likely to be of smaller magnitude and at shallower focal depth than natural earthquakes. These characteristics of induced seismicity often make the development of application-specific GMMs a necessity. Acknowledging the lack of a ground motion model
96
developed entirely based on regional data, Zalachoris and Rathje (2017) utilized recordings at seismic stations in Texas, Oklahoma, and Kansas (presented previously in Section 4.2 of this report), to develop a new GMM for small-to-moderate earthquake events particularly tuned to the characteristics of the observed seismicity in these States. The new model (hereafter ZR18) was developed by modifying a CEUS GMM using regional observations of shaking. The Hassani and Atkinson (2015) model (hereafter HA15), which was developed as part of the Next Generation Attenuation—East (NGA-East) project (PEER, 2015), was selected as the reference CEUS GMM. Additional details on development of this GMM can be found in Zalachoris and Rathje (2018). The reference site condition of the Zalachoris and Rathje (2017) model, in terms of the timeaverage shear wave velocity of the upper 30 m (VS30), is VS30 = 760 m/s. The variation of the predicted peak ground acceleration (PGA) and spectral acceleration at a period of 1.0 sec (Sa(1.0s)) with epicentral distance (Repi) for the two scenarios (M = 5.0 and M = 6.0) considered in this study, for hard rock (i.e., VS30 = 760 m/s) and soft soil (i.e., VS30 = 200 m/s), are illustrated in Figure 5.3 As seen in Figure 5.3a, the Zalachoris and Rathje (2017) GMM predicts reference rock (i.e., VS30 = 760 m/s) PGA values as high as 0.45g and 0.62g at very close epicentral distances (Repi < 1 km), and values of 0.015g and 0.043g at an epicentral distance of Repi = 50 km, for M = 5.0 and M = 6.0, respectively. Similarly, for soft soil conditions (VS30 = 200 m/s) (Figure 5.3b), ZR18 results in PGA values of 0.37g and 0.38 g at very close epicentral distances (Repi < 1 km), and values of 0.018g and 0.048g at an epicentral distance of Repi = 50 km, for M = 5.0 and M = 6.0, respectively. To account for the effects of the local site conditions on the expected level of ground shaking, the comprehensive VS30 map of Texas, as developed as part of the present project and presented in Chapter 3, is used as an input for the Zalachoris and Rathje (2017) predictive model.
97
1.E+01
1.E+01
Spectral Acceleration at 1.0 sec (g)
Peak Ground Acceleration, PGA (g)
(a)
VS30 = 760 m/s 1.E+00
1.E-01
ZR18 - M=5.0
1.E-02
ZR18 - M=6.0
VS30 = 760 m/s 1.E+00
1.E-01
ZR18 - M=5.0
1.E-02
ZR18 - M=6.0 1.E-03
1.E-03 0.1
1
10
0.1
100
10
100
1.E+01
1.E+01
Spectral Acceleration at 1.0 sec (g)
Peak Ground Acceleration, PGA (g)
(b)
1
Epicentral Distance, Repi (km)
Epicentral Distance, Repi (km)
VS30 = 200 m/s 1.E+00
1.E-01
ZR18 - M=5.0
1.E-02
ZR18 - M=6.0
VS30 = 200 m/s 1.E+00
1.E-01
ZR18 - M=5.0
1.E-02
ZR18 - M=6.0 1.E-03
1.E-03 0.1
1
10
0.1
100
1
10
100
Epicentral Distance, Repi (km)
Epicentral Distance, Repi (km)
Figure 5.3: Variation of peak ground acceleration (PGA), and spectral acceleration at 1.0 sec with epicentral distance
5.4. Hazard Maps for Deterministic Earthquake Event Scenarios Using the aforementioned Ground Motion Model developed by Zalachoris and Rathje (2017), as well as the VS30 map of Texas shown in Figure 3.26, a series of maps were constructed, depicting the median predicted ground motion within a distance of 80–100 km of the four epicentral locations considered in this study; namely Dallas, Dallas-Fort Worth International Airport, Fort Worth, and El Paso. Figure 5.4 shows the detailed VS30 distribution across the Dallas-Fort Worth basin and the El Paso study area. Two deterministic earthquake events with magnitudes M = 5.0 and M = 6.0 were considered. Accordingly, eight hazard maps (four locations × two magnitudes) were constructed for peak ground acceleration (PGA), as well as for spectral acceleration at a period of 1.0 sec (Sa(1.0s)). These maps are shown in Figure 5.5 through Figure 5.12. Additional Shapefiles containing the PGA and Sa(1.0s) contour lines corresponding to the hazard maps of Figure 5.5 through Figure 5.12, are provided as supplemental electronic material to this report. The depicted hazard maps of Figure 5.5 through Figure 5.12 correspond to the PGA and Sa(1.0s) vs. Epicentral Distance relationships provided by ZR18 model, using VS30 values from the
98
constructed VS30 Map of Texas (Figure 3.26). At this point, it has to be noted that due to the lack of VS30 maps outside of the State of Texas, the hazard maps for El Paso (Figure 5.11 and Figure 5.12) were developed assuming VS30 = 760 m/s for areas in New Mexico and Mexico. As seen in Figure 5.5 through Figure 5.12, at the vicinity of the earthquake epicenter, the PGA values range between 0.42g (for El Paso, Figure 5.11) and 0.50g (for DFW, Figure 5.7), for M = 5.0, and between 0.54g (for El Paso, Figure 5.11) and 0.63g (for DFW, Figure 5.7), for M = 6.0. Similarly, the Sa(1.0s) values range between 0.047g (Figure 5.12) and 0.065g (Figure 5.8), for M = 5.0, and between 0.22g (Figure 5.12) and 0.29g (Figure 5.8), for M = 6.0. Nonetheless, these values decrease relatively quickly with distance, with PGA at Repi = 30 km being on the order of 0.03g and 0.1g, and Sa(1.0s) on the order of 0.006g and 0.05g, for M = 5.0 and M = 6.0, respectively. In addition to the hazard maps and contour lines corresponding to the deterministic hazard maps for PGA and Sa(1.0s), the Shapefiles supplementing this manuscript also contain contour lines of spectral accelerations at periods of 0.05s and 0.2s for the four locations and two event scenarios considered.
Figure 5.4: Detailed VS30 distribution across the Dallas-Fort Worth basin and the El Paso study areas
99
Figure 5.5: Hazard maps for peak ground acceleration, for M = 5.0 and M = 6.0 – Dallas
Figure 5.6: Hazard maps for spectral acceleration at 1.0 sec, for M = 5.0 and M = 6.0 – Dallas
100
Figure 5.7: Hazard maps for peak ground acceleration, for M = 5.0 and M = 6.0 – Dallas-Fort Worth International Airport
Figure 5.8: Hazard maps for spectral acceleration at 1.0 sec, for M = 5.0 and M = 6.0 – DallasFort Worth International Airport
101
Figure 5.9: Hazard maps for peak ground acceleration, for M = 5.0 and M = 6.0 – Fort Worth
Figure 5.10: Hazard maps for spectral acceleration at 1.0 sec, for M = 5.0 and M = 6.0 - Fort Worth
102
Figure 5.11: Hazard maps for peak ground acceleration, for M = 5.0 and M = 6.0 – El Paso
Figure 5.12: Hazard maps for spectral acceleration at 1.0 sec, for M = 5.0 and M = 6.0 – El Paso
103
5.5. Summary A series of hazard maps presented in this study are presented. Initially, the seismic hazard in the CEUS, and particularly in the State of Texas, as recently assessed by USGS, was presented. Subsequently, the Zalachoris and Rathje (2018) Ground Motion Model was briefly discussed, which was utilized for predicting median spectral amplitudes, as well as the VS30 map of Texas developed as part of this project. Then, seismic hazard maps were constructed for four locations (Dallas, Dallas-Fort Worth International Airport, Fort Worth, El Paso) and two deterministic scenario events (M = 5.0 and M = 6.0). Ground motion predictions are provided for four spectral periods; namely, PGA, 0.05 sec, 0.2 sec, and 1.0 sec.
104
Chapter 6. TxDOT Bridge Inventory and Representative Bridges 6.1. Overview When performing fragility analysis on a bridge network for a large region or state, such as Texas, a challenge that arises is determining an accurate way to estimate the seismic vulnerability of the entire bridge inventory without having to assess every individual structure. The first step in addressing this challenge is developing a thorough understanding of the bridge inventory for the area of study. In this chapter, an analysis of the TxDOT highway bridge inventory is conducted using the FHWA National Bridge Inventory (NBI), as well as additional information provided by TxDOT. Information of interest in characterizing the bridge inventory for seismic fragility analysis includes, but is not limited to, bridge structural system and material, era of construction, and geometry. Moreover, the chapter discusses specific components and structural details of Texas bridges. Bridge design and construction techniques not only vary among the different bridge classes, but also may vary based on era of construction. The second step in this process is using the information from the bridge inventory analysis to create representative bridge samples that are statistically significant yet nominally similar. This chapter is also intended to provide an overview of the sampling methods used to determine the representative bridge samples used in this study.
6.2. Bridge Classes When assessing the seismic vulnerability of an individual bridge, ideally one would generate fragility curves using representative models of the specific bridge in question. However, when assessing the vulnerability of a bridge network for a region or state, developing fragility curves for individual bridges is not feasible. An alternative approach is to generate fragility curves for typical bridge classes representative of the bridge population in question. Thus, an important part of the fragility assessment is understanding and characterizing the bridge inventory for the area of study. This is typically done by gathering data from the National Bridge Inventory database, and supplementary information from standard bridge drawings or owner expertise. The National Bridge Inventory (NBI) is a database compiled by the Federal Highway Administration (FHWA) to help track and record bridge inspection data. The NBI was first created in the 1970s following the implementation of the National Bridge Inspection Standards, which required every bridge located on a public road be inspected at least once every two years (FHWA, 1994). The database does not provide a complete description of each bridge; however, it does provide basic information that can be used to create generalized highway bridge classes. The NBI contains 116 fields of information including identification information, design types, material types, geometric data, functional descriptions, condition and inspection ratings, etc. The Recording and Coding Guide for the Structure Inventory and Appraisal of the Nation’s Bridges (NBI Coding Guide, 1995) is used to decode the information in each of the 116 fields.
105
When creating bridge classes for use in a seismic fragility assessment, it is important to characterize the bridge classes such that the bridges assigned to them are expected to have similar seismic behavior. Typically, bridge classes are represented by design type, material type, number of spans, and span continuity (Nielson, 2005; Ramanathan, 2012). In this study, bridge classes are represented by superstructure design type, material type, number of spans, and span continuity. Table 6.1 and Table 6.2 show possible material and design types as listed in NBI. Table 6.1: Superstructure material types listed in NBI
Description Concrete (Simply Supported) Concrete Continuous Steel (Simply Supported) Steel Continuous Prestressed Concrete (Simply Supported) Prestressed Concrete Continuous Wood or Timber Masonry Aluminum, Wrought Iron, or Cast Iron Other Table 6.2: Superstructure design types listed in NBI
Description Slab Stringer/Multi-beam or Girder Girder and Floor Beam System Tee Beam Box Beam or Girders-Multiple Box Beam or Girders-Single or Spread Frame Orthotropic Truss-Deck Truss-Thru Arch-Deck Arch-Thru
Suspension Stayed Girder Movable-Lift Movable-Bascule Movable-Swing Tunnel Culvert Mixed Types Segmental Box Girder Channel Beam Other
According to the NBI, there are 52,937 bridges in the state of Texas; however, only 33,586 of them are considered on-system, i.e., maintenance responsibility belongs to TxDOT. For the purposes of this study, only on-system bridges are considered in the analysis. Of the 33,586 on-system bridges, 13,441 are listed in NBI as culverts, which are assumed out of scope for this project. Table 6.3 shows the remaining 20,145 on-system bridges separated into 11 different bridge classes based on superstructure system and material, along with an abbreviated name and the frequency of each bridge class.
106
Table 6.3: Texas bridge classes Bridge Type
Abbreviation Amount Percentage (%)
Multi-Span Continuous Reinforced Concrete-Slab
MCRC-Slab
1,068
5.30
Multi-Span Simply Supported Reinforced Concrete-Slab
MSRC-Slab
1,566
7.77
Multi-Span Simply Supported Reinforced Concrete-Girder
MSRC
3,336
16.56
Multi-Span Simply Supported Reinforced Concrete-Tee Beam
-
829
4.12
Single Span Reinforced Concrete-Girder
-
137
0.68
Multi-Span Simply Supported Prestressed Concrete-Girder
MSPC
6,808
33.79
Single Span Prestressed Concrete-Girder
SSPC
1,753
8.70
-
849
4.21
Multi-Span Continuous Steel-Girder
MCSTEEL
2,075
10.30
Multi-Span Simply Supported Steel-Girder
MSSTEEL
457
2.27
Single Span Steel-Girder
-
141
0.70
Other
-
1,126
5.59
20,145
100.00
Multi-Span Simply Supported Prestressed Concrete-Box Girder
Total
As seen in Table 6.3, seven out of the twelve bridge classes (those in bold in Table 6.3) make up 88.7% of the total on-system bridges in Texas. Based on the research requested by TxDOT in the project problem statement, these seven classes are those considered in this study. The five nonbold face entries in Table 6.3 are considered outside the scope for this study. As seen in the table, Single Span Reinforced Concrete-Girder and Single Span Steel-Girder bridges consist of a very small percentage (1.38%) of the total on-system inventory. The class listed as “Other” makes up 5.59% of the total bridge inventory, but it consists of a large number of smaller bridge types that by themselves have no real significance towards the total percentage (e.g., bridges of different materials such as wood and masonry, cable-stayed bridges, suspension bridges, etc.). The other two bridge classes, i.e., Multi-Span Simply Supported Reinforced Concrete-Tee Beam and MultiSpan Simply Supported Prestressed Concrete-Box Girder bridges, represent a reasonable percentage (4.21% and 4.12%, respectively) of the total; however, neither of these systems were indicated by TxDOT as a superstructure type of initial interest in the research problem statement, and are considered out of scope for this study. Figure 6.1 shows the locations of all on-system bridges considered in the scope of this study indicating those with pre-stressed concrete girders (MS PC-Girder and SS PC-Girder), steel girders (MC Steel-Girder and MS Steel-Girder, and those not falling into either of these categories. This figure shows trends in the geographic distribution of Texas bridges. While bridges tend to be concentrated in and around larger cities, this concentration is particularly true for steel girder bridges. Similarly, PC girder bridges tend to be concentrated along major interstate highways in Texas. This concentration of specific bridge classes near highly populated areas and along major
107
interstate thoroughfares could be of interest, as damage to these types of bridges during an earthquake event could have greater impact on the public and state commerce.
PS Girder Steel Girder Other
Figure 6.1: TxDOT bridge locations in scope of study
6.3. Bridge Geometric Statistics With the general bridge classes defined, the next step is to examine the characteristics of each individual bridge class. The main parameters for bridge characterization are number of spans, maximum span length, deck width, vertical under-clearance, skew angle, substructure type, year of construction. These parameters were retrieved from NBI and the TxDOT bridge database and are analyzed to identify general geometric trends throughout the entire bridge population, as well as within each bridge class. In this regard, probabilistic distributions of the geometric parameters and age of the bridge population were developed and reported in this chapter. These parameters, which are depicted in Figure 6.2 and Figure 6.3, are critical for developing numerical bridge models to simulate seismic behavior, as these parameters greatly affect structural stiffness, mass, and fundamental periods of vibration.
108
Figure 6.2: Profile of a typical three-span bridge
Figure 6.3: Cross section of a typical steel girder bridge
6.3.1. Number of Spans The number of spans parameter takes the form of distinct integer values, and therefore, can be examined through counting the frequency of data at each span number. In this study, probability mass functions (PMFs) are generated and used to analyze the number of spans for each bridge class. Figure 6.4 and Figure 6.5 show PMFs of number of spans for simply supported and continuous span bridges, respectively. PMFs are generated by dividing the number of bridges having a particular span number by the total number of bridges in that class.
109
0.4
0.3
0.3
Probability
Probability
0.4
0.2
0.1
0.2
0.1
0
0 0
20
40
60
80
100
0
20
Number of Spans
40
60
80
100
80
100
Number of Spans
a) MSRC-Slab
b) MSRC
.
0.4
0.4 0.3
Probability
0.3
Probability
0.2
0.1
0.2
0.1 0 0
20
40
60
80
100
0
Number of Spans
0
20
40
60
Number of Spans
c) MSSTEEL
d) MSPC
0.4
0.4
0.3
0.3
Probability
Probability
Figure 6.4: PMFs of number of spans for multi-span simply supported bridge classes
0.2
0.2
0.1
0.1
0
0 0
20
40
60
80
100
0
20
40
60
Number of Spans
Number of Spans
a) MCRC-Slab
b) MCSTEEL
80
100
Figure 6.5: PMFs of number of spans for multi-span continuously supported bridge classes
110
Table 6.4 shows statistics for the number of spans for each bridge class. The data shows the typical span configuration is between two and six spans, with three spans being the most common. On average, 75% of the simply supported bridges have less than six spans, while 80% of the continous bridges have less than six spans. Table 6.4: Span number statistics
Bridge Class
Mean
Std Dev.
Median
Mode
MCSTEEL
4.10
3.33
3
3
MSSTEEL
5.40
4.08
4
3
MSPC
4.86
5.40
3
3
MSRC
5.72
6.91
4
3
MCRC-Slab
5.70
7.35
4
3
MSRC-Slab
4.78
3.52
4
3
For each bridge class, the distributions for number of spans were modified before sampling to reduce unnecessary complexities in the modeling process. For example, for each bridge class, there are some bridges in the population that have a very large number of spans (e.g., 12 or more). Using a Latin Hypercube Sampling approach, described in more detail in Section 6.7, would result in samples with a similarly large number of spans that would result in a significant increase in computational expense during the nonlinear response-history analyses, while the expected damage is not expected to be significantly different from a bridge with significantly fewer spans (Sullivan and Nielson 2010). Thus, in this study, the number of spans considered in the sampling methods are reduced to only two to five span configurations to avoid having models with an excessive number of spans. This range of spans covers over 70% of the population for all bridge classes (see Figure 6.4 and Figure 6.5 for span number distributions), except for the multi-span continuous concrete slab bridges with only 67% of the population having between two to five spans (see Figure 6.6). This modification is done once again to reduce the computational expense for the large number of nonlinear responsehistory analyses that are conducted in the seismic fragility assessment. Following this reasoning and the guidance of HAZUS (FEMA 2003), most past fragility analysis studies such as Choi (2002), Nielson (2005), Pan (2007), Ramanathan (2012), and Tavares et al. (2013) have only considered a constant three-span bridge configuration. In some cases, fragility results from the base three-span configuration can be extrapolated to predict the response of bridges with a larger number of spans (FEMA 2003; Sullivan and Nielson 2010); however, the number of spans, ranging from two to five, are explicitly considered as a variable in this study. Table 6.17 and Table 6.23 at the end of this chapter present the randomly generated number of spans for 8 different configurations of each bridge class.
111
0.4
Sampling range 67% of population
Probability
0.3
0.2
0.1
0 02
5
20
40
60
80
100
Number of Spans
Figure 6.6: Sampling range for number of spans of MCRC-slab bridge class
6.3.2. Span Length Recording the length of every span in every bridge in the NBI would not be feasible; however, the maximum span length is recorded in the NBI and can be used along with some common assumptions to establish a generalized span configuration. The two assumptions adopted in this study are: 1) span lengths are symmetrical along the length of the bridge; 2) approach span lengths are constant within a certain bridge class. For example, a two-span bridge would have two spans with lengths equal to the maximum. A bridge with three or more spans would have interior spans with lengths equal to the maximum, while the end spans would be considered the approach spans with a standard length. Approach span length is not listed in the NBI; however, approach span lengths are determined from bridge drawings acquired from TxDOT and are used to define a typical approach span length for each bridge class. Table 6.5 shows some statistics to show general trends of maximum span length for each bridge classes, and Figure 6.7 through Figure 6.9 show histograms of the actual data. For each bridge class, the span length for each bridge configuration are randomly generated using the information listed in Table 6.5.
112
Table 6.5: Maximum span length statistics
Bridge Class Mean (ft) Std Dev. (ft) Median (ft)
Coefficient of Variation
MCSTEEL
102.13
52.82
88.00
0.52
MSSTEEL
48.20
26.57
40.03
0.55
MSPC
86.60
28.20
80.00
0.33
MSRC
34.51
5.18
30.84
0.15
SSPC
96.30
23.70
98.00
0.25
MCRC-Slab
32.81
11.98
29.86
0.37
MSRC-Slab
23.52
3.48
24.93
0.15
After examining the data, there are a few trends that should be noted. First, as expected, the continuous span bridge types have longer span lengths than their simply supported counterparts. For example, the MCSTEEL class has an average span length of 103 feet, while the MSSTEEL class only has an average of 48 feet. Second, for the simply supported bridge classes, the MSPC class has the longest spans, exceeding the MSSTEEL class by almost 50%, the MSRC by 60%, and the MSRC-Slab class by almost 70%. Figure 6.7 through Figure 6.9 show that most of the bridge classes have one or two prominent span lengths; however, the MSPC and SSPC classes appear to have lengths more evenly distributed between a given range.
113
0.7
0.6
0.6
0.5
0.5
0.4
0.4
Probability
Probability
0.7
0.3
0.3
0.2
0.2
0.1
0.1
0
0 10
20
30
40
50
20
10
Span Length (ft)
a) MSRC-Slab
40
50
b) MSRC
0.7
0.7
0.6
0.6
0.5
0.5
0.4
0.4
Probability
Probability
30
Span Length (ft)
0.3
0.3
0.2
0.2
0.1
0.1
0
0 50
100
150
200
Span Length (ft)
50
100
150
200
Span Length (ft)
c) MSPC
d) MSSTEEL
Figure 6.7: Histograms of maximum span length for multi-span simply supported bridge classes
114
0.7
0.6
0.6
0.5
0.5
0.4
0.4
Probability
Probability
0.7
0.3
0.3
0.2
0.2
0.1
0.1
0
0
50
100
150
200
50
Span Length (ft)
100
150
200
Span Length (ft)
a) MCRC-Slab
b) MCSTEEL
Figure 6.8: Histograms of maximum span length for multi-span continuous bridge classes 0.7
0.6
Probability
0.5
0.4
0.3
0.2
0.1
0 50
100
150
200
Span Length (ft)
Figure 6.9: Histogram of maximum span length for single span bridge types Highway bridges with three or more spans typically consist of a combination of main spans and approach spans. Main spans are typically the longer spans at the middle of the structure, while the approach spans are designated as the shorter spans used on either end of the bridge. To develop representative bridge models, it important to understand and utilize appropriate approach span lengths for each bridge class. As previously mentioned, approach span lengths are not listed in the NBI database and are, therefore, commonly determined through review of relevant bridge plans (Nielson 2005; Ramanathan 2012). Through review of Texas as-built drawings, it was determined that span lengths are typically symmetrical along the length of the bridge, and approach span lengths follow noticeable trends among each bridge class. Some of these trends and the approach span lengths selected for each bridge class in this study are presented below. 115
Approach span length for the multi-span, simply supported prestressed and steel girder bridge classes (i.e., MSPC and MSSTEEL) varies between 40 feet and 65 feet; however, an approach span length of 40 feet was found to be the most common, and is used in this study for both of these bridge classes. For the continuous span steel girder bridge class (MCSTEEL), it was determined that the approach span lengths had more variability and were directly correlated to the main span length. After a thorough investigation of as-built drawings (see Appendix C for list of relevant asbuilt drawings), it was concluded that approach span lengths for the MCSTEEL bridge class range between 60 to 80 percent of the main span length. The reinforced concrete bridge classes (i.e., MSRC, MSRC-Slab, and MCRC-Slab) tend to have very different trends when it comes to approach span lengths. For example, the MSRC and MSRCSlab type bridges do not typically have shorter approach spans; instead, the main span length is utilized for all spans throughout the length of the structure. This is predominantly due to the heavily standardized design and construction processes used for these particular bridge types. Whether pre-cast or cast-in place construction is used, standardized forms and span lengths are often utilized for ease of design and construction. This standardization in the distributions of main span lengths for each of these bridge classes, which show that the majority of the MSRC Girder and Slab bridges in the Texas inventory, utilize one or two prominent span lengths (e.g., 30 or 40 feet span lengths, and 25 feet span lengths, respectively). The continuous reinforced concrete slab bridge class (i.e., MCRC-Slab) varies from its simply supported counterpart, utilizing approach spans that are typically shorter than the main spans. Review of relevant bridge plans showed that an approach span length of 25 feet is the most commonly used value for the MCRC-Slab bridge class; thus, it is assumed for all the MCRC-Slab bridges in this study. In summary, the length of approach spans, i.e., shorter spans used on either end of the bridge, takes constant values of 25 feet for MCRC-Slab bridges, 40 feet for MSPC and MSTEEL bridges. Therefore, for these three bridges classes, it is not a random variable. However, for MCSTEEL, it is a random variable that is uniformly distributed between 60 to 80 percent of the main span length. Moreover, for MSRC and MSRC-Slab bridges, it is the same as the length of the main spans, which are randomly generated based on the information in Table 6.5.
6.3.3. Deck Width The deck width (i.e., outer to outer distance of the bridge deck railings) is used to define the number of girders in a bridge and estimate the total seismic weight. Table 6.6 reports the basic statistics for this deck widths reported in the NBI, and Figure 6.10 through Table 6.24 show the distributions. One trend worth noting is the prestressed concrete girder bridges on average have wider decks than the steel and reinforced concrete girder bridges. Both the MSPC and SSPC classes have an average deck width of about 53 feet, while the steel girder classes have an average deck width around 45 feet, and the RC classes have an average around 40 feet. However, the median deck width values for the MSPC and SSPC classes are lower than the average values and are consistent with the other bridge types, indicating there are some larger deck width outliers that area causing the average to
116
be higher. This trend could be due to the fact that PC girder types tend to be more prevalent in newer construction, which would correspond with higher traffic demands and wider roadways. Table 6.6: Deck width statistics
Mean (ft) Std Dev. (ft) Median (ft)
Coefficient of Variation
MCSTEEL
47.72
22.97
41.67
0.48
MSSTEEL
45.17
17.88
44.20
0.40
MSPC
52.60
25.26
44.30
0.48
MSRC
38.59
13.81
37.30
0.36
SSPC
53.05
25.43
44.30
0.48
MCRC-Slab
44.98
16.57
42.00
0.37
MSRC-Slab
35.94
15.62
29.53
0.43
0.4
0.4
0.3
0.3
Probability
Probability
Class
0.2
0.2
0.1
0.1
0
0 0
50
100
0
150
50
a) MSRC-Slab
150
b) MSRC
0.4
0.4
0.3
0.3
Probability
Probability
100
Deck Width (ft)
Deck Width (ft)
0.2
0.2
0.1
0.1
0
0 0
50
100
150
0
50
100
Deck Width (ft)
Deck Width (ft)
c) MSPC
d) MSSTEEL
Figure 6.10: Histograms of deck width for multi-span simply supported bridge types
117
150
0.4
0.3
0.3
Probability
Probability
0.4
0.2
0.1
0.2
0.1
0 0
50
150
100
0
Deck Width (ft)
0
50
100
150
Deck Width (ft)
a) MCRC-Slab
b) MCSTEEL
Figure 6.11: Histograms of deck width for multi-span continuous bridge types 0.4
Probability
0.3
0.2
0.1
0 0
50
100
150
Deck Width (ft)
Figure 6.12: Histogram of deck width for single span bridge types For each bridge class, the distributions for deck width, which are presented in Table 6.6, were modified before sampling analysis to reduce unnecessary complexities in the modeling process. To ensure that the bridge samples capture the vast majority of the bridge inventory without generating unnecessarily complex and computationally expensive bridge models, the deck width was only sampled from the 10th to the 90th percentile of the entire inventory for each class. For example, the multi-span prestressed concrete girder (MSPC) bridge class has deck widths that range from 10 feet to 223 feet, but were sampled between 31 feet and 86 feet (i.e., the 10th and 90th percentiles, see Figure 6.13). Not only do the very narrow and excessively wide bridges only represent a very small percentage of the population, but the excessive deck width significantly increases the computational expense of the nonlinear analyses and is not expected to have a significant effect on seismic performance.
118
0.4
Probability
0.3
Sampling range 10th – 90th percentile 0.2
0.1
0 0
31
50
86
100
150
Deck Width (ft)
Figure 6.13: Sampling range for deck width of MSPC
6.3.4. Vertical Under-Clearance The height of a bridge column or bent plays can significant affect the bridge’s seismic response due to its correlation with lateral stiffness and natural periods of vibration. Unfortunately, NBI does not explicitly record column height. NBI does, however, record vertical under-clearance data, which can be used to infer column height. Unfortunately, under-clearance data is only listed in NBI for bridges that span over a roadway or railway. Since not all bridges span roadways or railways, the amount of data available to estimate column height is limited and may not be representative of all bridges in the state. In fact, only 43% (about 7,600 bridges) of the in-scope bridges in this study have under-clearance data listed, and some classes have no under-clearance data at all. To gather a large enough dataset to be statistically significant, the under-clearance data for all seven bridge classes are lumped together. It is possible that the available under-clearance data from NBI and TxDOT sources do not capture the actual range of column heights in the bridge population, as it does not account for bridges over water crossings or multi-level flyovers; however, the vertical under-clearance data is the best available source for information on column height. Vertical under-clearance is measured from the bottom of the superstructure to the top of the roadway or railroad surface below. Figure 6.14 shows the distribution for under-clearance data from NBI. From this figure, the under-clearance parameter appears to take on a bimodal distribution. As shown in Figure 6.14, the most prominent mode is at an under-clearance value of about 17 feet, and the second mode is around 23 feet. The average under-clearance is 17.7 feet with a standard deviation of 3.5 feet. For all bridge classes, under-clearance was sampled from the same distribution. For modeling purposes, the actual column height, not the under-clearance measurement, is needed. Column height is calculated by subtracting the depth of the bent cap from the under-clearance
119
value. Therefore, column height was customized to each bridge class by using a typical bent cap depth that is specific to each class as described in Section 6.4.3.1. 0.35
0.3
Probability
0.25
0.2
0.15
0.1
0.05
0 10
12
14
16
18
20
22
24
26
28
30
Column Height (ft)
Figure 6.14: Histogram for vertical under-clearance
6.3.5. Skew Angle Skew angle is another geometric parameter that can greatly affect the seismic response of a bridge (Pottatheere and Renault 2008; Sullivan and Nielson 2010). As seen in Figure 6.15, skew angle is measured as the angle between the centerline of supports and a line perpendicular to the centerline of the roadway. In the NBI, skew angle is recorded based on structural plan drawings or a field measurement; however, for curved bridges or bridges where the skew angle varies, the average skew is recorded in NBI. In certain cases where there is a large variance in skew along the length of the bridge and cannot be accurately represented by an average value, a value of 99 is recorded to indicate this variation. For the purposes of this study, bridges with this large variance value (i.e., skew angle values of 99) have been excluded when determining class statistics.
Figure 6.15: Diagram depicting skew angle Small changes in skew angle do not have a significant effect on seismic response; therefore, instead of looking at the overall distribution of skew, it is more beneficial to look at certain ranges of skew angles (Nielson 2005). The four ranges of interest in this study are θ = 0°, 1° < θ 30° (%) 26.08 16.24 20.89 5.79 15.7 6.13 24.07
6.3.6. Year of Construction Year built is not a geometric parameter; however, it still is a parameter of significance when simulating seismic behavior. Knowing the year that a bridge was built can indirectly provide information on typical construction and detailing practices of the time, including material properties, girder and bent cross-section geometry, bearing details, standard reinforcement and bracing layouts, etc. Table 6.8 shows the median year of construction and average age for each bridge class, and Figure 6.16 through Figure 6.18 show the distributions for year built. This inventory analysis shows that PC girders tend to be the most current design type, as the median year of construction is 1991 for the single span and 1989 for the multi-span types. MSSTEEL bridges tend to be the oldest construction, with a median year of construction of 1940. The year of construction for each bridge configuration is randomly generated based on its distributions shown in Figure 6.16 through Figure 6.18. Table 6.17 through Table 6.23 at the end of this chapter present the randomly generated year of construction for eight different configurations of each bridge class.
121
Table 6.8: Construction year statistics
Class
Median (year) Median age (in 2017)
MCSTEEL
1965
52
MSSTEEL
1940
77
MSPC
1989
28
MSRC
1966
51
SSPC
1994
23
MCRC-Slab
1958
59
MSRC-Slab
1952
65
0.5
0.5
0.45
0.45
0.4
0.4
0.35
0.35
0.3
Probability
Probability
0.3
0.25
0.2
0.25
0.2
0.15
0.15
0.1
0.1
0.05
0.05
0 1920
1940
1960
1980
2000
0 1920
2020
1940
0.45
0.45
0.4
0.4
0.35
0.35
0.3
0.3
0.25
0.2
2020
1980
2000
2020
0.2
0.15
0.1
0.1
0.05
0.05
1960
2000
0.25
0.15
1940
1980
b) MSRC 0.5
Probability
Probability
a) MSRC-Slab 0.5
0 1920
1960
Year Built
Year Built
1980
2000
2020
Year Built
0 1920
1940
1960
Year Built
c) MSPC
d) MSSTEEL
Figure 6.16: Histograms of construction year for multi-span simply supported bridge classes
122
0.5
0.45
0.4
0.4
0.35
0.35
0.3
0.3
Probability
Probability
0.5
0.45
0.25
0.2
0.25
0.2
0.15
0.15
0.1
0.1
0.05
0.05
0 1920
1940
1960
1980
2000
2020
0 1920
1940
1960
Year Built
1980
2000
2020
Year Built
a) MCRC-Slab
b) MCSTEEL
Figure 6.17: Histograms of construction year for multi-span continuous bridge types 0.5
0.45
0.4
0.35
Probability
0.3
0.25
0.2
0.15
0.1
0.05
0 1920
1940
1960
1980
2000
2020
Year Built
Figure 6.18: Histograms of construction year for single span bridge types
6.4. Bridge Components and Typical Details A highway bridge can be separated into three main components: the superstructure, the substructure, and the bearings as illustrated in Figure 6.19. Information on structural member layout, cross-sectional properties, and connection details for each of these main components are necessary for creating computational bridge models; however, such detailed information is not documented in the NBI or TxDOT bridge database. To determine typical structural component layout and cross-sectional parameters, information from TxDOT standards and as-built drawings of TxDOT bridges were compiled and synthesized in the following sections.
123
6.4.1. Material Properties Reinforced concrete is a common material used in bridge construction. Reinforced concrete is frequently used in foundations, bents, bridge decks, and other superstructure elements. In this study, the uncertainties in concrete compressive strength and steel reinforcement strength are considered explicitly. Bournonville et al. (2004) conducted a study looking at the properties of A615 grade 40 steel bars (fy = 40ksi, which are commonly used in pre 1990s TxDOT bridge construction) and found that the yield strength, fy, tends to follow a right skew distribution. Therefore, in this study, a lognormal distribution was chosen to model uncertainty of reinforcement yield strength. The median value and standard deviation for grade 40 reinforcing bars is 55,000 psi and 4,900 psi, respectively (Bournonville et al. 2004). Concrete compressive strength, f’c, is assumed to follow a normal distribution following the guidance of Unanwa and Mahan (2012). Concrete bridge construction dating back to the 1950s is expected to have lower bound or nominal compressive strengths between 3,000 psi and 5,000 psi. However, ASCE 41 (2014) suggests that expected strengths are closer to 1.5 times the lower bound. To capture a wide range of compressive strengths in this study, a median value of 4,500 psi is used, and again following guidance from Unanwa and Mahan (2012), a coefficient of variation of 0.19 is used to estimate a standard deviation of 850 psi.
6.4.2. Superstructure The superstructure consists of the roadway surface, the railings, and some type of structural system such as steel or concrete girders. As shown earlier, bridge superstructures can be made of a variety of different construction materials and various types of structural systems. This study specifically focuses on four different types of superstructure including steel girders, prestressed concrete girders, reinforced concrete girders, and reinforced concrete slabs, which are shown in Figure 6.19.
124
Figure 6.19: Bridge component classification for different bridge classes 6.4.2.1. Steel Girders Structural characteristics of the different superstructure types are necessary to accurately assign the stiffness and mass to the superstructure elements of a computational bridge model. Steel girders, for example, have different girder sections based on span length, girder spacing, and span continuity. Simply supported steel girder bridges with span length less than approximately 100 feet, are typically supported by standard rolled wide-flange, or W–shape, sections. Table 6.9 shows examples of steel beam sections allowed per the TxDOT standard drawings (TxDOT 2006) based on span length and roadway width. From this table, it is evident that there are a several different girders with varying section properties and weights that can be used for a given bridge geometry. Thus, a sampling technique is employed to select beam sizes and section properties that are representative of those that could be used for steel girders in the Texas bridge population. In the sampling process, the available girder sections were determined from the TxDOT standards based on span length, and then a single girder section was randomly selected for each geometric bridge sample. Table 6.10 shows the girders and the section properties used for each simply-supported steel bridge sample.
125
Table 6.9: Table of
required beam sizes (TxDOT 2015)
Table 6.10: Section properties of sampled girders for MSSTEEL configurations
Bridge Sample
Member
Depth (in)
Area (in2)
Ix(in4)
Iy(in4)
1
W24×104
24.06
30.7
3100
259
2
W18×130
19.25
38.3
2460
278
3
W30×191
30.68
56.1
9200
673
4
W21×122
21.68
35.9
2960
305
5
W30×173
30.44
50.9
8230
598
6
W27×146
27.38
43.2
5660
443
7
W30×173
30.44
50.9
8230
598
8
W36×135
35.55
39.9
7800
225
For MCSTEEL bridges with span lengths less than 100 feet, it was determined that, similar to their simply supported counterparts, are built using rolled wide flange sections. Therefore, the girder sections for continuous bridge samples with spans less 100 feet were selected using the same method as discussed for MSSTEEL bridges. However, continuous span construction is often used
126
to achieve longer span lengths than are practical with simply supported construction. This trend is depicted in the span length distributions shown in Section 6.3.2, where the average span length for the MSSTEEL bridge class is 48 feet, while the average for the MCSTEEL bridge class is 102 feet. MCSTEEL bridges with span length longer than 100 feet often require girder depths well beyond the available rolled wide-flange sections. In fact, design engineers typically use built-up Igirder sections for the longer span continuous girders. When built-up plate girders are designed, time and care is typically taken to determine an efficient plate girder design for each specific bridge to minimize the cost of material and fabrication. Consequently, TxDOT does not have a set of standard drawings for continuous steel girders, making it more challenging to determine typical section properties for the bridges in the multi span steel girder bridge class. One approach to obtaining properties for continuous steel girders is to conduct a full superstructure design following the TxDOT design manual for each bridge sample in this class. This approach, however, would be very time consuming, and may not reflect design practices representative of the era when much of the MCSTEEL bridges were constructed. However, design engineers often follow several “rules of thumb” to develop a preliminary section that can then be refined to fit to the design requirements. These “rules of thumb” assumed in this study are listed below: •
Span length (L)/girder depth (D) ≈ 32
•
Girder depth (D)/web thickness (tw) ≈ 137
•
Flange width (bf)/girder depth (D) ≈ 0.33
•
Flange width (bf)/(2*flange thickness (tf)) ≈ 9.2
In the design process, span length is often governed by predetermined site constraints. For example, the bridge needs to span a four-lane highway, a 120-foot waterway, or needs to avoid existing utility lines. Thus, span length can be used as the starting point in determining the girder depth. Once the girder depth is selected, the remaining guidelines help the designer determine the remaining properties of the girder section. Since these “rules of thumb” or guidelines are only intended to provide a preliminary girder section, it is expected that these particular parameters (e.g., L/D, D/tw, bf /D, and bf /(2*tf)) for the final girder design have some variation. To gain understanding of how much variation is expected, several as-built drawings for long span continuous steel girder bridges (span lengths ranging from 115 to 240 feet; TxDOT, 2007; TxDOT, 1975; TxDOT, 1971a; TxDOT, 1971b; TxDOT, 1965) were used to compare preliminary and final design parameters. Table 6.11 shows this comparison. This table verifies the variance in the final design, which should be considered in selecting accurate built-up girder sections. In this study, girder sections are selected using the linear regressions shown in Figure 6.20.
127
Table 6.11: MCSTEEL girder parameter comparison
Final Design
L (ft)
L/D
D/tw
bf/D
bf/2tf
115
30
123
0.26
8
140
28
160
0.23
9.33
150
30
137
0.30
12
150
33.33
123
0.26
9.33
240
30
170
0.21
10
32
137
0.33
9.2
Preliminary design
L: Span Length, D: girder depth, tw: web thickness, bf : flange width, tf : flange thickness 120
25
100
D = 0.3976L - 0.0103 bf (in)
80
D (in)
bf = 0.1479D - 6.2535
20
60
15
10 40 5
20
0
0 0
50
100
150
200
250
300
0
20
40
60
L (ft)
80
100
120
D (in)
Span Length vs. Girder Depth
Girder Depth vs. Flange Width
0.6
1.2
tw = 0.0036D - 0.2073 0.5
1
0.4
0.8
tf (in)
tw (in)
tf = 0.0256bf - 0.4028 0.3
0.6
0.2
0.4
0.1
0.2
0
0 0
20
40
60
80
100
120
D (in)
0
5
10
15
20
bf (in)
Girder Depth vs. Web Thickness Girder Depth vs. Flange Thickness Figure 6.20: Linear regressions of girder sections of MCSTEEL bridges
128
25
The section properties used for the MCSTEEL bridge samples, in this study, are show in Table 6.12. It should be noted that continuous steel girders often utilize flange cover plates or web stiffeners to increase section capacity at certain places along the length of the span (e.g., cover plates at the mid span and at interior supports, and web stiffeners at bearing locations). The section properties for MCSTEEL bridges used in this study neglect these additional components (e.g., cover plates, bearing stiffeners, and web stiffeners). Table 6.12: MC steel girder section properties
Bridge Sample 1 2 3 4 5 6 7 8
Depth (in) 38.2 38.7 31.6 46.0 38.2 58.0 35.9 96.0
Area (in2) 43.98 58.8 77 36.2 43.98 50.9 44.3 92.9
Ix(in4) 9800 14900 13100 12736 9800 27906 9040 129187
Iy(in4) 229 695 959 225 229 493 270 1335
In addition to knowing the size and type of girders used in a superstructure, it is also important to know the number and spacing of girders for determining mass and stiffness properties in the computational model. Review of TxDOT standard and as-built drawings for steel girder bridges showed that depending on the deck width, girder spacing is typically specified in 4-inch intervals with a lower and upper bound of 5 feet and 9 feet, respectively. To improve economy in the superstructure design, a design engineer commonly chooses to minimize the number of girders, while maintaining a reasonable girder spacing and a reasonable amount of overhang (e.g., the distance from the center line of exterior girder to the outside of the bridge deck, see Figure 6.21). This design process can lead to a variety of different girder spacings. For example, a bridge with a 26 feet deck width, as shown in Figure 6.21, can have four girders spaced at 7.33 feet and an overhang of 2 feet, four girders spaced at 7 feet with an overhang of 2.5 feet, three girders spaced at 9 feet with an overhang of 4 feet, and a variety of other combinations. After further investigation of standard and as-built drawings it was found that overhang distance ranges from 2 to 5 feet; however, it is evident that an overhang of approximately 2 to 3 feet is preferred. In this study, girder spacing for bridge models is selected from a range of 6 to 9 feet, at intervals of 4 inch, based on which spacing value produces an overhang closest to 2 feet. The number of girders and girder spacing for each bridge sample are presented in Appendix D.
129
Figure 6.21: Typical transvers superstructure cross-section (TxDOT 2004) 6.4.2.2. Prestressed Concrete Girders Determining the section properties and mass of prestressed concrete girder spans (MSPC bridge class) is relatively simple compared to the steel girder spans due to the limited number of prestressed concrete standard sections. Historically the American Association of State Highway and Transportation Officials (AASHTO) has provided standard prestressed sections to be used in highway bridge design. Most state departments of transportation have adopted and used the AASHTO standard sections; however, TxDOT is one of the few states that has developed and used their own standard sections. The overall shape of the two designs are similar; however, there are minor differences in the dimensions resulting in slightly different section properties. Figure 6.22 shows the generic shape and the dimensions of both the AASHTO girders (i.e., Type II, III, and IV) and the TxDOT girders (i.e., Type B, C, 54, and 72). It also should be noted that in 2008 TxDOT revised their prestressed girder sections to bulb-T sections (see Figure 6.22), which are used in new highway bridge construction. In this study, the section properties and mass of the MSPC bridge samples were selected from the old TxDOT sections if the construction year of the sample was prior to 2008 and from the new Tx girder sections for samples constructed after 2008. More specifically, after reviewing as-built drawings and standards for bridges constructed before 2008, it was determined that Type B girders are typically used for spans less than 70 feet, Type C girders for spans between 70 feet and 90 feet, and Type 72 girders for spans greater than 90 feet. Following TxDOT’s recommendations for the new Tx girders, Tx 40 girders were used for samples with spans less than or equal to 90 feet, and Tx 62 girders for spans larger than 90 feet.
130
The number and spacing of girders for prestressed girders follows the same procedure as that presented for steel girders. In fact, depending on the deck width, girder spacing is typically specified in 4-inch intervals with a lower and upper bound of 5 feet and 9 feet, respectively. The number of girders and girder spacing for each bridge sample are presented in Appendix D.
F (in) 12 16 20
G (in) 6 7 8
Beam Type A (in) B 18 C 22 54 16 72 22
AASHTO I-Girders B (in) C (in) D (in) E (in) 6 15 36 6 7 19 45 7 8 23 54 8 TxDOT I-Girders B (in) C (in) D (in) E (in) 6 14 34 4 7 16 40 6 8 32 54 4 11 40.5 72 5.5
F (in) 12 14 16 22
G (in) 6.5 7 6 7
Beam Type A (in) Tx 28 32 Tx 34 32 Tx 40 32 Tx 46 32 Tx 54 32 Tx 62 32 Tx 70 32
Tx Girders (TxDOT Bulb-T) B (in) C (in) D (in) E (in) 6.75 9 28 3.5 6.75 12 34 3.5 6.75 18 40 3.5 8.75 22 46 3.5 8.75 30 54 3.5 8.75 37.5 62 3.5 8.75 45.5 70 3.5
F (in) 36 36 36 36 36 42 42
G (in) 7 7 7 7 7 7 7
Beam Type A (in) II 18 III 22 IV 26
TxDOT and AASHTO prior 2008
TxDOT Bulb – T girders Figure 6.22: PC girder sections 6.4.2.3. Reinforced Concrete Girders Reinforced concrete girder bridges (MSRC class), also known as pan formed girders, are a style of cast-in-place concrete superstructure that was most commonly employed in the 1960s and 1970s. Figure 6.23a shows a standard RC girder cross-section typically used in Texas. In this figure, the superstructure depth is shown as 24 inches; however, TxDOT does have a 33-inch RC girder section as well. Following the guidance of the as-built and standard drawings, the 24-inch section depth is assumed for span lengths less than 40 feet, while the 33-inch depth is assumed for spans of 40 feet and longer. To simplify calculations section properties for the RC pan girder in the computational models (described in more detail in Chapter 7 of this report), the cross-section was transformed into a Tsection with equal cross-sectional area and similar moments of inertia to ensure an accurate representation of the RC girder mass and stiffness. Figure 6.23b shows an example of the transformed section used to calculate section properties. Reinforced concrete girder bridges are built using standard sections, as shown in Figure 6.23a, which are designed with a standard girder spacing of 3 feet and a 1 feet overhang. In this study,
131
girder spacings for the RC girder bridge samples are assumed to be 3 feet, and the number of girders is determined resulting in an overhang as close to 1 foot as possible.
(a) Typical Half Transverse section (TxDOT 2005)
(b) Transformed T-section Figure 6.23: RC girder standard section 6.4.2.4. Reinforced Concrete Slabs The last superstructure bridge class is the RC slab class, in which the structural system comprises either a cast-in-place reinforced concrete slab or pre-cast reinforced concrete slab panels. In Texas, the RC slab superstructure was most popular in the early to mid-1900s (e.g., 1930s-1970s). This slab superstructure type can be constructed as either simply supported or continuous spans and is typically used in structures requiring much shorter span lengths. For instance, it is used in simply supported spans of approximately 25 feet, and continuous spans of approximately 35 to 40 feet. Current TxDOT standard drawings and standards from the 1980s and 1990s indicate that in modern construction, MSRC-slab bridges are specified to have a 16-inch thick slab, whereas MCRC-slab bridges have 14-inch thick slabs for span lengths less than 30 feet and 16-inch thick slabs for spans greater than or equal to 30 feet. However, as-built drawings from RC slab bridges 132
constructed prior to the 1980s indicate that MSRC-slab bridges from this era were typically built with 12-inch slabs, and MCRC-slab bridges were typically built with either a 12-inch or 14-inch slab. Based on the typical age of RC slab bridges in the Texas bridge population, in this study, the MSRC-slab bridges are assumed to have a 12-inch slab, and the MCRC-slab bridges are assumed to have a 12-inch slab for spans less than 30 feet and a 14-inch slab for spans greater than or equal to 30 feet. 6.4.2.5. Bridge Deck and Railings In addition to the girders themselves, the concrete bridge deck and railings also contribute significantly to the superstructure mass and stiffness. In steel girder construction, it is common to have composite slabs (i.e., shear studs connecting the girders and concrete slab), in which part of the slab contributes to the flexural stiffness of the superstructure. Past fragility studies such as Nielson (2005) and Pan et al. (2010) have considered composite construction for steel girder classes, i.e., MCSTEEL and MSSTEEL classes; however, TxDOT did not adopt composite construction until the mid to late 1980s, while the majority of the steel bridges in Texas were built between the 1940s and 1970s. Therefore, this study does not consider any contribution from the bridge deck in determination of the girder flexural stiffness. In terms of superstructure mass, however, the bridge deck does have a big contribution. The current TxDOT standards for the MSSTEEL bridge class requires an 8-inch bridge deck; however, a 7.25-inch deck was commonly found in the as-built drawings from bridges built in the 1930s to1950s. The MSPC girder class has similar variation in deck thickness as the current standard specifies an 8.5-inch deck, while the as-built drawings indicate that a 7.25 to 8-inch deck is typical for bridges built in the 1960s to 1990s. Due to these variations in deck thickness observed in as-built drawings and limited information regarding deck detailing for the entire bridge population, the bridge deck for both the MSSTEEL and MSPC classes are assumed to be 8 inches thick. The typical deck thickness for the MCSTEEL bridge class is assumed to be 6.5 inches based on as-built drawings from the 1940s to 1970s, which were used in this study. For the MSRC and MSRC-slab bridge classes, the bridge deck is part of the structural system; thus, no additional mass or stiffness from the bridge deck is considered in the model. Bridge railings, i.e., traffic barriers placed along the edge of the bridge deck, certainly contribute to superstructure mass; however, the weight of the barrier is a relatively small percentage (i.e., approximately 4 to 5%) of the total weight of the superstructure. TxDOT has a variety of different sizes and shapes of railings in their standard drawings. Determining a typical size and shape for railings of a specific bridge class is difficult, as railings are specified by roadway type and traffic demands. Due to the uncertainty in railing type and design, the railing mass is not explicitly considered in this study; however, the increased superstructure mass due to railings were considered through a mass factor applied to the entire superstructure mass. In fact, Following the guidance of Ramanathan (2012), this mass factor is assumed to follow a uniform distribution with bounds of 110% to 140% of superstructure mass calculated from given geometries and material densities. The railings are assumed to have no effect on the superstructure stiffness.
133
Moreover, deck gaps are used in bridge design to allow for expansion and contraction of the superstructure. These gaps can be found at designated expansion joints at both the abutments and interior bents. Temperature variations as well as construction imperfections can create large uncertainties in the expansion gaps; hence, it is important to account for this in the modeling process. Expansion joint details vary between the bridge classes and are typically selected based on the expected thermal movement and any anticipated shortening. Common types of joints include poured sealant and neoprene compression sealant, which are common in RC slab and RC girder construction, and armor joint and sealed expansion joints, which are common in PC girder and steel girder construction. Following the study by Ramanathan (2012), the gaps at both the abutments and interior bents are assumed to follow a uniform distribution, with two sampling ranges for small and large gaps. Looking through the TxDOT standards and as-built drawings, it was observed that the poured sealant, neoprene sealant, and the armored expansion joints have a much smaller movement range than their sealed expansion joint counterpart.
6.4.3. Substructure The substructure (i.e., bridge bents, columns, foundation, and abutments) supports the superstructure. Unlike the superstructure, the substructure is expected to see highly nonlinear behavior during a seismic event, requiring a more complex computational model to accurately capture these behaviors and potential failure modes. Computational modeling techniques and specific details regarding modeling are found in Chapter 7, while the following sections focus on TxDOT typical details used to develop the substructure models used in this study. As mentioned earlier, the NBI does not provide substructure information; however, with the help of TxDOT the research team was able to obtain and analyze substructure type data from TxDOT’s in-house bridge database. The information found in this database is split into three parts: the above ground substructure (i.e., bridge bent or column), the below ground substructure (i.e., foundation), and type of bent cap. Each of these three substructure components must be determined to model bridges and simulate seismic behavior. 6.4.3.1. Bridge Bents The above ground substructure includes the intermediate supports along the length of a bridge, which are often referred to as bridge bents or piers. Piers are usually comprised of a single support (e.g., single column or pier wall), while bents are typically comprised of multiple supports such as multiple columns or piles. There are a number of different bent types used in bridges, such as hammer-head bents, wall bents, and multi-column bents. In general, the above ground substructure, i.e., bridge bents, can take on one of the following nine configurations: pile bents, single column bents, multiple column bents, concrete column bent with tie beam, concrete column bent wall, concrete pier, masonry pier, trestle (steel, concrete, or timber), or other. Figure 6.24 shows the probability of occurrence of each above ground substructure type for each individual bridge class Based on the substructure information gathered from TxDOT’s bridge database. This figure reveals that the overwhelming majority of PC girder bridges (i.e., MSPC and SSPC), as well as the MCSTEEL bridges are supported by multiple column bents. The remaining four bridge
134
classes (i.e., MSRC-Slab, MSRC, MSSTEEL, and MCRC-Slab) are split between pile bents and multiple column bents. The MSRC and MCRC-Slab classes are split almost evenly with 49% and 42%, respectively, for pile bents, and 48% and 53%, respectively, for multiple column bents. The MSRC-Slab class tends to more commonly employ pile bents with 63%; however, the MSRCSlab class still has a significant percentage with multiple column bents as well, with 30%. For this reason, multiple column bents are assumed as the above ground substructure for the generalized computational bridge models in this study. 1
MSRC-Slab MCRC-Slab
0.9
MSRC MSPC 0.8
SSPC
0.7
MCSTEEL
MSSTEEL
Probability
0.6
0.5
0.4
0.3
0.2
0.1
0
Pile
Single
Multiple
Concrete
Concrete
column
column
tie-beam
wall
Concrete pier
Masonry
Trestle
Other
pier
Figure 6.24: Histogram for types of above ground substructure As discussed above, it was determined that the majority of bridges in Texas have either multicolumn or pile bents. Multi-column bents are predominantly built with cylindrical reinforced concrete columns, while pile bents can be built using either steel H-pile or concrete piles (either reinforced or prestress concrete). Bridge bents with either concrete columns or piles are constructed with a reinforced concrete bent cap, while steel pile bents have either reinforced concrete or steel caps. TxDOT recognizes four bent cap materials in their inventory database: concrete, steel, timber, and masonry. Figure 6.25 represent a schematic view of the typical configuration of multi-column bents. The bent cap distributes the load from the superstructure to the individual columns, which are attached to the pile or drilled shaft foundation.
135
Figure 6.25: Multi-column bent (Nielson 2005) Figure 6.26 shows the distribution of types of bent caps among the seven bridge classes. This figure shows that even though TxDOT uses four different bent cap materials, the overwhelming majority of bridges employ concrete bent caps. For all seven bridge classes the probability of having a concrete bent cap is greater than 90%. As seen in Figure 6.26, reinforced concrete bent caps are by far the most prominent in the Texas bridge inventory. 1 MSRC-Slab MCRC-Slab
0.9
MSRC MSPC
0.8
SSPC MSSTEEL
0.7
MCSTEEL
Probability
0.6
0.5
0.4
0.3
0.2
0.1
0 Concrete
Steel
Timber
Masonry
Other
Figure 6.26: Histogram for types of bent caps To model the behavior of a bridge bent, it is important to know typical member sizes and details for both the columns and bent caps. Bent caps are typically much stiffer than the columns below them and are often assumed to remain elastic for seismic analysis. Thus, the basic geometry, i.e., depth and width, of a typical bent cap is all that is needed to calculate section properties and mass for the modeling process. As seen in Figure 6.27, concrete bent caps used in Texas typically have
136
a square or rectangular cross-section; however, the dimensions may vary between the different bridge classes and are typically governed by span length and column diameter.
Figure 6.27: Typical bridge bent, and bent cap detail (TxDOT 1962) The bent cap dimensions for each bridge class are generally based on a combination of as-built drawings from the 1930s to 1990s, TxDOT standard drawings from the 1980s to 1990s, as well as current TxDOT standard drawings. The different dimensions of the bent caps that are used in this study are listed in Table 6.13. Table 6.13: Bent
cap dimensions per bridge class Bent Cap Dimensions
Bridge Class
Width
Depth
MCSTEEL
2.5
3
MSSTEEL
3
3
MSPC (Circa 2008)
2.75
2.75
MSPC (2009–Present) MSRC
3.5* 2
3.5* 2.5
2
2.5
MCRC-Slab
MSRC-Slab 2 2.5 Note: for span lengths > 100 ft, the width and depth should be 4 ft.
137
6.4.3.2. Columns Columns contribute significantly to seismic vulnerability and are expected to experience highly nonlinear behavior when subjected to large seismic demands. To capture this nonlinear behavior in the modeling process, it is important to simulate the flexural and shear strength of the reinforced concrete column section, as well as potential longitudinal reinforcement development length and splicing failure modes. See Chapter 7 for details on simulating these failure modes. The flexural and shear strength of a cylindrical concrete column is directly related to the cross-sectional dimensions and the reinforcing layout. Investigation of TxDOT standard drawings and as-built bridge drawings from the 1930s to 2000s indicated that TxDOT multi-column bents have historically utilized either 30-inch diameter or 24inch diameter columns. However, since approximately 2008, TxDOT has started specifying 36inch and 42-inch columns for the new PC girder bridges (TxDOT 2017). Among the two main column sizes, i.e., 30-inch diameter and 24-inch diameter, there are minor differences in the reinforcing details; however, they do follow some general trends. For example, it is standard for all columns to have a #3 spiral reinforcing cage with a 6-inch pitch along the entire length of the column. Longitudinal bars are typically detailed to extend straight into bent caps and foundations without any 90-degree hooks. Figure 6.28 shows typical reinforcing details for both a 30-inch and 24-inch diameter columns. It should be noted that Texas bridges, in general, have different column sizes and reinforcing details than bridges considered in previous CEUS studies. Past seismic vulnerability studies focusing on the CEUS (Choi 2002; Nielson 2005) used 30-inch and 36-inch diameter columns with transverse reinforcement at 12-inch spacing. Like the current study, these past studies assume similar details for the column-to-bent cap and column-to-foundation joints, where longitudinal bars extend straight through the joint. This type of joint reinforcement detailing without any 90-degree hooks is consistent with detailing used in low seismic hazard regions such as Texas and the CEUS, whereas 90-degree hooks are more commonly employed in moderate and high seismic regions. The specific column sizes and details used for each bridge class are found in Table 6.14.
138
(a)
(b)
Figure 6.28: Typical column cross-section and details (TxDOT 1962) for (a) 30-inch diameter and (b) 24-inch diameter (TxDOT 1970) columns Table 6.14: Column properties and reinforcing details for column with different sizes
Diameter (in)
24
30
36
42
Number of longitudinal bars
8
8
10
14
Equal
Equal
Equal
Equal
#7
#9
#9
#9
Spiral
Spiral
Spiral
Spiral
Transverse spacing/pitch (in)
6
6
6
6
Transverse bar size
#3
#3
#4
#4
Cover (to center of trans. bar) (in)
2.25
2.25
3
3
Reinforcement coating
None
None
None
None
2
2.25
2.75
2.75
2.25
3
4.5
4.5
Longitudinal spacing (equal, or inches) Longitudinal bar size Transverse type (spiral, tie)
Embedment length-Cap (ft) Embedment length-drilled shaft (ft)
Column diameter is typically governed by span length and, in some cases, year of construction. For MSPC bridge class, bridge samples with span lengths less than 100 feet and constructed prior to 2009 are assumed to have 30-inch diameter columns, while bridge samples constructed in 2009 or later and have spans less than 100 feet are assumed to have 36-inch diameter columns. If a MSPC bridge sample has a span length longer than 100 feet, a 42-inch diameter column is used regardless of when the bridge was constructed. Again, this was determined through review of current TxDOT standards and as-built drawings for PC girder bridges built in the 1960s through early 2000s. For the MSSTEEL and MCSTEEL bridges, column sizes are governed solely by span 139
length. In fact, if a bridge sample has span length less than 100 feet, it is assumed to have 30-inch diameter columns, or if the span length is greater than 100 feet, 42-inch diameter columns are used. The reinforced concrete girder and slab bridges, on average, have much shorter span lengths (e.g., average span lengths of 34 feet and 23 feet, respectively) requiring much lower column demands. For these bridge classes, i.e., MSRC, MCRC-Slab, and MSRC-Slab, it assumed that all bridge samples utilize 24-inch diameter columns. The number and spacing of columns also has a big influence on overall bent behavior under lateral loads. Determining a standard column number and spacing for all bridge classes and samples is not a trivial task, as these parameters vary with deck width and design details, including slab overhang, and column inset from end of bent cap. By studying standard and as-built drawings; however, one can identify common trends—such as max spacing, minimum spacing, and spacing intervals—that can be used to develop a standard procedure for determining number of columns and column spacing for a generic multi-column bridge bent in this study. For example, in this study, it was determined that column-to-column spacing is typically between 7 feet and 16.5 feet, typically specified at 6-inch intervals. The next step in determining column spacing of a generic multi-column bent is to find a relationship between deck width, length of the bent cap, and distance from edge of cap to the first column. Again, typical standard and as-built drawings indicated that for RC-Slab and MSRC classes, the length of the bent cap is the same as the deck width, while other classes have some variability in cap length. However, the bent cap was generally found to be 2 feet shorter than the width of the superstructure. Typically, in multi-column bents, as shown in Figure 6.27, there is a certain amount of column inset, indicating the bent cap extends beyond the outside columns. An estimation of this typical column inset is necessary to determine the number of columns and overall multi-column bent layout. In as-built and standard drawings, this column inset dimension, i.e., the distance from edge of bent cap to center of outside column, varies significantly, as this distance is typically varied in order to optimize column spacing. Nonetheless, knowing the upper and lower limits as well as a typical value for column inset inform the bent layout for sampled bridges. Based on bent dimensions found in drawings, a lower limit of 2 feet, an upper limit of 6 feet, and a typical value of 4 feet are assumed for the column inset dimension used to determine the column spacing and layout within a bent. In summary, the process of determining the number of columns and column spacing in a multicolumn bent relies on: the deck width, the width of the bent cap, and the typical column inset. The process is iterative and is as follows: Subtract 10 feet from the sampled deck width to get the center-to-center distance between outside columns (i.e., subtract 2 feet to get width of cap, and 8 feet to account for column inset on either side of cap). Then, divide this value in half (which initially assumes three columns per bent) to get an initial column spacing estimate. If the initial spacing is larger than 16.5 feet, columns are added until the spacing is adequate (i.e., less than 16.5 feet). The final step is to round the column spacing to the nearest 6-inch interval (e.g., a 12.23 foot spacing would be rounded to 12 feet, and a 12.36 foot spacing would be rounded to 12.5 feet). The number of columns and column spacing for each of the bridge samples used in this study are found in Appendix D.
140
6.4.3.3. Foundations Foundations are considered as the below ground portion of the substructure, which transfers the structural loads to the surrounding soil or rock. Foundations can take on a variety of different configurations depending on the loading demands, soil type, and other site-specific constraints such as superstructure type, overhead clearances, existing utilities, and so on. The below ground substructure, just like its above ground counterpart, is split into nine different types in the TxDOT bridge inventory data. These foundation types are steel piling, concrete piling, timber piling, drilled shafts, spread footings, pile cap on steel piling, pile cap on concrete piling, pile cap on timber piling, and other. Figure 6.29 shows the distribution of foundation types among the seven bridge classes. Below ground substructure seems to be more varied between different types than the above ground substructure; however, the PC Girder classes (i.e., MSPC and SSPC) and the MCSTEEL class again tend to have one substructure type, with 83%, 86%, and 73%, respectively, of bridges in these classes having drilled shaft foundations. The MCRC-Slab and MSRC classes tend to have drilled shafts and concrete pilings, while the MSRC-Slab and MSSTEEL classes are distributed between drilled shafts, concrete piling, spread footings, and steel piling. 1
MSRC-Slab MCRC-Slab
0.9
MSRC MSPC 0.8
SSPC MSSTEEL MCSTEEL
0.7
Probability
0.6
0.5
0.4
0.3
0.2
0.1
0
Steel
Concrete
Timber
piling
piling
piling
Drilled
Spread
Cap on steel
Cap on concrete
Cap on timber
Other
Figure 6.29: Histogram for types of below-ground substructure In general, the following foundation systems are the most common in Texas: integrated pile/column (i.e., drilled shafts or pile), spread footings, or pile footings. Figure 6.30 shows examples of these foundations systems. Spread footings (Figure 6.30a) are considered shallow foundations and are typically used in locations where firm soil or rocky conditions are found at relatively shallow depths.
141
Pile supported foundations typically consist of either driven steel H-pile, precast (reinforced or prestressed) concrete pile, or cast in drilled holes (CIDH) connected with a concrete pile cap. In certain cases, the pile cap can be continuous along all columns in a bent (e.g., a strip footing), but more commonly each column has an individual pile footing (Figure 6.30d/e). Regardless of the pile type, it is important to have adequate embedment into the pile to ensure the proper force transfer. Pile footings, shown in Figure 6.30d/e, are typically considered deep foundations. Integrated column/pile, shown in Figure 6.30b and c, are referred to as an integral column/shaft. The integral shaft or integral pile foundations are the most common and are considered as the prominent foundation types in this study. As shown in Figure 6.30b, when subjected to lateral loading, the critical section or plastic hinge region of an integral shaft foundation consisting of the same diameter column is below the ground line. The plastic hinge typically forms at a depth of about twice the pile diameter below the surface (Priestley et al. 1996), which makes it difficult to identify during a post-earthquake inspection. The integral shaft foundations with an oversized shaft, shown in Figure 6.30c, have an increase in stiffness at the shaft-column joint, forcing the plastic hinge to form at the base of the column, which is typically at or above the ground line. This case of damage above the soil surface is much easier to identify during a visual inspection. Both of these drilled shaft types are used in Texas. According to the TxDOT Geotechnical Design Manual (TxDOT, 2012), drilled shafts are most economical in competent soil or rock, while the pile foundations are best suited for softer soils. Moreover, based on the substructure distribution for Texas bridges (Figure 6.29), it is here assumed that MSRC and MSSTEEL bridge classes consist of pile foundations, while drilled shaft foundations are assumed for the remaining bridge classes (i.e., MSPC, SSPC, MSRC-Slab, MCRC-Slab, and MCSTEEL). Based on the database available for Texas, it is concluded that approximately 80% of bridges with pile foundations utilize concrete piles. Concrete piles are either plain reinforced or prestressed square piles ranging in size from 16 inches up to 24 inches. When steel piles are used, TxDOT standards typically specify the use of HP14, 16, or 18. For drilled shaft foundations, TxDOT standard drawings show details for drilled shafts with diameters from 18 inches up to 48 inches. Due to insufficient data regarding actual shaft diameters, this study assumes the shaft diameters of sample bridges are the same size as the columns specified above.
142
(a) Spread footing (TxDOT, 1939)
(b) Integral pile/column (Ramanathan, 2012)
(c) Integral pile/column (oversized pile) (Ramanathan, 2012)
(d) Pile footing, as adopted from TxDOT (e) Pile footing, as adopted from TxDOT (1962) (2015) Figure 6.30: Typical foundation systems To model the foundation, which is discussed in Chapter 7, two main parameters should be determined as: number of piles per footing and stiffness of the foundation. First, the number of piles per footing is addressed. Based on thorough review of TxDOT design standards and as-built
143
drawings, typical footings consist of three to five piles per column. For the purpose of this study, a footing supported by four piles per column (Figure 6.30d) is chosen as the basis for modeling. Second, translational stiffness of the foundation is addressed. For footings, due to the lack of data on relevant foundation testing data in Texas, the Caltrans (1999) recommendation on the foundation stiffness is utilized in this study. Caltrans (1999) suggests a constant initial stiffness for of 40 kip/inch for a pile regardless of pile material or geometry. To take into account the uncertainty, this parameter is modeled as a random variable with uniform distribution with median of 40 kip/inch, as well as lower and upper bounds of 20 kip/inch per pile and 75 kip/inch per pile, respectively. Therefore, a translational foundation stiffness ranging between 80 kip/inch and 300 kip/inch in both the transverse and longitudinal direction can be considered for the four-pile group foundation in Texas. For drilled shafts, the stiffness of the foundation is computed based on the diameter of the foundation. The following paragraphs discuss how to correlate shaft diameter to foundation stiffness for modeling purposes. Ramanathan (2012) performed an analysis on a variety of drilled shaft/pile systems and soil profiles using the software called LPILE, which is a program used for the analysis and design of piles and drilled shafts under lateral loads. Ramanathan (2012) determined that the translational stiffness of an integral column and shaft/pile is linearly related to the diameter of the shaft/pile (see Table 6.15 and Figure 6.31). Following the linear relationship shown in Figure 6.31 and using a typical shaft diameter found in Texas (e.g., 30-inch dia. for the MSPC girder bridge class), a median translational stiffness for an integral column and shaft/pile was found to be 173 kip/inch. Comparing this stiffness to a four-pile group foundation with a median pile stiffness of 40 kip/inch per pile (i.e., 160 kip/inch translational foundation stiffness for the four-pile group), it is evident that the four-pile group foundation and the 30-inch diameter integral column/shaft foundation have similar stiffnesses. For the case of simplicity, in this study, the translational foundation stiffness for drilled shaft foundations is determined by the sampled value of initial pile stiffness (i.e., 20 kip/inch/pile to 75 kip/inch/pile) multiplied by a relevant coefficient that is determined based on the relationship between shaft diameter and equivalent pile group. For example, a 24-inch shaft is assumed to have a stiffness equivalent to that of 3 piles (median of 120 kip/inch), a 30-inch diameter shaft has a stiffness equivalent to 4 piles (median of 160 kip/inch), a 36-inch shaft has a stiffness equivalent to 6 piles (median of 240 kip/inch), and a 42-inch shaft has a stiffness equivalent to 8 piles (median of 320 kip/inch). In summary, where pile foundations are used, it was assumed that four piles were used per column, and where drilled shafts are used, the shaft diameter was correlated to an equivalent stiffness of a pile group as mentioned above.
144
Table 6.15: Translation foundation stiffness (Ramanathan 2012)
Foundation Type 16 in intergral pile column 6 ft dia. Drilled shaft 8 ft dia. Drilled shaft
Translational stiffness (kip/in) 30 600 900
1000
Lateral Stiffness (kip/in)
900 800
y = 10.752x - 149.43
700 600 500 400 300 200 100 0 0
20
40
60
80
100
120
Shaft Diameter (in)
Figure 6.31: Translational foundation stiffness vs. shaft/pile diameter 6.4.3.4. Abutments Abutments are a component of the substructure that can have multiple functions. First, abutments are the end bridge bents that provide the vertical and horizontal support for the superstructure. Abutments can also provide soil retention at grade separations. Lastly, abutments provide the link between the superstructure and the roadway approach. There are a variety of different types and designs of abutments; however, they can be broken down into two main categories, seat type and integral abutments. Seat type abutments, as shown in Figure 6.32, act like a bent cap where the superstructure rests on the bridge seat allowing movement independent from the abutment. However, integral abutments, as shown in Figure 6.33, are built monolithically with the superstructure. Integral abutments tend to provide a much stiffer structure and help prevent unseating of the superstructure during a seismic event (Ramanathan 2012). Following an in-depth review of TxDOT standard and as-built drawings, it was concluded that seat type abutments, and more specifically pile-bent-type abutments, shown in Figure 6.32d, are the most common among Texas bridges.
145
Figure 6.32: Common seat type abutments (Nielson 2005)
Figure 6.33: Integral type abutment In addition to vertical gravity loads, abutments also experience horizontal loads during a seismic event. Two types of horizontal resistance are present during loading in the longitudinal direction as shown in Figure 6.34. The first one is a passive resistance, which is developed as the abutment backwall is pressed into the soil backfill. In this case, the resistance is provided by the soil and the shafts/piles. The other type is active resistance, which is developed from the shafts/piles when the
146
abutment pulls away from the backfill. The resistance in the transverse direction is provided by the shafts/piles and wing walls (Nielson 2005).
Vertical
Passive Active
Figure 6.34: Horizontal abutment behavior The active stiffness, as well as transverse resistance, is directly related to the number of piles (or shafts) in the abutment, which can act in either the longitudinal or transverse directions. Pile bent abutments can be constructed with either driven piles or drilled shafts. For ease of design and construction, abutment foundations typically utilize the same foundation type and layout as the interior bents. Therefore, the active abutment behavior for a specific bridge class is assumed to be the same as the foundation types discussed earlier. In fact, active abutment stiffness is equal to the translational foundation stiffness. For example, a MSPC bridge is modeled with an active abutment stiffness based on the diameter of the drilled shafts. A MSSTEEL bridge is modeled with an active abutment stiffness based on the stiffness of four piles per column location. The passive stiffness is provided by both the soil behind the abutment and the piles. The passive stiffness thus depends on both the number of piles and the size of the abutment (i.e., abutment height and width). Borzorgzadeh et al. (2007) suggested that the initial stiffness per unit length of a 5.5 feet tall abutment, ki, in the passive direction is 20 kip/inch per foot of abutment length; however, the abutment stiffness, kabut, can be adjusted proportionally to the backwall height as follows:
kip / in h ) × b × abut (6-1) ft 5.5 where, b is the width of the backwall and habut is the height of the abutment. Borzorgzadeh et al. (2007) also showed that the ki is dependent on other variables such as soil properties, vertical wall movement, and area of structural backfill. Due to insufficient data on the distribution of initial stiffness, this parameter is assumed to follow a uniform distribution between 20 kip/inch per foot of abutment length and 50 kip/inch per foot of abutment length based on recommendation from Caltrans (1999). The abutment width is considered to be the width of the bridge deck, while the height is considered as the summation of the depth of the bent cap, shown in Table 6.13, and the height of the backwall. Backwalls are intended to support the approach slab and retain soil, so they typically extend from the top of the bent cap to the bottom of the approach slab. Therefore, the kabut = ki (= 20.0
147
backwall height for prestressed concrete and steel girder bridges is determined by the depth of the girder plus the height of the bearing. For the reinforced concrete girder bridge class, the slab is actually part of the girder depth; therefore, the backwall height is 8 to 10 inches less than the total superstructure depth. Reinforced concrete slab bridges do not actually have a backwall as the approach slab typically rests directly on the bent cap.
6.4.4. Bearings The final component needed to develop a bridge model are the bearings. The bearings transfer loads from the superstructure to the substructure. These loads are mainly vertical live and dead loads, longitudinal and transverse loads, and material thermal expansion loading. During a seismic event, bridge bearings typically experience much larger demands than are considered for in-service conditions. In fact, during the earthquake, they experience significant longitudinal and transverse loadings, which can introduce structural vulnerability. Thus, it is important to accurately represent and capture bearing behavior in the modeling process. There are two main types of bearings used in this study: steel bearings and elastomeric bearings. When it comes to modeling bearing behavior, there are several parameters that requires attention: coefficient of friction (COF), stiffness, dowel strength (concrete bridges only), and dowel gap (concrete bridges only). All of these parameters are dependent on the material and configuration of the particular bearing, and are discussed in the following sections. 6.4.4.1. Steel Bearings Historically, steel bearings have most commonly been used in non-seismically detailed steel bridges. A typical steel bearing consists of a masonry plate on the bottom that is attached to the abutment or bent with anchor bolts, and a sole plate on the top that is attached to the underside of the girder. These types of bearings were prominent in steel girder bridge construction prior to the 1990s. There are two types of steel bearings: fixed bearings and expansion bearings. Fixed bearings are intended to transfer vertical and horizontal loading to the foundation while accommodating superstructure rotations relative to the substructure. Expansion bearings are intended to relieve material expansion forces by accommodating large relative longitudinal displacements, while also maintaining their vertical load carrying capacities and transferring transverse loading (Mander et al. 1996). In fact, fixed bearings are restrained in both the longitudinal and transverse directions, and expansion bearings are restrained only in the transverse direction. Figure 6.35 shows examples of fixed and expansion steel bearings. In simply supported spans, one can often find alternating fixed and expansion constraints. In continuous spans, the fixed type bearing is typically at the interior girder supports, while the expansion bearings are at the exterior girder supports.
148
Figure 6.35: Typical steel bearings (Mander et al. 1996) Steel bearing designs may vary in different areas of the country; however, most steel bearings have the same general geometry and main components. Figure 6.36 shows a typical high type rocker bearing used in Texas, which shows an example of these design variations when compared with the bearings in Figure 6.35. Due to the lack of experimental data and the similarities in the overall bearing designs, however, the Texas-specific bearings in this study, are assumed to follow the behavior of the steel bearings presented in the Mander et al. (1996) study, which are shown in Figure 6.35. Mander et al. (1996) conducted a study looking at the behavior of steel bearings under cyclic lateral loading and determined values for both COF and stiffness. They suggested that the COF, depending on the level of corrosion, varies from 0.2 to 0.6 for low-type sliding, and from 0.04 to 0.12 for high-type steel rocker bearings. The lower bound and upper bound of the suggested ranges represent clean to heavily corroded conditions. Moreover, Mander et al. (1996) suggested a mean value of 765 kip/in and 114 kip/in for initial stiffness of steel bearings in the longitudinal transverse directions, respectively. To take into account the uncertainty on the initial stiffness of steel bearings, it is assumed that this variable is a random variable with a uniform distribution with lower and upper bounds of 50% and 150% of the mean value (Nielson 2005).
149
Figure 6.36: Typical steel rocker bearing used in Texas These steel bearing types are susceptible to corrosion and deterioration. In addition, they can exhibit non-ductile behavior, such as toppling and bolt fracture. As a result, these types of bearings are known to be vulnerable to seismic loading (NCHRP, 1977). Consequently, steel bearings have been replaced with elastomeric type bearings for steel girder bridges in the current TxDOT standards for new steel girder bridge construction. However, studying the bridge class statistics, it is evident that the majority, i.e., 83%, of steel girder bridges, both simply supported and continuous steel girder bridges, were built between the 1930s and the 1970s. Therefore, in order to accurately capture the vulnerability of the existing steel girder bridge population, steel bearings were assumed to model the behavior of the MSSTEEL and MCSTEEL bridge classes. One thing that should be noted is that this study only considers the high type steel bearings. Due to lack of data on the bearings used in the entire Texas bridge population, it is not possible to determine which bridges use high type versus low type bearings. A thorough review of as-built drawings of Texas bridges from the 1930s to the 1970s, did however indicate that high type bearings were commonly employed in both steel bridge classes. 6.4.4.2. Elastomeric Bearing Elastomeric bearings are a very common bearing type used for prestressed concrete girder bridges. These types of bearings consist of an elastomeric rubber pad, with or without steel dowels that are anchored into the bent cap extending through the pad into the bottom of the girder. The elastomeric pad transfers horizontal loads through a frictional force at the interface with the concrete bent cap, while the dowels transfer load through beam type dowel action (Nielson 2005). As with steel bearings, elastomeric bearings also have both a fixed type and expansion-type bearings. To relieve material expansion forces through longitudinal movement, elastomeric expansion bearings are equipped with slotted holes in the rubber pad and in the bottom of the concrete girder such that bearings accommodate translation in the longitudinal direction without engaging the dowel. Figure 6.37 shows the typical configuration for an elastomeric bearing.
150
Figure 6.37: Typical elastomeric bearing (TxDOT 2017) During an earthquake event, it is possible for an elastomeric bearing to undergo deformation in the rubber pad, displacement due to sliding, deformation in the steel dowel, or a combination of all three. To model these behaviors, it is important to understand the bearing material and geometry. For example, deformation in the elastomeric pad is directly related to the stiffness of the elastomer, as well as the surface area and the thickness of the pad. Initial stiffness of the elastomeric bearing can be estimated using the following equation:
GA (6-2) hr where, G is shear modulus of the elastomer; A is area of pad; and hr is thickness of the pad. Past studies have shown that variability in G has a strong correlation with the variability in hardness of the elastomer. For instance, the elastomer experiences an increase in hardness with age as it is exposed to external elements (Mtenga 2007). AASHTO Design specifications (2016) implies that G ranges from 0.66 MPa (96 psi) to 2.07 MPa (300 psi); however, there is insufficient information on the actual distribution within this range. Thus, in this study, G is assumed to have a uniform distribution between the AASHTO-specified limits. Pad area and thickness vary with girder dimensions and span length. Current TxDOT standards specify elastomeric pad dimensions as 8inch by 21-inch for Tx28 through Tx54 girders, and 9-inch by 21-inch pad dimensions for Tx62 and Tx70 girders with a minimum pad thickness of approximately 2.75 inches. Review of as-built drawings revealed that bearing pads for older PC girders have a standard width of 6-inches, a length that is 2 to 3 inches shorter than the flange width, and a minimum thickness of 0.75-inch for bridges with spans up to 60 feet then increasing by 1/8 inch for every additional 10 feet in span length. Therefore, the pad area and pad thickness parameters were deterministically selected from standard bearing details from the corresponding era of construction. k0 =
Displacement due to sliding also depends on the surface area of the bearing pad, as well as the coefficient of friction (COF), the weight of the superstructure, and the gap between the dowel and the hole in the pad. For elastomeric bearings, the mean of COF for elastomeric pads are computed as follows:
151
0.4 (6-3) σm where µ is the mean of COF. As seen, µ is a function of the normal stress, σm, on the bearing. The σm and µ are calculated based on the associated gravity loads acting on each specific bearing. To account for uncertainty in the COF, a multiplication factor is applied to the computed COF. The multiplication factor is assumed to follow a lognormal distribution with a mean of zero and a standard deviation of 0.1 (Ramanathan 2012). = µ 0.05 +
Deformation in the steel dowel is directly related to the size of the dowel and the strength of the dowel. To accurately capture the full behavior of an elastomeric bearing, the dowel strength and the gap between the dowel and the slotted hole in the bottom of the girder must be considered. During a seismic event, it is possible that the dowel could experience significant inelastic deformations. Following the guidance of Choi (2002), it is assumed that the ultimate strength of the dowel is directly related to the ultimate strength of the steel. Attempting to better understand the behavior of dowels in an earthquake event, Choi (2002) developed a finite element model of a typical dowel (i.e., a 1 inch diameter dowel that projected 3 inches into the bottom of the girder). Choi (2002) found that the ultimate lateral strength of this typical dowel was approximately 58kN (13 kips). However, if a different size dowel is used, the strength is assumed to be quadratically proportional. This relationship is owing to the fact that the strength scales according to the crosssectional area ratio between the two dowels. In Texas, it is common to use a 1.25 inch diameter dowel (as opposed to the 1 inch diameter dowels in the Choi (2002) study); therefore, in this study, it is assumed that the average ultimate lateral strength is 20 kips. To account for variation, the dowel strength is assumed to follow a lognormal distribution with a mean value of 20 kips and a coefficient of variation (COV) of 0.08. Accounting for the fact that the dowel is not sitting perfectly in the middle of the slotted holes in the girders (i.e., slotted holes only at expansion bearings), it is important to capture the variations in the dowel gap in the model. Thus, in this study, it is assumed that dowel gap varies uniformly between 0 and 2.75 inches based on the maximum length of slot in the bottom of the girder minus the dowel diameter, i.e., a 4-inch slot and 1.25-inch dowel. One additional note that should be mentioned is the TxDOT current standards for elastomeric bearing pads utilize thin layers of steel shims embedded within the elastomeric pad to increase the vertical stiffness and durability of the pad. Based on observations during review of as-built drawings and the age of PC girder bridges considered in this study, this type of bearing with steel shims was not determined to be representative of the existing Texas highway bridge inventory and, therefore, is not used in this study. 6.4.4.3. Alternative Concrete Bearing In certain regions of the US, elastomeric bearings are the bearing of choice for any concrete superstructure such as PC I-girders, PC box-girders, RC slabs, and RC girders (Nielson 2005). For instance, Nielson (2005) determined that these types of bridges in the CEUS utilize elastomeric bearings. Nonetheless, in Texas, the RC girder and slab bridge classes do not typically utilize elastomeric bearings, predominantly due to the cast in place construction used for these
152
superstructure types. TxDOT does have some precast slab and beam type bridges in their system that utilize elastomeric bearings; however, this type of superstructure and bearing configuration is more typical of modern construction and was not found to be representative of the RC superstructures considered in this study, which were typically built between the 1920s and 1990s. Careful review of standard and as-built drawings was necessary to determine typical bearing details for RC girder and RC slab superstructure types. Figure 6.38 shows an example of the alternative concrete bearings used for RC girder and slab construction in Texas.
(a) RC slab (TxDOT, 1955)
(b) RC girder (TxDOT, 1966) Figure 6.38: RC girder and slab bearing details As with both the steel and elastomeric bearings, Figure 6.38 shows both fixed and expansion type bearings for RC girder and slab superstructures. For the expansion type bearings, it is common to coat the bridge seat with some kind of lubricant such as 60 grade oil or powdered graphite, and then utilize a thin material barrier such as roofing felt or asphalt board between the concrete superstructure and concrete bridge seat. Figure 6.38 also shows the elimination of retention dowels at the expansion bearing locations. Fixed bearing locations vary slightly between the two details shown in Figure 6.38. For RC slab bridges, it is typical for the concrete slab to sit directly on the concrete bridge seat with #6 (¾-inch diameter) dowels, spaced at 2-foot intervals along the length of the bridge seat. For the RC girder bridge class, a thin piece of expansion joint material is placed along the face of the bridge seat and #6 dowels are placed at each girder location. The expansion joint material helps protect the edge of the bridge seat due to small deflections and rotations in the superstructure. These materials are, however, very thin and narrow (e.g., 3/8-inch thick and 4
153
inches wide) and may degrade over decades of exposure to the elements. Thus, it is reasonable to assume that the concrete girder is likely in direct contact with the concrete cap. Modeling the behavior of these alternative concrete bearings includes resistance due to sliding friction and the dowels. The material used in the bearings shown in Figure 6.38 are significantly thinner than the elastomeric pads and are assumed to contribute negligible stiffness to the bearing model. For the fixed and expansion bearings, it is assumed that the concrete superstructure sits directly on the concrete bridge seat; therefore, a coefficient of friction (COF) for concrete on concrete can be assumed. Following the guidance of the ACI 318 building code (2014), the median value of COF for a hardened concrete on concrete surface is assumed to be 0.6. To consider uncertainty in the COF, a multiplication factor is applied in the same fashion as discussed previously for the elastomeric bearing. This assumption is again based on the thin nature of the bearing material used in these alternative expansion joint details, as well as the age of the RC girder and RC slab bridge classes, which indicates that the bridges from these classes have been exposed to weathering for a median age of 50 years and 64 years, respectively, leading to deterioration of the bearing material and lubricant. The dowels found in these alternative type bearings are 0.75-inch steel dowels. They are assumed to behave in the same fashion as the dowels in the elastomeric bearing, with a slight reduction in stiffness due to the reduction in cross sectional area. In fact, the ultimate strength of the 0.75-inch dowel can be calculated assuming that the dowel strength can be scaled by the cross-sectional area ratio as for dowels used in the elastomeric bearing. Thus, a median ultimate dowel strength of 7 kips and COV of 0.08 are used to model these types of bearings.
6.4.5. Damping Ratio Damping ratio for bridges typically ranges from 0.02 to 0.07 of critical damping, which represents the 2nd and 98th percentiles according to Chen et al. (2003). Fang et al. (1999) found that damping in tall buildings follow a normal distribution, which can be extended to bridges (Nielson 2005; Ramanathan 2012). Therefore, in this study uncertainty in damping ratio are represented by a normal distribution with a mean of 0.045 and standard deviation of 0.0125.
6.4.6. Loading Direction Torbol and Shinozuka (2012) conducted a study looking at the effect of the angle of incidence (i.e., the angle of “attack” of the ground motion) on bridge fragility curves. Their results indicated that the angle of seismic incidence could lead to significant variation in the fragility of a bridge, and ultimately could lead to the underestimation of the vulnerability of the structure. Determining the angle of incidence of a seismic event on a particular structure is not easy; however, with enough site-specific information and knowledge of seismic fault activity one could argue that a particular angle of incidence could be generated with reasonable error. In the present study, an entire network of bridges with very different site information and orientations are being assessed. Thus, it is not
154
possible to determine bridge-specific loading directions for unknown earthquake sources. Following the guidance of Torbol and Shinozuka (2012), in this study, the angle of seismic incidence is considered a random variable sampled from 0 to 360 degrees.
6.4.7. Summary of Random Variables A summary of all the material properties and component behaviors described in Section 6.4, and their respective distribution characteristics can be found in Table 6.16. Table 6.16: Summary of parameters and distribution characteristics
Parameter Description Concrete strength Reinforcing strength Steel fixed - longitudinal Steel fixed - transverse Elastomeric shear modulus Steel fixed COF longitudinal Steel fixed COF - transverse Steel Rocker COF longitudinal Steel Rocker COF transverse Elastomeric-Multipl. factor Dowel Strength Dowel Gap Passive Stiffness Pile Stiffness
Probability Parameters a* b* 4200 850 55,000 4900 424.8 637.2 22.8 34.2 96 300
Abbreviation Conc Str Reinforcing Str Steel Fix - Long Steel Fix - Trans Elasto shear mod
Distribution Normal Lognormal Uniform Uniform Uniform
Units psi psi kip/in kip/in psi
Steel Fix COF-Long
Uniform
0.168
0.252
--
Steel Fix COF-Trans Steel Rocker COFLong Steel Rocker COFTrans Elasto MF Dowel Str Dowel Gap Abt-Pas Stf
Uniform
0.296
0.444
--
Uniform
0.032
0.048
Uniform
0.08
0.12
Lognormal Lognormal Uniform Uniform
0 20 0 20
0.1 1.6 2.75 50
Pile Stf
Uniform
20
60
-kip in kip/in/ft kip/in per pile % --
Superstructure mass Mass Uniform 110 140 Damping ratio Damp Ratio Normal 0.045 0.0125 Deck Gaps - Large Large Gap Uniform 1 6 in (MCSTEEL) Deck Gaps - Large Large Gap Uniform 1 2 in (MSSTEEL) Deck Gaps - Small Small Gap Uniform 0.7 1.3 in (MSSTEEL) Loading direction Load Dir Uniform 0 360 degrees *For normal and lognormal distributions, a and b indicate the median and dispersion, respectively, and for uniform distribution, a and b represent the lower and upper bounds, respectively.
6.5. Bridge Configurations In the present study, first, eight representative samples per class were selected to represent the variation in bridge geometry. These representative bridges were developed by sampling from the distributions of five geometry and age parameters, including number of spans, deck width, span length, year of construction, and under-clearance, which provides an approximate estimation of 155
column height. To properly account for material uncertainties and variations in component behavior, the geometrically representative bridge samples are each paired with eight samples of the material properties and component behaviors, creating the 64 bridge samples per bridge class to be used in the nonlinear response-history analyses. The parameters used to capture variation in material properties and component behaviors include, but are not limited to, steel and concrete strength, steel bearing stiffness, elastomeric bearing shear modulus, coefficient of friction for bearings, deck gap size, abutment stiffness, mass density, and inherent damping ratio. Therefore, in this study, 448 randomly generated bridges are generated to represent Texas bridge inventory. In this section, first, the sampling technique, which is the Latin Hypercube Sampling method, is discussed in details. Then, the geometric parameters of each bridge configuration of different bridge classes are shown. Finally, the bridge parametric samples generated for each bridge configuration are presented.
6.5.1. Sampling Methodology A major part of this study is analyzing the seismic vulnerability of the entire TxDOT bridge inventory. As previously mentioned, it is not feasible to analyze each individual structure; therefore, a set of bridge samples representing the variations in the Texas bridge inventory must be used. Based on experience from past studies (Choi 2002; Nielson 2005; Pan 2007; Ramanathan 2012) a large number of bridge samples are required to capture the variations in seismic performance. In this project, a total of 64 bridge samples are selected for each bridge class of concern (i.e., MCSTEEL, MSSTEEL, MSPC, MSRC, MCRC-Slab, MSRC-Slab, SSPC). Creating a computational bridge model requires a number of different variables to fully and accurately define each bridge. Some of these variables may be geometric parameters such as span length, deck width, number of spans, etc. While other variables are used to model material properties such as concrete strength, steel reinforcing strength, soil stiffness, pile stiffness, bearing stiffness, etc. As seen in past studies (Nielson 2005; Pan 2007; Ramanathan 2012), the number of modeling parameters can be quite large with upwards of 18 to 20 variables per model. To account for uncertainties in geometry and materials, one must sample from a probabilistic distribution for several, if not all of these variables. Thus, it is important to find an accurate yet efficient way to sample each of these parameters. Over the past several decades, a lot of research and effort has been invested in developing efficient and reliable probabilistic analysis methods used in engineering research (Olsson and Sandberg 2002). Several different methods have been used (e.g., Taylor series expansion and Neumann series expansion methods); however, Monte Carlo simulations, which are a probabilistic based sampling approach, have become the most popular approach in many engineering analysis applications. A concern that often arises when using a Monte Carlo simulation is the computational expense. Straight Monte Carlo simulations randomly select samples for each uncertain variable in an engineering problem based on their associated probabilistic distributions, which requires a large number of samples in order to accurately represent the entire distribution (e.g., on the order of 1,000 to 10,000 samples, in some cases even more). In certain applications where only, a small
156
collection of samples are used, the clustering of samples in the high probability region becomes a concern in that the selected samples are no longer representative of the entire range of the population they are meant to represent. To reduce the size of the sampling set (and thus reducing computational cost) without affecting the ability to capture the full range of the population, other variations of Monte Carlo simulations have been developed. According to Huntington and Lyrintzis (1998), Latin Hypercube Sampling (LHS), which utilizes a stratified random sampling technique, is the best variant of Monte Carlo that utilizes smaller samples. In this approach, the cumulative distribution function for the parameters of interest are divided up into n (i.e., the desired number of samples) equal sections or bins, and then a sample is randomly selected from within each bin (e.g., see Figure 6.39). This approach allows for the full probabilistic distribution to be represented in just a small number of samples. In this study, sixty-four bridge samples are to be modeled for each of the seven bridge classes considered in this study. Thus, the modeling parameters (which will be discussed in the following section) for each bridge were sampled using a Latin Hypercube technique. More specifically, following the work of Iman and Conover (1982) a ranked Latin Hypercube method was used in order to match the sampled correlation matrix as closely as possible to the empirical correlation matrix. In other words, the correlation between variables in the sample set should be representative of the correlation between variables in the entire population. The majority of the parameters used in this study show essentially zero correlation, and are thus assumed to have no correlation. It is still recommended, however, to use the ranked sampling method in order to eliminate the introduction of random or accidental correlation. For example, if deck width and column height are uncorrelated in the bridge inventory data, the ranked sampling approach would prevent the deck width and column height from generating a positive correlation during the random sampling process to avoid producing results unrepresentative of the actual population.
157
Figure 6.39: Generation of bridge parameter samples by the Latin Hypercube Sampling Approach (Pan 2007)
6.5.2. Bridge Geometric Samples The geometrically representative bridge samples that are used for each bridge class in this study can be seen below in Table 6.17 through Table 6.23.
158
Table 6.17: Geometric samples of multi-span continuous steel girder (MCSTEEL) bridges
Bridge No. 1 2 3 4 5 6 7 8
Deck Width (ft) 66 27.88 31.20 53.70 41.43 43.20 40.00 35.20
Span Length (ft) 60 90 87 118 40 145 70 240
Number of Spans 3 4 3 4 3 4 3 2
Year Built 1970 1962 1967 1964 1970 1973 1959 2004
Under Clearance (ft) 13.8 15.50 14.58 13.83 16.08 15.25 15.50 17.33
Table 6.18: Geometric samples of multi-span steel girder (MSSTEEL) bridges
Bridge No. 1 2 3 4 5 6 7 8
Deck Width (ft) 42.00 31.33 32.64 23.33 46.00 18.00 21.30 16.33
Span Length (ft) 33 40 77 45 35 46 24 50
Number of Spans 3 4 4 3 2 3 5 3
Year Built 1938 1955 1999 1939 1946 1940 1933 1935
Under Clearance (ft) 18.00 14.25 14.00 15.83 13.33 17.83 13.63 15.67
Table 6.19: Geometric samples of multi-span prestressed concrete girder (MSPC) bridges
Bridge No. 1 2 3 4 5 6 7 8
Deck Width (ft) 45.30 40.98 40.00 36.30 71.00 57.20 62.00 44.30
Span Length (ft) 37 107 84 60 72 121 80 100
Number of Spans 5 4 2 3 2 3 3 3
159
Year Built 1938 1997 1969 2006 1985 1973 2015 1994
Under Clearance (ft) 17.08 20.58 18.42 16.08 16.67 15.67 14.75 17.50
Table 6.20: Geometric samples of multi-span reinforced concrete girder (MSRC) bridges
Bridge No. 1 2 3 4 5 6 7 8
Deck Width (ft) 45.80 25.70 32.00 39.18 28.30 42.30 24.70 44.20
Span Length (ft) 41 40 40 30 30 40 30 30
Number of Spans 5 4 3 2 3 3 3 5
Year Built 1971 1982 1963 1990 1959 1961 1954 1968
Under Clearance (ft) 15.50 18.08 15.08 16.33 16.92 21.58 16.50 17.75
Table 6.21: Geometric samples of single span prestressed concrete girder (SSPC) bridges
Bridge No. 1 2 3 4 5 6 7 8
Deck Width (ft) 42.00 60.80 82.82 35.91 46.00 40.00 44.30 46.20
Span Length (ft) 60 112 70 95 115 80 100 120
Number of Spans 1 1 1 1 1 1 1 1
Year Built 1999 2010 1975 1983 1962 1993 2015 2006
Under Clearance (ft) 17.50 16.75 16.08 17.00 15.92 21.08 18.33 15.17
Table 6.22: Geometric samples of multi-span continuous reinforced concrete slab (MCRC-slab)
Bridge No. 1 2 3 4 5 6 7 8
Deck Width (ft) 54.11 42.00 46.00 40.00 32.30 40.00 46.00 41.80
Span Length (ft) 30 55 25 30 25 30 45 32
Number of Spans 3 5 4 4 3 3 2 4
160
Year Built 1947 1961 1964 1969 1957 1952 1986 1959
Under Clearance (ft) 16.75 22.67 21.50 16.92 17.33 16.33 14.42 15.67
Table 6.23: Geometric samples of multi-span reinforced concrete slab (MSRC-slab) bridges
Bridge No. 1 2 3 4 5 6 7 8
Deck Width (ft) 23.3 42.2 41.15 27.5 25.3 25.30 25.3 46
Span Length (ft) 22 25 25 25 25 18 25 25
Number of Spans 2 4 3 5 3 4 3 2
Year Built 1948 1956 1952 1960 1942 1928 1963 1953
Under Clearance (ft) 23.08 14.75 16.42 20.83 15.83 16.50 17.00 17.42
6.5.3. Bridge Parametric Samples As an example, Table 6.24 through Table 6.31 show the parameter samples for the MSPC bridge class that are to be matched with the geometric representative bridge samples from that bridge class. The parameter samples for the rest of the bridge classes (i.e., MS RC girder, MS RC slab, MS Steel girder, MC RC Slab, MC Steel girder, and SS PC girder) are presented in Appendix E. Table 6.24: MSPC parameters for geometric sample 1 Parameter
Conc Str Reinf Str Elasto Shear Mod Elasto MF Dowel Str Dowel Gap Abt-Pas Stf Pile Stf Fnd-Rot Stf Fnd-Tran-Stf Mass Damp Ratio Large Gap Load Dir
1 4303 53867 294
2 4703 53215 103
3 5437 48248 206
1.19 23.96 3.087 29.5 22.3 648 328 131 0.077 4.34 336
0.97 23.32 2.000 42.6 56.2 1329 215 121 0.044 5.99 42
0.84 28.90 2.746 49.3 70.7 1013 449 111 0.029 5.02 249
Modeling Sample 4 5 5558 3669 56264 58834 140 241 0.91 27.97 1.575 40.4 30.5 503 378 134 0.055 2.04 271
161
1.03 26.22 1.144 21.4 38.5 1100 356 123 0.049 0.31 194
6 4783 50585 272
7 3932 58016 197
8 3165 63368 153
1.08 25.12 2.340 27.4 50.0 1186 151 127 0.048 2.70 96
0.96 26.65 0.237 32.6 43.6 908 246 116 0.041 3.61 158
1.04 25.68 0.792 35.6 63.6 786 297 137 0.032 1.21 77
Table 6.25: MSPC parameters for geometric sample 2 Parameter
Conc Str Reinf Str Elasto Shear Mod Elasto MF Dowel Str Dowel Gap Abt-Pas Stf Pile Stf Fnd-Rot Stf Fnd-Tran-Stf Mass Damp Ratio Large Gap Load Dir
1 5186 55543 160
2 4920 59314 123
3 4761 56588 212
1.03 23.39 1.080 42.5 39.7 682 224 119 0.035 1.32 8
1.05 25.58 0.159 20.3 43.1 1001 218 122 0.016 2.08 300
1.00 23.85 0.735 38.7 63.0 785 284 125 0.040 5.26 141
Modeling Sample 4 5 3461 4208 43373 53625 258 237 1.08 25.03 2.544 31.1 48.8 1197 320 129 0.064 2.29 258
0.92 27.77 2.339 24.8 25.0 559 451 111 0.048 4.02 190
6 5718 51135 107
7 4438 52159 299
8 3878 61557 178
0.96 28.85 1.252 48.0 72.0 845 373 139 0.044 0.37 63
0.75 27.18 3.141 44.3 31.0 1112 412 114 0.051 3.48 359
1.14 26.15 1.720 33.1 57.1 1332 145 135 0.059 4.67 103
6 4743 49364 294
7 5050 61097 172
8 4256 59225 179
0.95 26.23 0.761 40.9 24.3 1086 172 114 0.043 0.95 346
1.00 21.59 0.183 44.0 33.0 1294 306 113 0.039 1.92 65
1.10 25.78 3.053 37.4 57.0 554 399 136 0.031 2.70 163
Table 6.26: MSPC parameters for geometric sample 3 Parameter
Conc Str Reinf Str Elasto Shear Mod Elasto MF Dowel Str Dowel Gap Abt-Pas Stf Pile Stf Fnd-Rot Stf Fnd-Tran-Stf Mass Damp Ratio Large Gap Load Dir
1 3419 52631 247
2 4152 55994 273
3 3904 51354 220
1.16 29.02 1.308 24.0 69.2 1333 424 122 0.050 3.76 21
0.93 23.70 1.894 29.9 42.2 801 186 121 0.060 3.01 110
1.04 24.91 2.191 23.5 67.3 678 279 126 0.029 4.58 227
Modeling Sample 4 5 5322 6624 57827 53348 130 116 0.80 26.62 0.918 31.4 53.7 831 373 130 0.049 0.19 213
162
1.02 28.07 2.801 47.6 36.1 1041 255 137 0.057 5.50 303
Table 6.27: MSPC parameters for geometric sample 4 Parameter
Conc Str Reinf Str Elasto Shear Mod Elasto MF Dowel Str Dowel Gap Abt-Pas Stf Pile Stf Fnd-Rot Stf Fnd-Tran-Stf Mass Damp Ratio Large Gap Load Dir
1 6293 50209 246
2 3988 52627 208
3 3839 56148 144
1.13 28.31 1.657 35.5 21.8 1008 214 136 0.039 4.62 140
0.83 25.90 1.312 44.6 53.4 1131 173 126 0.033 5.60 190
1.03 26.47 0.795 29.8 33.3 773 417 121 0.051 4.34 229
Modeling Sample 4 5 4764 5242 56967 59285 119 161 0.96 24.12 1.065 40.3 43.8 508 364 123 0.082 1.10 134
0.93 24.68 0.120 33.9 56.1 1406 406 117 0.049 0.12 317
6 2458 67869 293
7 4836 47694 250
8 4392 54304 185
1.12 27.10 2.547 23.4 69.3 622 233 113 0.043 2.84 312
1.07 30.36 2.346 26.1 35.7 1284 297 132 0.054 3.21 77
0.99 23.57 3.141 49.2 62.0 886 334 134 0.025 1.60 23
6 3939 63356 185
7 3831 52291 201
8 4844 59464 148
0.95 25.18 0.120 23.8 43.1 1366 352 114 0.048 0.28 150
1.07 26.37 1.987 46.5 26.1 514 420 111 0.038 3.68 113
1.03 31.12 2.685 27.9 50.2 1042 154 118 0.051 4.42 241
Table 6.28: MSPC parameters for geometric sample 5 Parameter
Conc Str Reinf Str Elasto Shear Mod Elasto MF Dowel Str Dowel Gap Abt-Pas Stf Pile Stf Fnd-Rot Stf Fnd-Tran-Stf Mass Damp Ratio Large Gap Load Dir
1 5522 55396 271
2 3251 47291 293
3 4653 54070 236
1.14 28.41 2.139 36.6 39.3 1236 255 133 0.025 2.86 86
0.90 27.19 1.044 43.4 73.6 1109 290 132 0.034 5.67 304
1.09 25.60 2.968 34.3 64.5 618 391 140 0.079 1.13 198
Modeling Sample 4 5 5463 4363 57045 50139 126 103 0.97 24.04 1.241 21.9 33.2 874 309 126 0.045 4.60 337
163
0.89 23.50 0.494 41.1 59.6 741 184 125 0.058 1.71 4
Table 6.29: MSPC parameters for geometric sample 6 Parameter
Conc Str Reinf Str Elasto Shear Mod Elasto MF Dowel Str Dowel Gap Abt-Pas Stf Pile Stf Fnd-Rot Stf Fnd-Tran-Stf Mass Damp Ratio Large Gap Load Dir
1 4443 57262 150
2 6231 53086 235
3 3686 45119 118
1.07 23.06 2.764 30.6 43.5 670 221 118 0.057 2.86 1
0.93 28.11 0.003 33.9 24.7 832 423 115 0.047 1.53 125
0.93 25.43 1.299 43.0 56.6 1038 319 123 0.038 5.60 311
Modeling Sample 4 5 5014 3459 55641 50264 250 177 0.83 24.71 1.859 24.2 31.0 1241 411 136 0.062 4.56 344
1.16 24.24 0.516 40.7 39.1 774 339 128 0.029 0.27 147
6 5309 61685 298
7 4660 59832 140
8 4204 53879 213
1.00 26.37 2.235 21.5 52.7 493 204 133 0.050 1.38 63
1.01 29.34 0.890 47.3 65.5 1179 268 132 0.032 3.71 205
1.04 27.12 3.105 38.2 74.8 1324 149 110 0.043 4.49 229
6 3945 59551 122
7 6135 47218 149
8 4566 51657 98
0.99 27.54 2.605 28.9 65.8 1320 349 114 0.053 0.44 33
1.04 25.18 1.640 20.7 73.6 875 390 129 0.056 5.55 214
1.00 25.56 1.590 34.3 42.0 590 226 140 0.041 3.60 283
Table 6.30: MSPC parameters for geometric sample 7 Parameter
Conc Str Reinf Str Elasto Shear Mod Elasto MF Dowel Str Dowel Gap Abt-Pas Stf Pile Stf Fnd-Rot Stf Fnd-Tran-Stf Mass Damp Ratio Large Gap Load Dir
1 4815 54529 204
2 4439 55672 195
3 3255 63954 248
1.08 23.15 0.830 47.0 22.5 1204 206 120 0.028 2.09 168
0.80 26.53 3.017 40.0 32.0 1160 167 125 0.049 0.84 334
0.93 27.16 2.092 44.2 37.7 798 438 110 0.062 5.21 70
Modeling Sample 4 5 5308 3665 57096 49895 289 271 1.25 28.42 0.294 24.9 60.1 992 307 135 0.035 2.39 116
164
0.94 23.74 0.560 35.2 48.3 606 291 122 0.042 4.48 268
Table 6.31: MSPC parameters for geometric sample 8 Parameter
Conc Str Reinf Str Elasto Shear Mod Elasto MF Dowel Str Dowel Gap Abt-Pas Stf Pile Stf Fnd-Rot Stf Fnd-Tran-Stf Mass Damp Ratio Large Gap Load Dir
1 4717 55711 181
2 4064 50887 132
3 3039 59420 264
Modeling Sample 4 5 5663 4406 54204 49258 297 101
6 5088 52551 217
7 3842 62232 160
8 4842 57574 228
1.10 23.47 1.132 37.9 65.2 1123 403 136 0.052 3.98 147
1.02 27.91 0.601 34.0 43.0 807 309 122 0.047 2.83 256
1.04 27.22 1.629 29.7 71.0 548 288 140 0.030 4.52 18
1.13 28.66 1.426 20.0 56.1 1195 416 131 0.060 0.77 55
0.84 24.48 2.270 47.9 30.3 895 174 114 0.035 0.50 289
0.98 25.38 0.392 25.3 47.9 1310 354 118 0.042 1.50 96
0.90 25.11 3.131 46.0 36.5 697 188 111 0.038 3.16 329
0.94 26.09 2.561 39.1 22.5 975 246 128 0.058 5.78 220
6.6. Summary The NBI database, along with additional information provided by the in-house TxDOT bridge database, was used to provide statistical information on the TxDOT bridge inventory. Seven bridge classes, representing 84.7% of the on-system bridges in Texas, were identified by TxDOT as being of primary importance in this seismic vulnerability study. Statistical information on the following parameters were determined using the NBI and TxDOT databases: number of spans, maximum span length, deck width, vertical under-clearance, skew angle, substructure type, and year built. This information is used in selection of sample bridges for each bridge class that are representative of those found in the inventory. Moreover, TxDOT standard drawings and as-built drawings were used to identify specific components and structural details commonly used for the bridges and construction eras of interest. Information on typical superstructure, substructure, and bearing details, gleaned from extensive review of TxDOT standard and as-built bridge drawings, provides guidance in developing the representative bridge models used in this study, which are addressed in next chapter. When conducting a fragility analysis for a large transportation network, an important step is developing samples that accurately represent the entire network. The Texas bridge inventory consists of bridges of many different types, materials, sizes, and construction eras. This chapter’s second focus of was creating bridge samples that are statistically representative of the entire bridge population. First, geometric parameters, including deck width, span length, number of spans, year of construction, and under-clearance, were sampled to create eight geometrically representative bridge samples for each bridge class. Second, material properties and component behaviors such as concrete strength, steel strength, bearing stiffness, coefficient of friction, mass, damping ratio, loading direction, deck gaps, and abutment and foundation stiffness, were sampled eight times and assigned to each of the geometric samples, creating a total of 64 bridge samples. These
165
representative bridge samples are used to create computational bridge models, as described in Chapter 7, and are used to conduct a computational seismic fragility analysis, as described in Chapter 8.
166
Chapter 7. Model Development 7.1. Overview This chapter describes the bridge component numerical modeling approaches used for the nonlinear response-history analyses. In this chapter, first, the general modeling parameters selected for the analyses, such as selection of the software, model dimensionality, and the element types used, are discussed. Then, numerical models for each component of the bridges are discussed in details. Finally, the model assembly approach is described, as well as an example of response history analysis of a bridge sample.
7.2. General Modeling Assumptions 7.2.1. 2D and 3D Models Generation of fragility curves requires accurate numerical bridge models capable of simulating nonlinear behavior. The first decision that needs to be made is whether the models should be constructed in two dimensions (2D) or three dimensions (3D). The main advantage of a 2D model is its simplicity compared to a 3D model. An important question arises concerning whether bridges should be modeled in their longitudinal or transverse directions when using a 2D approach. Numerous studies such as Rashidi and Ala Saadeghvaziri (1997) and Shinozuka et al. (2000b) suggest that the longitudinal direction controls the response, while others (Lou and Cheng 1996) believe the transverse direction is critical. Rashidi and Ala Saadeghvaziri (1997) argued that seismic motion acting in the longitudinal direction of a bridge causes more damage to multi-span bridges than transverse motions due to impact between adjacent bridge decks and abutments. Additionally, the study revealed that many bridge bearings are designed inadequately in the longitudinal direction, claiming that a significantly-sized earthquake will cause girder unseating and bridge collapse. A seismic fragility study of the bridges in California arrived at a similar conclusion, stating that the analysis of bridges with ground motions in the transverse direction produced lower levels of damage (Shinozuka et al. 2000b). With the ubiquity of computationally-efficient finite element software capable of conducting 3D analyses, the guidelines for nonlinear analysis of bridge structures prepared by the Pacific Earthquake Engineering Research Center (PEER) recommend using 3D bridge models to accurately capture the interaction of bridge response in both orthogonal directions (Aviram et al. 2008). Research performed by the Nielson (2005) assessing the seismic fragility of bridges in the Central and Southeastern United States similarly employed 3D models in the analyses to capture these effects. The distribution of forces in critical bridge components such as columns, bearings, abutments, and superstructure, depends on their relative longitudinal and transverse stiffnesses, coupled with ground shaking components in the longitudinal and transverse directions. For that reason, three-dimensional models are used in this study. 167
7.2.2. Types of Analysis To accurately predict the response and level of damage in bridge components, nonlinear models are required. Linear models are only able to predict the response within elastic limits (prior to steel yielding, concrete cracking, and spalling) and will not capture cyclic yielding and strengthdegrading behaviors of structural components, deck pounding, nonlinear soil effects, nonlinear abutment behavior, and other factors. These behaviors are particularly important in seismic analysis, where response of a system depends on the ductility and energy dissipation capacities of its components (Aviram et al. 2008). Two types of nonlinearities need to be considered. The first type is material nonlinearity, accounting for inelastic stress-strain behavior of elements, as well as the presence of gaps that can open and close (deck joints, clearance between bearing dowels and slotted holes, etc.). The second type represents geometric nonlinearity, accounting for second-order (P-Δ) effects and stability. Most modern structural analysis software has the capability to perform a second-order analysis (Aviram et al. 2008). Establishing accurate demand-response relationships for seismic fragility curves requires accurate nonlinear models that are capable of simulating damage-related behavior as well as representative ground motions to perform nonlinear response-history analyses. Contrary to static analysis methods, where seismic activity is expressed as externally-applied inertial loads acting on nodes throughout the height of the structure, response-history analysis directly applies ground accelerations as a function of time in a dynamic analysis. In a nonlinear response-history analysis, ground motions with up to three orthogonal components (i.e., two horizontal acceleration components and, optionally, one vertical acceleration component) are applied to the nonlinear structural analysis model, and responses (displacements, forces, and bending moments) of key nodes and elements are recorded. Bridge modes of deformation tend to be sensitive to particular ground motions; therefore, a suite of different ground motions needs to be considered to determine the bridge critical response (Aviram et al. 2008). There are various finite element analysis software packages capable of performing responsehistory analysis, including SAP2000 (CSI 2016), RISA-3D (RISA-Technologies 2016), and OpenSees (McKenna et al. 2000). For the purpose of this study, OpenSees is selected as the primary nonlinear analysis tool. The main advantages of OpenSees include its computational efficiency and code-based input, allowing bridge models to be created automatically using secondary scripts, as well as the fact that OpenSees is an open-source framework, giving researchers the opportunity to freely develop and distribute their own material and element models. Numerous nonlinear material models are already built into the software, allowing users to simulate a wide variety of nonlinear hysteretic behaviors (McKenna et al. 2000). A rectangular coordinate system is used for 3D bridge modeling. As shown in Figure 7.1, the Xaxis is the chord connecting the abutments (longitudinal), the Y-axis is orthogonal to it in the horizontal plane (transverse), and the Z-axis is in the vertical direction. For non-skewed bridges,
168
local axis orientation of frame elements, indicated by numbered axes in Figure 7.1, typically coincides with the global axis directions.
Figure 7.1: Bridge global and local coordinate systems (Aviram et al. 2008)
7.2.3. Modeling Approach Nonlinear dynamic analysis and damage assessment of large explicit three-dimensional bridge models for earthquake loading is computationally demanding; hence, bridge structural components such as girders, bent caps, and columns are usually simplified to line elements. Nonlinear material behavior can be defined through distributed plasticity beam-column elements, where fiber crosssections can be defined along the length of an element with specified nonlinear material behaviors. Alternatively, elastic beam-column elements can be used, where nonlinear springs can be assigned at specific locations where nonlinear behavior is expected to occur. For example, nonlinear rotational springs can be placed at the ends of a beam-column element expected to exhibit flexural hinging. In OpenSees, these nonlinear springs are modeled using nonlinear zero-length elements. As implied by its name, a zero-length element lumps inelastic behavior to an infinitesimal point. It can act as a translational spring in any direction with force-displacement behavior assigned to it, or as rotational spring in any direction with moment-rotation behavior assigned to it. Multiple springs in any degrees of freedom can be used between two nodes located at the same coordinates. Unlike distributed plasticity elements, zero-length springs lump all inelastic behavior in one point, making it significantly more computationally efficient. Creation of bridge fragility curves requires multiple bridge models to be analyzed using response-history analysis with suites of different ground motions, making computational time an important aspect to take into account. Additionally, some bridge nonlinear effects, such as shear failure, pounding, or soil deformation, have to be estimated with empirical relationships, which can be assigned to a spring element, whereas distributed plasticity fiber elements are only capable of capturing axial and flexural behavior. As a result, zero-length springs are used in this study to simulate nonlinearity effects in the bridge models.
169
Dynamic analysis of a structure requires appropriate assignment of translational and rotational masses to the nodes of the structure. To provide a realistic distribution of inertial forces throughout a structure, translational masses can be assigned to multiple nodes along the length of the superstructure. To capture global torsional behavior of a bridge, nodal translational masses can be assigned along the superstructure’s width without requiring input of rotational masses if a 3D model is used (Amirihormozaki et al. 2015). In most cases, the torsional mode of a bridge is unlikely to control bridge response during a seismic event; however, in rare cases when that mode controls, it will affect the behavior and damage of the whole structure, and therefore should not be ignored (Aviram et al. 2008). Another important phenomenon that needs to be accounted for in the model is damping, i.e., energy dissipation of the bridge components during their dynamic response. A common way to model structural damping is through Rayleigh damping, in which the amount of damping force is proportional to velocity. Most studies covering bridge seismic analysis (Choi 2002; Filipov 2012; Nielson 2005) generally use a damping ratio of 5% for all bridge types, as is commonly assumed in design. In this study, the damping ratio is assumed to be a random variable that is sampled on as described in Section 6.5 of this report, and this damping ratio is assigned to the first two modes using a Rayleigh damping model. In summary, 3D models are used to capture deformation in the longitudinal, transverse, and vertical bridge directions. Nonlinear zero-length springs are used to simulate nonlinear behavior concentrated at a single point. Translational masses are distributed throughout the structure to simulate inertial forces. Damping is modeled as mass and stiffness proportional Rayleigh damping. In the following sections, the nonlinear model that is assigned to each bridge component is discussed in details.
7.3. Superstructure As mentioned earlier, bridge superstructures are typically composed of a concrete deck and steel or concrete girders. Depending on the age of construction, the bridge deck and girders may or may not act compositely. When conducting a dynamic seismic analysis, the superstructure is the main contribution of mass for the bridge system, which must be accounted for in the model. Bridge superstructures are assumed to be significantly stiffer and stronger laterally than the columns and bearings underneath them in both the longitudinal and transverse directions. Hence, the superstructure is expected to stay in the elastic range during a seismic event. For this reason, the bridge superstructure is often modeled using elastic beam-column elements for seismic analysis (Filipov 2012; Nielson 2005; Tavares et al. 2013). If bridge superstructure or diaphragm inelasticity are possible, the assumption of linear elasticity should be checked at the end of the analysis (Filipov 2012). Beam-column elements are able to capture combined axial and flexural demands without explicit consideration of shear deformations, which has been assumed to be adequate for simulation of sufficiently long spans. The effects of shear deformations only become significant for span/depth ratios less than two, which is atypical for bridge girders (Patel et al. 2014).
170
Elastic analysis implies a linear relationship between stress and deformation of the superstructure elements; however, for concrete members it is important to account for the effects of cracking on flexural and torsional stiffness. To account for cracking, gross flexural moments of inertia of concrete girders are multiplied by 0.5 (AASHTO 2016), and the torsional constant is multiplied by 0.2 (Caltrans 2013). NHI (2014) recommendations to use unmodified section properties (i.e., no reduction in flexural rigidity) were not followed in this study. Even though it is true that prestressed girders are designed to remain uncracked during service loads, it is unknown whether they remain so during a seismic load. Hence, a factor of 0.5 was used for prestressed girders as well as conventionally reinforced concrete girders. As noted, the superstructure is assumed to remain elastic during a seismic analysis; hence, the entire superstructure cross-section can be lumped into a single beam-column element representing mass and stiffness of the entire deck width (Aviram et al. 2008; Nielson 2005; Pan et al. 2010). This simplified single beam element approach, however, does not capture vertical and horizontal distribution of mass along the width of the bridge superstructure. Alternatively, the distribution of mass, gravity loads, and stiffness along the width of the superstructure can be modeled using multiple beam-column elements aligning with the girder lines, which is termed a deck-grid model (Amirihormozaki et al. 2015; Filipov 2012; Tavares et al. 2013). One of the biggest advantages of the deck-grid model is its ability to distribute superstructure mass and stiffness along bridge width. The beam-column elements along the girder lines consider the stiffness of the girder and its tributary concrete deck area. In cases where the deck is not composite, the contribution of stiffness from the deck can be neglected. A conservative assumption is also to neglect concrete rail stiffness, as if the rails are cast separately from the deck, resulting in larger deformation estimates than if rail stiffness was considered. However, if there is good evidence of a rigid connection between the deck and concrete rails, their stiffness should be included because it will result in smaller superstructure deflection in the transverse direction. Figure 7.2 shows bridge deck grid model proposed by Filipov (2012). As seen in the figure, the longitudinal beam-column elements are connected in the transverse direction via beam-column elements simulating the transverse stiffness of the deck and other transverse bracing elements. No mass is assigned to the transverse elements because it is already included in the longitudinal elements (Amirihormozaki et al. 2015). In the case of steel bridges, where cross-frames provide transverse bracing between the girders, those members are more likely to experience inelastic behavior during a seismic event compared to concrete diaphragms. Cross-frames may be modeled as nonlinear components, being able to dissipate some of the seismic energy and reduce the shear demands on columns through their inelastic deformation; however, in the absence on cross-frame nonlinear behavior models, such cross-frame models were not used in this study (Hamidreza et al. 2010). Diaphragms and cross-frames at the locations of bents and abutments are expected to experience the largest loads, whereas loads at intermediate diaphragms or cross-frames are significantly lower. For this reason, some researchers (Amirihormozaki et al. 2015) have suggested that explicit modeling of bracing elements at these intermediate locations is not necessary;
171
however, it is still important to assign a rotational constraint to the girder nodes at each intermediate diaphragm or cross-frame location to account for their bracing effects.
Figure 7.2: Bridge deck grid model (Filipov 2012)
Figure 7.3: Deck mass distribution (Filipov 2012) Accurate mass assignment and distribution is essential for getting accurate solutions from response-history analyses. All bridge dead loads need to be considered as part of the seismic mass, including slab, girders, wearing surface, and rails. Live loads typically do not need to be considered as part of the seismic mass. Figure 7.3 shows deck mass distribution. As seen in the figure, in the deck-grid model, the mass is assigned to nodes representing the vertical distribution of mass in the superstructure system. This vertical distribution of mass accounts for overturning effects that may be caused by the center of mass not aligning with the center of transverse stiffness (Filipov 2012). In order to accurately represent mass distribution along the span, intermediate nodes (girder and deck) were used, as opposed to only having nodes at the supports. Spreading the mass to intermediate nodes did not significantly affect superstructure translation, but it did change the amount of rotation, particularly in approach spans. The exact number of intermediate girder nodes must be determined on a case-by-case basis, where a sensitivity study can be used to make this determination. For this research project, a minimum of three intermediate nodes per span is used. In the case of slab bridges, which do not have any girders, the slab itself acts as the main flexural element. Hence, slab sections were modeled with beam-column elements with appropriate
172
sectional and material properties. The number of sub-sections used to subdivide the slab can range from one (rectangular section representing the entire slab width) to nearly infinitely many sections of infinitesimal width. In this study, the number of slab sections was selected so that the spacing between them will be similar to typical bridge girder spacing. Deck lumped mass nodes were still used, but only to represent wearing surface and rail mass, if present. The mass of the slab is accounted for through beam-column mass per unit length assignment. To simulate bridge diaphragm behavior, a rigid diaphragm constraint was used for girder nodes within a simply-supported span or for all girder nodes in continuous spans. This command makes all of the assigned nodes within a span translate and rotate in the horizontal plane as a rigid body. Even though superstructure is expected to stay elastic under gravity and earthquake loading, deck damage may occur due to pounding effects at deck joint locations. The numerical model capable of simulating this phenomenon is presented in the following section.
7.4. Joint Deck pounding is caused by out-of-phase motion of adjacent bridge sections. It is a common cause of bridge seismic damage, including girder unseating and concrete deck crushing and spalling. The bridges that are the most susceptible to this kind of damage are multi-span simply supported bridges with joints between adjacent spans. Pounding damage can still occur in single-span and continuous bridges between superstructure and abutments. The research performed by Muthukumar (2003) extensively studied the effects of pounding and methods of numerically model it. There are two main methods to model pounding effects: (1) the stereomechanical approach and (2) the contact element approach. The stereomechanical approach is a macroscopic attempt to model dynamic impact of two colliding bodies (labeled 1 and 2) using an assumed coefficient of restitution (e). Impact is assumed to be instantaneous, and the principle of momentum balance is applied to relate the velocities before (v1 and v2) and after impact (v1’ and v2’) per Equation (8.1) (Goldsmith 1978). 𝑒𝑒 =
𝑣𝑣2′ − 𝑣𝑣1 ′ 𝑣𝑣1 − 𝑣𝑣2
(7.1)
The coefficient of restitution ranges from zero (perfectly-plastic impact) to 1.0 (perfectly-elastic impact), and depends on material and geometric properties of the two colliding bodies. Previous research using the stereomechanical approach, however, has shown little effect of variation of e on the structural response due to pounding (DesRoches and Fenves 1997). The stereomechanical approach is limited in its application due to what is typically an unknown duration of contact. If the impact duration is sufficiently long, the assumption of instantaneous impact is no longer correct (Muthukumar 2003). Finally, the approach cannot be modeled using available structural analysis software, including OpenSees; therefore, it is not used in this study.
173
Figure 7.4: Deck pounding model (Nielson, 2005) The contact element approach is the preferred impact modeling method to implement in nonlinear analyses. As shown in Figure 7.5, impact is simulated by a contact spring between two colliding bodies. Initially, when the gap between components is open, the spring provides no stiffness. Thus, it does not resist deformation in any way. Once the gap is closed, however, the contact element is engaged with a high stiffness, which depends on material and geometric properties of the colliding bodies. Many previous studies including Maison and Kasai (1990), Wolf and Skrikerud (1980), and Anagnostopoulos (1988) used an elastic behavior to model pounding, which is as shown in Figure 7.5. However, an elastic model is unable to simulate energy dissipation without using additional damper elements, making the resulting behavior unrealistic.
Figure 7.5: Linear contact spring behavior In contrast to the previous research, Muthukumar (2003) developed a bilinear pounding model to capture energy dissipation during bridge deck collision. The energy lost during the impact (ΔE) is based on the stereomechanical approach as follows:
1 𝑚𝑚1 𝑚𝑚2 (1 − 𝑒𝑒 2 )(𝑣𝑣1 − 𝑣𝑣2 )2 (7.2) 2 𝑚𝑚1 + 𝑚𝑚2 where m1 and m2 are masses of the colliding bodies; v1 and v2 are velocities of the colliding bodies; and e is restitution coefficient, which is typically taken as 0.6–0.8 for concrete decks. The relative velocity of two colliding bodies at the onset of impact can be related to the maximum penetration during the collision, as follows: 𝛥𝛥𝛥𝛥 =
174
(𝑣𝑣1 − 𝑣𝑣2 )2 = �
𝑛𝑛+1 2(𝑚𝑚1 + 𝑚𝑚2 ) 𝑘𝑘ℎ 𝛿𝛿𝑚𝑚 �� � 𝑚𝑚1 𝑚𝑚2 𝑛𝑛 + 1
(7.3)
where kh is impact stiffness parameter, which is typically taken as 25,000 k-in-3/2; n is Hertz coefficient, which is typically taken as 3/2; and δm is maximum penetration of two decks, which is assumed as 1 inch. Combining the Equations (7.2) and (7.3) yields: 𝑛𝑛+1 (1 𝑘𝑘ℎ 𝜕𝜕𝑚𝑚 − 𝑒𝑒 2 ) (7.4) 𝑛𝑛 + 1 The theoretical energy loss estimate serves as a basis behind the bilinear model by Muthukumar (2003). According to the assumption, the amount of energy lost is equal to the area under the hysteresis curve, which is shown in Figure 7.6, with the maximum displacement equal to the assumed maximum penetration of two decks.
𝛥𝛥𝛥𝛥 =
Figure 7.6: Bilinear pounding element behavior The pounding element is modeled using a nonlinear spring with the bilinear pounding model shown in Figure 7.6 assigned in the longitudinal direction; the remaining five degrees of freedom are unconstrained. The material model requires definition of the initial gap between two deck segments or a deck segment and abutment. The initial stiffness (K1), secondary stiffness (K2), and yield displacement (δy) must also be defined, and these parameters are computed based on the estimated energy loss as follows: 𝐾𝐾1 = 𝑘𝑘ℎ �𝛿𝛿𝑚𝑚 +
𝐾𝐾2 = 𝑘𝑘ℎ �𝛿𝛿𝑚𝑚 −
𝛥𝛥𝛥𝛥
𝑎𝑎𝛿𝛿𝑚𝑚 2 𝛥𝛥𝛥𝛥
(1 − 𝑎𝑎)𝛿𝛿𝑚𝑚 2
175
(7.5) (7.6)
𝛿𝛿𝑦𝑦 = 𝑎𝑎𝛿𝛿𝑚𝑚
(7.7)
where, a is typically taken as 0.1. Figure 7.7 shows a sample hysteretic response for a joint with an initial gap of 0.5 inch. The pounding element is a compression-only spring that gets activated once the gap length closes; no resistance is provided in the tensile direction.
Figure 7.7: Pounding element hysteresis
7.5. Bearings Another potential cause of bridge seismic damage is girder unseating due to excessive bearing deformation and/or instability. Numerical models for typical bearing types found in Texas highway bridges are presented in the following sections. As noted in Chapter 6, bridge bearings transfer vertical and horizontal loads from the bridge superstructure to the substructure. Two common types of bearings are steel bearings and elastomeric bearings. In the following sections, the numerical modeling of each bearing type is discussed in detail.
7.5.1. Steel Bearings In general, steel bearing behavior can be separated into two primary mechanisms: bilinear friction and hysteretic restraining behaviors. As shown in Figure 7.8, Coulomb friction is assumed to govern friction of the bearings, which is because of sliding and rocking of the steel bearings. Elastic stiffness before sliding or rocking, ke, is very large, and inelastic stiffness after sliding or rocking, kp, is very small or zero (assuming no corrosion or debris). The friction force, Ff, is proportional to the normal reaction, N, and the coefficient of sliding or rocking friction, μ, as follows: 𝐹𝐹𝑓𝑓 = µN 176
(7.8)
Figure 7.8: Nonlinear behavior associated with friction The restraining behavior, which is mainly because of collision with guide plates, keeper plates, pintles, anchor bolts, is represented using a nonlinear hysteretic function. Figure 7.9 shows the hysteretic behavior that is considered in this study. This type of modeling is commonly used in previous studies (Mander et al. 1996).The bilinear friction behavior and hysteretic restraining behavior is combined in parallel (i.e., the stresses and stiffnesses are added together) to simulate behavior of an entire bearing.
Figure 7.9: Nonlinear behavior associated with restraining Cyclic tests of each type of steel bearing have been conducted by Mander et al. (1996). Parameters for defining the combination of bilinear and hysteretic analytical functions to represent the behavior in the longitudinal and transverse directions for each bearing type were determined empirically and are detailed in Mander et al. (1996). For the purpose of evaluating the analysis parameters, the models for each bearing type were analyzed using the same displacement history from their respective tests. The results from the analyses are overlaid with the experimental data for comparison for each bearing type. Note, hysteretic forces from the bilinear and hysteretic 177
springs, which act in-parallel, were added in order to compare to the experimental forcedisplacement results. For the purpose of analysis, symmetric clearances at anchor bolts, pintles, and keeper plates are assumed in the proposed models, although this will not always be true in the real-world scenarios (Mander et al. 1996). 7.5.1.1. Low-Type Sliding Bearings The longitudinal response of the low-type sliding bearing (Figure 7.10) can be approximated with a bilinear friction response alone (Figure 7.11) because the element is free to translate. As for the transverse response, both bilinear friction and hysteretic restraining behaviors need to be included. Once the bearing force of μN is exceeded, the bearing translates in the direction of the slide prior to contacting a hysteretic element, a guide plate in this case. The contact between the sliding plate and the guide plates provides resistance prior to guide plate anchor fracture. Additionally, the clearance between the sliding and guide plate (3mm in the details shown in Figure 7.10) needs to be included as it will allow free translation within that gap region as shown in Figure 7.12 (Mander et al., 1996). Stiffness and strength parameters for modeling the bilinear and hysteretic behaviors were proposed by Mander et al. (1996).
Figure 7.10: Low-type sliding bearing specimen (Mander et al. 1996)
Figure 7.11: Low-type sliding bearing, longitudinal model (Mander et al. 1996)
178
Figure 7.12: Low-type sliding bearing, transverse model (Mander et al. 1996) Figure 7.13 and Figure 7.14 show the comparison between the low-type fixed bearing test performed by Mander et al. (1996) and the computational pushover analysis using the same displacement history in the longitudinal and transverse directions, respectively. The y-axis on the plots is base shear coefficient, which is equal to the ratio of horizontal bearing force to normal force. Due to convergence issues associated with using zero-stiffness during sliding in the longitudinal direction, the value of post-yielding stiffness ratio (relative to the initial stiffness) was adjusted to 0.001. Hence, there is a non-zero slope on the graph in the post-yield region.
Figure 7.13: Low-type sliding bearing, longitudinal model-test comparison
179
Figure 7.14: Low-type sliding bearing, transverse model-test comparison 7.5.1.2. Low-Type Fixed Bearings This type of bearing, shown in Figure 7.15, exhibits both friction and pintle restraining/deformation behaviors in both the longitudinal and transverse directions (Figure 7.16 and Figure 7.17, respectively). The gap in this hysteretic restraining model accounts for the clearance between pintle (trapezoidal extrusion from the masonry plate) and socket (pintle slotted hole).
Figure 7.15: Low-type fixed bearing specimen (Mander et al. 1996)
180
Figure 7.16: Low-type fixed bearing, longitudinal model (Mander et al. 1996)
Figure 7.17: Low-type fixed bearing, transverse model (Mander et al. 1996) Similar to the low-type sliding bearings, Figure 7.18 and Figure 7.19 show the comparison between testing and numerical modeling for the loading in the longitudinal and transverse directions, respectively.
181
Figure 7.18: Low-type fixed bearing, longitudinal model-test comparison
Figure 7.19: Low-type fixed bearing, transverse model-test comparison 7.5.1.3. High-Type Rocker Bearings For high-type rocker bearings, which is shown in Figure 7.20, the longitudinal behavior depends on a combination of rolling resistance at the base of the rocker and Coulomb friction at the hinge of the sole plate-rocker interface. This combined rolling and friction resistance is modeled with a bilinear function (Figure 7.21). Ideally, the inelastic stiffness is zero in case of a uniform curvature and smooth rocking surface. However, Mander et al. (1996) recommend using non-zero kp values 182
to account for debris buildup. In case of the particular high-type bearing tested in this experimental program, it is about 1.8% of the elastic stiffness. The transverse behavior of the high-type bearing needs to be described with both bilinear rolling and friction models and hysteretic restrainer models as shown in Figure 7.22. Note that the keeper plates exhibit a more brittle behavior under bearing compared to the ductile hysteretic bearing behavior shown for other bearing types. The keeper plate is located on both sides of the bearing; hence, the behavior is identical in both transverse directions.
Figure 7.20: High-type rocker bearing specimen (Mander et al., 1996)
Figure 7.21: High-type rocker bearing, longitudinal model (Mander et al., 1996)
183
Figure 7.22: High-type rocker bearing, transverse specimen (Mander et al., 1996) Figure 7.23 shows the comparison between testing and modeling results in the longitudinal direction, and Figure 7.24 displays the comparison for the specimen loaded in the transverse direction. Note, during transverse loading of the rocker bearing specimen, it failed due to instability during the first cycle; hence, there is only one hysteresis loop.
Figure 7.23: High-type rocker bearing, longitudinal model-test comparison
184
Figure 7.24: High-type rocker bearing, transverse model-test comparison 7.5.1.4. High-Type Fixed Bearings For high-type fixed bearings (Figure 7.25), the transverse behavior is nearly the same as the rocker bearing, though there are some variations in the strength and stiffness parameters. Sliding is not permitted in the longitudinal direction, but longitudinal deformation due to prying of the masonry plate on the rubber pad has been observed. A bilinear model has been proposed to simulate this prying behavior and can be added in parallel with the hysteric bearing behavior to simulate anchor bolt deformations and concrete pullout/breakout (Mander et al., 1996).
Figure 7.25: High-type fixed bearing specimen (Mander et al., 1996)
185
Figure 7.26: High-type fixed bearing, longitudinal model (Mander et al., 1996)
Figure 7.27: High-type fixed bearing, transverse specimen (Mander et al., 1996) Figure 7.28 and Figure 7.29 show the comparison between hysteretic behavior for the high-type fixed bearing specimens loaded in the longitudinal and transverse directions, respectively.
186
Figure 7.28: High-type fixed bearing, longitudinal model-test comparison
Figure 7.29: High-type fixed bearing, transverse model-test comparison
7.5.2. Elastomeric Bearings As discussed in Chapter 6, elastomeric bearings are a common type of bearings used in prestressed concrete girder and slab bridges, as well as modern steel bridges. Each component of the bearing system provides a distinct contribution to the system. The elastomeric pad transfers horizontal load via shear stiffness of the elastomeric pad and frictional resistance, and the steel dowels provide resistance through beam-type action. Therefore, the model for each component can be developed
187
separately and then applied in parallel to simulate the composite action, as was done in other bridge fragility studies (Nielson 2005). When subjected to a lateral loading, the bearing pad undergoes shear deformation with uniform elastic stiffness until the frictional resistance (Ff = μN) is exceeded, then the stiffness changes to nearly zero. The coefficient of friction used to determine the frictional resistance between bearing pad and concrete was obtained empirically with Eq (6.10). The initial stiffness is approximated with Eq. (6-9). Bridge bearing dowels are expected to stay elastic under service loads, but they can undergo significant inelastic deformation during a moderate seismic event, deforming as a cantilever beam. As discussed in Section 6.4.4.2, the dowel models developed by Choi (2002), which used detailed finite element models of a typical steel dowel used in the region to determine key response parameters, forms the basis of the dowel models in this study. Figure 7.30 present the model developed by Choi (2002) for 25.4 mm (1 in.) diameter steel dowel. As seen in the figure, the initial stiffness of each dowel was calculated to be 46 kN/mm (262.7 kip/in), and the estimated yield and ultimate strengths were approximately 56.0 kN (12.6 kip) and 58.0 kN (13.0 kip), respectively. Choi (2002) proposed that if a dowel diameter other than 1 in. is used, the strength and stiffness are assumed to be quadratically proportional.
Figure 7.30: Steel dowel analytical model (Choi, 2002) The combined elastomer shear deformation-friction model is added in parallel with the dowel hysteretic model. The behavior of the fixed elastomeric bearing is identical in the longitudinal and transverse directions. For expansion bearings, the gap is much larger in the longitudinal direction than the transverse direction because the slot is designed to accommodate translation. The stiffness and strength parameters, however, remain the same.
7.6. Bent Bearings transfer lateral loads from the superstructure to the bents at bridge intermediate supports, which adds to the flexibility of the structure. Numerical models of bridge bents (columns and bent caps) are presented in the following sections. As discussed earlier, the bent cap distributes the load 188
from the superstructure to the individual columns, which are attached to the pile or drilled shaft foundation. To model bridge bents, Nielson (2005) suggests the use of beam-column elements for columns and bent caps at their respective centroidal axes. Bent cap and column elements are connected using rigid links. Columns are susceptible to damage during an earthquake. Thus, models capable of simulating this nonlinear behavior are necessary and are described in more detail below.
7.6.1. Columns There are multiple approaches to modeling the nonlinear behavior of bridge columns (Figure 7.31) which include (a) concentrated plasticity models, (b) hinge region models, (c) fiber section models, and (d) 3D solid element models.
(a)
(b) (c) Figure 7.31: Column modeling approaches
(d)
The 3D solid finite-element model (Figure 7.31d) in which concrete as well as all reinforcing bars are modeled explicitly with solid elements with contact models that simulate bond-slip behaviorsis capable of modeling complex concrete column behavior including different failure modes; however, this approach is very complex and requires numerous assumptions and experimental data to accurately calibrate e. In addition, solid FEM models are significantly more computationally demanding, which is a big disadvantage when running many nonlinear response history analyses of full bridge systems, as required for fragility analysis. Therefore, 3D finite element models were not considered for use in this study. The distributed plasticity (Figure 7.31c) approach is a common method to model column behavior that has been used in previous bridge fragility studies (Nielson 2005) as it is capable of simulating coupled axial and flexural behavior by assigning fiber sections throughout a member. For the case of a reinforced concrete column, each section can be modeled with fibers that are assigned with uniaxial material models for concrete or reinforcing steel that are located according to the geometry of the cross-section and locations of longitudinal steel bars as shown in Figure 7.32.
189
Figure 7.32: Column fiber section (Nielson 2005) The models with nonlinear behavior governed by axial-flexural fiber cross-sections (Figure 7.31c) and predefined plastic hinge regions (Figure 7.31b) assume the column is able to reach its full moment capacity prior to shear failure and bar buckling. Such models are reasonable for those regions where columns are seismically detailed and capacity designed to avoid such non-ductile failure modes. However, the fiber-based models that simulate axial and flexural failure modes of bridge columns may not be appropriate for regions where seismic detailing has not been considered and other, less ductile failure modes are expected. As shown in Figure 7.33, typical column transverse reinforcement consists of a #3 spiral evenly spaced at 6-inch pitch. The longitudinal bars typically run straight into bent and pile caps with no hooks. Contrarily, modern seismic design involves tighter spiral spacing in plastic hinge regions (both ends of the column) for enhanced ductility, as well as anchorage of longitudinal and transverse reinforcement with hooks. Poor anchorage and light transverse reinforcement in non-seismically detailed bridge columns make them prone to a potential bar pullout or shear failure during a seismic event, which cannot be captured with either distributed or lumped plasticity approaches because fiber sections only account for axial-bending interaction.
190
Figure 7.33: Typical column reinforcement in Texas (TxDOT 1962) For this study, a lumped plasticity model (Figure 7.31a) is used, as it is the most computationallyefficient solution for the scope of the project. Columns are modeled with elastic beam-column elements with rotational springs (i.e., zero-length elements) at the top and bottom acting in two orthogonal directions (longitudinal and transverse). Each spring is assigned a nonlinear momentrotation behavior based on the section’s flexural and shear strength, as well as longitudinal reinforcement development length and splicing considerations. The column nonlinear spring behavior is primarily based on the work done by the ACI 369 committee (2016) for the ASCE 41-17 standard. The equations for nonlinear behavior were based on a large experimental database of columns of various sizes and steel reinforcement layouts (including low transverse reinforcement) with cyclic loading in single and double curvatures. The experimental database includes 319 rectangular and 171 circular column tests without lap-splices (Ghannoum and Sivaramakrishnan 2012a; b), as well as 39 rectangular columns with lap splices (Al Aawar 2015). The database includes column specimens that failed in flexure, flexure-shear, and shear. The generalized backbone curve used in ASCE 41 (2014) is shown in Figure 7.34. Line A-B represents initial elastic behavior, line B-C delineates a reduced stiffness response, line C-D represents a sudden loss of strength, and finally line D-E represents the spring behavior at a residual capacity prior to a column collapse at point E. To avoid convergence issues, as well as uncertainty about the slope of line C-D, strength degradation is assumed to occur linearly between points C and E, as shown in Figure 7.35.
191
Figure 7.34: Column backbone curve (ACI 2016)
Figure 7.35: Modified column backbone curve The backbone curves for these rotational springs represent moment-rotation behavior and are defined in ASCE 41 using the three parameters, anl, bnl, and cnl. The parameters anl and bnl describe column inelastic rotation capacities to the points that limit the hardening region and strength degradation respectively, whereas cnl represents residual capacity ratio. ACI (2016) provides different equations to define these parameters depending on whether the column is controlled by inadequate development/splicing or not. Table 7.1 outlines the nonlinear modeling parameters for both cases.
192
Table 7.1: Column nonlinear modeling parameters (ACI 2016)
Modeling Parameter anl (radians)
bnl (radians)
cnl
Not Controlled by Inadequate Development/Splicing 0.042 − 0.043
Controlled by Inadequate Development/Splicing
𝑉𝑉𝑦𝑦𝑦𝑦 𝑁𝑁𝑈𝑈𝑈𝑈 + 0.63𝜌𝜌𝑡𝑡 − 0.023 ≥ 0.0 ′ 𝐴𝐴𝑔𝑔 𝑓𝑓 𝑐𝑐𝑐𝑐 𝑉𝑉𝑂𝑂𝑂𝑂
0.5
𝑁𝑁𝑈𝑈𝑈𝑈 1 𝑓𝑓 ′ 𝑐𝑐𝑐𝑐 5+ 0.8𝐴𝐴𝑔𝑔 𝑓𝑓 ′ 𝑐𝑐𝑐𝑐 𝜌𝜌𝑡𝑡 𝑓𝑓𝑦𝑦𝑦𝑦𝑦𝑦 0.24 − 0.4
− 0.01 ≥ 𝑎𝑎𝑛𝑛𝑛𝑛
𝑁𝑁𝑈𝑈𝑈𝑈 ≥ 0.0 𝐴𝐴𝑔𝑔 𝑓𝑓 ′ 𝑐𝑐𝑐𝑐
0.0 ≤
1 𝜌𝜌𝑡𝑡 𝑓𝑓𝑦𝑦𝑦𝑦𝑦𝑦 ≤ 0.02 8 𝜌𝜌𝑙𝑙 𝑓𝑓𝑦𝑦𝑦𝑦𝑦𝑦
𝑎𝑎𝑛𝑛𝑛𝑛 ≤ 0.012 − 0.085
𝑁𝑁𝑈𝑈𝑈𝑈 + 12𝜌𝜌𝑡𝑡 ≤ 0.06 𝐴𝐴𝑔𝑔 𝑓𝑓 ′ 𝑐𝑐𝑐𝑐
0.15 + 36𝜌𝜌𝑡𝑡 ≤ 0.4
where Ag is Gross cross-sectional area; f’cE is Expected concrete compressive strength; fylE is expected yield strength of longitudinal reinforcement; fytE is expected yield strength of transverse reinforcement; NUD is member axial force; VyE is shear demand at expected flexural yielding of the column; VOE is expected shear strength of the column; ρl is Longitudinal reinforcement ratio; ρt is Transverse reinforcement ratio. Expected strength is defined as the mean value of strength of a component at the deformation level anticipated for a population of similar components considering the variability in material strength as well as strain-hardening and plastic section development. For reinforced concrete f’cE = 1.5f’c, fylE = 1.25fyl, fytE = 1.25fyt, where fc, fyl, fyt are nominal concrete compressive strength, longitudinal reinforcing steel yield strength, and transverse reinforcing steel yield strength, respectively (ACI 2016). To calculate the shear demand at expected flexural yielding of the column, it is required to know the expected deformed shape (i.e., the boundary conditions) of the column to determine the moment-shear relationship. For simplicity, two limiting cases are considered, single curvature and double curvature. Moment-shear relationships can be established using structural analysis and assumed fixed or pinned end conditions as shown in Figure 7.36. For single curvature V=M/L, whereas for double curvature V=2M/L, where V = shear (constant along the column length), M = bending moment at the end(s) of the column, L = column length. As mentioned previously, the assumption of single curvature for column longitudinal deformation and double curvature for transverse deformation is reasonable for multi-column bents (Aviram et al. 2008).
193
a) single curvature
b) double curvature Figure 7.36: Flexural member stiffness coefficients
To determine whether or not the column is controlled by inadequate development/splicing, the ACI (2016) equation for maximum stress that can be developed in anchored or spliced reinforcement (fs) can be used as shown in Eq. (7-9). If fs = fy, then the column is not controlled by inadequate development/splicing. if fs < fy, longitudinal bars cannot develop their full yield strength and therefore the column is controlled by inadequate development/splicing. In addition, in that case steel yield strength is limited to the value of fs. 2� 3
lb fs = 1.25 � � ld
fyL ≤ 𝑓𝑓𝑦𝑦
(7.9)
where fy is yield strength of longitudinal reinforcing steel (lower-bound or expected); fyL is lowerbound yield strength of longitudinal reinforcing steel; ld is development length of reinforcing steel; lb is available length of straight development, lap splice, or standard hook. Chapter 25 of the ACI 318-14 (2014) standard defines development length (ld) as the length required for reinforcement to be embedded in order to develop sufficient bond between concrete and steel to achieve full yield strength of the reinforcement, as shown in Eq. (7.10). 𝑙𝑙𝑑𝑑 =
3 𝑓𝑓𝑦𝑦 𝛹𝛹𝑡𝑡 𝛹𝛹𝑒𝑒 𝛹𝛹𝑠𝑠 𝑑𝑑 40 𝜆𝜆�𝑓𝑓′𝑐𝑐 �𝑐𝑐𝑏𝑏 + 𝐾𝐾𝑡𝑡𝑡𝑡 � 𝑏𝑏 𝑑𝑑𝑏𝑏
(7.10)
where cb is lesser of the distance from center of a bar to nearest concrete surface and one-half the center-to-center spacing of bars or wires being developed; db is bar diameter; Ktr is transverse reinforcement index defined in the following equation: 𝐾𝐾𝑡𝑡𝑡𝑡 =
40𝐴𝐴𝑡𝑡𝑡𝑡 𝑠𝑠𝑠𝑠
(7.11)
where Atr is area of transverse reinforcement; s is spacing/pitch of transverse reinforcement; n is number of bars developed/spliced at the same location. Additionally, the confinement term (cb + Ktr)/db shall not exceed 2.5. For the calculation of development length, modification factors shall be in accordance with ACI 318 (2014) values outlined in Table 7.2.
194
Table 7.2: Modification factors for development length (ACI, 2014)
Condition
Value
Lightweight concrete
0.75
Normalweight concrete
1.0
Epoxy-coated or zinc and epoxy dual-coated reinforcement with clear cover less than 3db, or clear spacing less than 6db
1.5
Epoxy-coated or zinc and epoxy dual-coated reinforcement for all other conditions
1.2
Uncoated or zinc-coated (galvanized) reinforcement
1.0
No. 7 and larger bars
1.0
No. 6 and smaller bars and deformed wires
0.8
More than 12 in. of fresh concrete placed below horizontal reinforcement
1.3
Other
1.0
As mentioned previously, ACI (2016) depicts column plastic deformation and damage as a moment-rotation behavior. The strength parameters, i.e., the y-axis values of the points B, C, and E on the backbone curve (Figure 7.35) are moment values. In cases when flexural strength controls the capacity of the column, point B represents nominal column moment strength (Mn). The ordinate value of point E is equal to the moment at point B multiplied by cnl. Slope B-C approaches the value of probable moment strength (Mpr) at a rotation of 0.04 radians; however, the backbone curve is very unlikely to reach that point because the plastic rotation is limited by anl. ACI 318 (2014) defines Mpr as a probable flexural capacity with a tensile stress of longitudinal bars taken as 1.25fy. It is important to note that the reinforcement yield capacity is still limited by fs, which itself is a function of a lower-bound yield strength. Flexural or flexure-shear failure may not always control the failure mechanism, as is the case for a column with limited transverse reinforcement, which is prone to fail in shear; therefore, the column strength also needs to be limited by the column’s shear capacity. ACI (2016) determines column shear strength (Vcol) as follows: 𝐴𝐴𝑡𝑡𝑡𝑡 𝑓𝑓𝑦𝑦𝑦𝑦 𝑑𝑑 6�𝑓𝑓′𝑐𝑐 𝑁𝑁𝑈𝑈𝑈𝑈 𝑉𝑉𝑐𝑐𝑐𝑐𝑐𝑐 = 𝛼𝛼𝑐𝑐𝑐𝑐𝑐𝑐 � � + λ� 1+ � 0.8𝐴𝐴𝑔𝑔 � 𝑠𝑠 𝑀𝑀𝑈𝑈𝑈𝑈 ⁄𝑉𝑉𝑈𝑈𝑈𝑈 𝑑𝑑 6�𝑓𝑓′𝑐𝑐 𝐴𝐴𝑔𝑔
(7.12)
where d is effective depth of column reinforcement; MUD/VUD is largest ratio of moment to shear developed in the column; and αcol is 1.0 for s/d ≤ 0.75 and 0.0 for s/d ≥ 1.0. αcol varies linearly from 1.0 to 0.0 for 0.75 ≤ s/d ≤ 1.0 If the column nominal shear capacity is less than the shear demand at the nominal flexural capacity, it is considered to be shear-controlled. In this case, the ordinate of point B on the moment-rotation
195
backbone curve (Figure 7.35) is equal to the moment expected at the nominal shear strength, and the column never reaches flexural yielding. Unlike flexural yielding, no hardening is assumed for a shear failure mode; therefore, the slope of line B-C is zero. For computational purposes, due to the fact that zero slope may cause convergence issues, the slope was assigned a low non-zero number. The equations for anl and bnl remain the same for both flexure- and shear-controlled cases. However, both variables depend on the amount of column transverse reinforcing and, therefore, will be lower for columns controlled by shear failure. Through the inspection of TxDOT bridge plans and typical details, it was determined that a vast majority of the multi-column bents were built with circular concrete columns (Figure 7.33); therefore, only circular column sections were considered in this study. Determination of flexural capacity of a circular section was determined through a fiber section analysis, where the column dead load is considered for axial-flexural interaction. After flexural and shear capacities, as well as associated plastic backbone rotations are calculated using the aforementioned procedures, the column lumped plasticity model can be constructed. The column assembly (Figure 7.37) consists of an elastic beam-column element with zero-length moment-rotation springs at the ends. The elastic beam-column element requires input of two end nodes, cross-sectional area (A), elastic (E) and shear (G) moduli, torsional constant (J), flexural moments of inertia in both directions (Iz and Iy), and a function related to element coordinate transformation. Elastic modulus (E) of steel girders are assumed to be 29,000 ksi. For concrete material, the elastic modulus is obtained per ACI 318 (2014) equation, as follows: 𝐸𝐸 = 57000�𝑓𝑓′𝑐𝑐
(7-13
Shear modulus for both materials, i.e., steel and concrete, are obtained using the following equation: 𝐸𝐸 (7-14) 𝐺𝐺 = 2(1 + 𝑣𝑣) where ν = Poisson’s ratio, and is set to be 0.3 for steel and 0.15 for concrete.
Post-peak crushing strength of concrete (f’cu) is assumed to be zero. Concrete strain at maximum strength, according to Kent and Part (1971), is taken as a ratio of twice the compressive strength divided by concrete secant modulus as follows: 𝜀𝜀𝑐𝑐 =
2𝑓𝑓′𝑐𝑐 𝐸𝐸
(7.15)
where f’c in Equation shall be used in psi. Concrete crushing strain is assumed to be 0.003, a typical value used in reinforced concrete design. Confined concrete compressive strength (f’cc) and corresponding strain (εcc) are calculated based on Mander et al. (1988) equations, which is shown in Eq. (8.5). Concrete crushing strength is
196
assumed to be zero as well, while crushing strain is scaled by the ratio of εcc/εc. The latter value is not particularly important for the pushover analysis where finding flexural capacity (Mn) is the primary interest, and the outer unconfined portion of the section will reach crushing strength first. 𝑓𝑓𝑐𝑐𝑐𝑐 = 𝑓𝑓𝑐𝑐 �−1.254 + 2.254�1 +
7.94𝑓𝑓 ′ 𝑙𝑙 𝑓𝑓 ′ − 2 𝑙𝑙 � 𝑓𝑓𝑐𝑐 𝑓𝑓𝑐𝑐
𝑓𝑓𝑐𝑐𝑐𝑐 𝜖𝜖𝑐𝑐𝑐𝑐 = 𝜖𝜖𝑐𝑐 �1 + 5 � − 1�� 𝑓𝑓𝑐𝑐
(7.16)
(7.17)
where fl’, which is refer to lateral confining pressure can be computed as follows: 1 𝑓𝑓 ′ 𝑙𝑙 = 𝐾𝐾𝑒𝑒 𝜌𝜌𝑠𝑠 𝑓𝑓𝑦𝑦𝑦𝑦 2
(7.18)
𝑠𝑠𝑐𝑐𝑐𝑐𝑐𝑐𝑐𝑐𝑐𝑐 2𝑑𝑑𝑐𝑐𝑐𝑐𝑐𝑐𝑐𝑐 (7.19) 𝐾𝐾𝑒𝑒 = 1 − 𝜌𝜌𝑐𝑐𝑐𝑐 where ρs is the ratio of the volume of transverse confining steel to the volume of concrete core; Ke is confinement coefficient; sclear is clear spacing between transverse reinforcement; dcore is diameter of concrete core within transverse reinforcement; ρcc is ratio of the volume of longitudinal steel to the volume of concrete core. 1−
Figure 7.37: Column model The rotational springs are meant to simulate the plastic rotation behavior of the column. The elastic portion of the rotational lumped plasticity spring backbone is supposed to be rigid theoretically, allowing all deformations to come only from the elastic beam-column element. However,
197
numerically simulating rigidity with a very high stiffnesses approaching infinity can create difficulties in convergence. Instead, the elastic portion of the backbone curve was set to span from -0.1θy to 0.1θy, where θy is rotation associated with reaching nominal moment or shear capacity (whichever happens first) based on the preliminary column pushover analysis. To compensate for the additional flexibility provided by the elastic rotational capacity of the springs, the modulus of elasticity of the elastic beam-column element was increased by a factor of 1/(1 - 0.1) = 1.11. Once the column reaches its rotational capacity, the backbone curve input for the material model is defined according to anl, bnl, and cnl per ACI (2016). A sample column rotational spring pushover curve is shown in Figure 7.38.
Figure 7.38: Sample column backbone curve In addition to backbone parameters, the nonlinear models for the springs also requires to input parameters that will control column unloading, pinching, and damage parameters. There is no definitive theoretical approach or analytical model that defines all of the unloading and reloading parameters for reinforced concrete, mainly due to variability of the cyclic behavior of damaged reinforced concrete members. Therefore, these parameters were calibrated based on available column testing data from the literature. The datasets used for calibration were based on experimental cyclic pushover tests performed by various researchers that were compiled into databases for unspliced column specimens by Ghannoum & Sivaramakrishnan (2012a; b) and spliced column specimens by Al Aawar (2015). Those tests include columns loaded in both single and double curvature. Based on geometric and material properties of each test specimen, lumped plasticity column models were created to simulate their behavior according to ACI (2016) backbone curve provisions. Additionally, the nonlinear column specimen models were subjected to the cyclic displacement histories for their respective tests in OpenSees. Finally, load-displacement hysteresis curves from the experiment and from the numerical model were compared to each other to calibrate the model hysteresis parameters.
198
The main criterion that was used for calibration of unloading, damage, and pinching parameters was energy dissipation capacity of the column, which is equal to the area under the hysteresis. Additionally, the maximum strength of the column test specimen and numerical model were compared to determine whether the ACI (2016) approach underestimates or overestimates the actual capacity. A sample comparison of a column test and results from a nonlinear pushover analysis for a column specimen that failed in shear is shown in Figure 7.39. It is impossible to define material parameters that will perfectly fit results from every specimen of the data set; therefore, an approach was chosen that resulted in slightly underestimated column energy dissipation compared to the test data. This approach was used since the nonlinear analyses are intended to evaluate bridge system damage, and the underestimation of energy dissipation is expected to produce worst case estimations for displacement-based column damage states. The column load-deformation data from the 71 different circular flexure-shear- and shear-critical column tests conducted by different researchers was found to vary significantly from specimen to specimen; however, one clear observation was made that shear-critical columns (as shown in Figure 7.39) typically have significantly more pinching than the flexure-controlled columns, as shown in Figure 7.40.
Figure 7.39: Column testing vs. modeling hysteresis (shear controlled)
199
Figure 7.40: Column testing vs. modeling hysteresis (flexure-controlled) Numerous values for pinching and damage factors were evaluated against the experimental data using a trial and error approach until acceptable results (lowest variation and reasonable underestimation of energy dissipation) were obtained.
7.6.2. Bent Caps Bent caps are significantly stiffer than the columns below and are not expected to exhibit inelastic behavior under lateral loading; therefore, the bent caps are modeled with linear elastic beamcolumn elements. The maximum moment demands developed in the bent cap elements were compared to their flexural capacity to verify this assumption following the response-history analyses. Gross flexural moments of inertia are multiplied by a factor of 0.5 per ACI (2016), and gross torsional constant is multiplied by 0.2 per Caltrans (2013) to account for reduced stiffness due to cracking.
7.7. Foundation Bridge columns extend down to foundations embedded into soil. There are two ways to model foundation behavior: (1) the direct method involves a finite element model that explicitly considers soil-structure interaction, and (2) the substructure simplified method, which simulates soil and foundation behavior via a set of translational and rotational springs (Nielson 2005). Usage of idealized pinned or fixed foundation supports to model foundations is discouraged because those
200
supports are not able to capture the effects of soil flexibility and energy dissipation (Aviram et al. 2008). An example of the direct method is a nonlinear Winkler foundation (dynamic p-y) analysis. In such an analysis, piles are modeled explicitly as beam-column elements, and the soil-structure interaction is approximated through a set of nonlinear p-y springs acting transverse to the pile. Py spring behavior can be simulated using backbone parameters for sand and clay soils based on experimental testing by Boulanger et al. (1999). The properties of each spring depend on the pile length tributary to it; therefore, any number of springs can be applied throughout the pile height. A greater number of springs increases accuracy of the analysis, but also increases the computational demand due to a greater number of degrees of freedom in the model. Pile vertical response due to friction can be modeled through a set of nonlinear springs applied longitudinally along the pile (t-z method). Pile bearing is modeled with vertical spring applied at the tip of the pile (Q-z method). The overall element assembly is shown in Figure 7.41.
Figure 7.41: Winkler Foundation Model (McGann et al. 2011) The direct method is computationally expensive because it significantly increases the number of degrees of freedom in the model (e.g., multiple nodes per pile) and involves plastic deformations in numerous spring elements. It is a good approach to use for specific bridge models where foundation details and soil properties are known. However, for the large number of generic bridge samples used in this study to represent many bridges across the state, such computational cost is not justified based on the uncertainty and variability in soil and foundation properties and details needed to define the different model components. As a result, the substructure simplified method was used in the study.
201
Similar to the bearing models described in Section 7.5, foundation behavior was modeled in this study using a nonlinear translation springs, where rotational degrees of freedom are assumed to be fixed. The foundation model proposed by Choi (2002) was used to simulate pile/shaft behavior. The elastic translational stiffness is based on the pile/shaft configuration as described in Section 6.4.3.3. The displacement corresponding to a pile/shaft reaching its maximum capacity is taken as 1 in. (Nielson 2005). The foundation behavior was approximated as a tri-linear curve. The demands at first yield was assumed to occur at 30% of the ultimate deformation and 70% of the ultimate strength (Choi 2002). Figure 7.42 shows a sample pile/shaft hysteresis curve with 40 kip/in effective stiffness. Similar to the bearing models and consistent with pile/shaft modeling in past fragility studies (Choi 2002; Nielson 2005), the behavior is assumed to be fully pinched, the unloading slope is assumed to be equal to the elastic stiffness, and no reloading stiffness degradation was considered. For the foundations under bridge bents, only the pile/shaft resistance is considered, and soil resistance is neglected due to relatively low pile/shaft surface area. At the abutment foundations, on the other hand, the resistance of the soil at abutments in the longitudinal direction cannot be ignored due to large abutment-soil interface; therefore, soil resistance is considered in addition to the pile/shaft resistance. The numerical model for abutments, including the soil resistance, is presented in the section below.
Figure 7.42: Pile/shaft element hysteresis
7.8. Abutment Abutment behavior was modeled using nonlinear translational springs placed in parallel, with one representing soil resistance and the other representing pile/shaft resistance as shown in Figure 7.43. The multi-linear model used by Choi (2002) is employed in this project for the passive soil
202
resistance. All strength and deformation values used to define the model are based on the soil elastic stiffness, ultimate soil pressure, and ultimate soil displacement. The approach used in this study, based on the Choi (2002) model, simplifies nonlinear soil force-deformation behavior to a quad-linear curve (i.e., a backbone curve described by four linear segments in the negative direction). The multi-linear material model available in OpenSees, however, is only able to simulate a tri-linear relationship; therefore, the approach used by Choi (2002) was modified to use only three linear segments to define the backbone response. The post-yielding behavior was truncated, as shown in Figure 7.44. This modification slightly underestimates the soil energy dissipation capacity compared to the proposed Choi (2002) model; however, there is insufficient experimental data to justify any other simplification of the quad-linear backbone curve.
Figure 7.43: Abutment models (Nielson, 2005)
Figure 7.44: Modified soil model The soil backbone curve is only defined in the negative (passive) direction. Soil is assumed to have no active resistance due to its negligible tensile strength; therefore, negligible strength values were assigned for the material in the positive direction. The nonlinear soil behavior was only used for
203
the springs in the longitudinal direction, and soil passive resistance in the transverse direction was ignored. Figure 7.45 shows an example hysteresis curve for a 30-ft-wide abutment with a height of 10 ft, and coarse cohesionless soil conditions.
Figure 7.45: Abutment soil element hysteresis
7.9. Assembly Each of the previously described components are assembled into a full bridge model based on the randomly sampled geometry and material properties described in Chapter 6. A model schematic for continuous bridges is shown in Figure 7.46, and a model schematic for simply-supported bridges is shown in Figure 7.47. As described earlier, bridge girders, bent caps, and columns are modeled using beam-column elements with material and cross-sectional properties assigned corresponding to the bridge members they represent to simulate their associated mass and stiffness. Elements are located at their respective centers of mass to accurately represent distribution of mass along bridge height. Inherently, this modeling approach results in separation between the girder, bent cap, and column elements in the vertical direction. Therefore, connectivity of those elements was ensured by usage of rigid links. Nonlinearity effects in the columns, bearings, abutments, foundations, and joints are modeled in OpenSees using translational and rotational nonlinear spring (i.e., zero-length) elements in both longitudinal (L) and transverse (T) directions; no nonlinear vertical springs were used in the model.
204
205 Figure 7.46: Model schematic for a continuous bridge
206 Figure 7.47: Model schematic for a simply-supported bridge
Figure 7.48 depicts the spring layout used at the bottom of column elastic elements. The assembly involves three nodes (labeled as bottom hinge, bottom end, and fixed nodes) located at the exact same coordinates, though shown at different locations in the figure for clarity. The column hinge node, which is located at the end of elastic column flexural element, is connected to the column end node via zero-length rotational springs representing nonlinear column plastic rotation and degrading behaviors in the longitudinal and transverse directions (refer to Section 7.7). All other degrees of freedom (rotation about column axis and all three displacements) were constrained, i.e., not allowing any relative displacements and rotations in directions where the springs do not act, preventing any instability issues in the model. The column end node is connected to the fixed node via translational (longitudinal and transverse) springs, simulating the foundation behavior. Degrees of freedom not affected by the springs (vertical displacement and all three rotations) were constrained. As implied by its name, all six degrees of freedom of fixed node are restrained from movement.
Figure 7.48: Element layout at column bottom Figure 7.49 shows the spring layout at the top of column elastic elements. Similar to the column bottom layout, it involves rotational springs acting in longitudinal and transverse directions simulating column behavior once it exceeds its elastic capacity. Similar to bottom columns, translations as well as rotations about columns axis were constrained to be equal at the two column nodes. Due to the fact that the column top and the bent caps centers of mass are located at different heights, those two nodes are connected with a rigid link.
207
Figure 7.49: Element layout at column top Figure 7.50 shows the spring layout at bent locations for continuous bridges. It involves flexural elements representing bridge girders located at their center of mass locations. Nodes with lumped tributary deck mass are located above girder nodes at a vertical location representing the deck center of mass, and the two nodes are connected via a rigid link. Additionally, a rigid link is used to tie the nodes representing the center of girder mass and girder bottom (top bearing node). Bearing nodes are connected with two sets of nonlinear springs in both horizontal directions, one representing bearing bilinear behavior and the other representing hysteretic restraining behavior as described in Section 7.5. The springs are connected in parallel, which indicates that they have equal displacements but unequal forces. Hence, their stiffnesses are added together. In cases where restraining mechanisms are not provided in the bearing (e.g., for steel rocker bearings in the longitudinal direction), only the bilinear springs are used. The top and bottom bearing node constraints include vertical translation, as well as rotation in the transverse direction and rotation about the vertical axis. Rotation in the longitudinal direction was not constrained because bearings are usually designed to allow in-plane girder rotation. The bottom bearing node is connected to the bent cap center of mass via a rigid link.
Figure 7.50: Element layout at bent for a continuous bridge Figure 7.51 shows the element assembly at bent locations for simply-supported bridges. In this case, girder elastic elements are not connected to each other, enabling bridge spans to move independently from each other. However, as the bridge joint gap closes, the impact spring is engaged, simulating deck pounding effects as described in Section 7.4. The impact deck stiffness is assumed to be equally divided among girders. The joint impact spring only acts in the
208
longitudinal direction; thus, no resistance is provided by the element in the transverse direction. Both bearings under each simply-supported girder are attached to the same bent cap node.
Figure 7.51: Element layout at bent for a simply-supported bridge Figure 7.52 displays the element layout at the abutment locations. Similar to the bent locations, the girder element node is tied to the deck and bearing nodes via rigid links. In addition to bilinear and hysteretic elements representing bearing behavior, a longitudinal impact spring is added in parallel, representing the gap between deck and abutment back wall. Once that gap is closed, the superstructure can no longer move relative to the abutment without deck pounding. Resistance in the transverse direction is provided only by bearing elements. The bearing and impact spring assembly at the abutment is connected in series to foundation and abutment springs, which are acting in parallel. Foundation and abutment soil stiffnesses, based on the number and size of piles and/or shafts under the abutment and the back wall width, are assumed to be equally distributed among girders. As previously discussed, soil passive resistance is only assumed to be acting in the longitudinal direction; therefore, there is no transverse abutment spring in the layout. Vertical translations and all rotations were constrained between the spring nodes.
Figure 7.52: Element layout at abutment
209
As discussed earlier in Section 7.3, the rigid diaphragm assumption is used for the superstructure. Additionally, rigid diaphragm constraints are assigned to the nodes below the bearings at each abutment. This constraint is done for the purpose of preventing relative motion between bottom bearing nodes, which are meant to be representing abutment seats. If no constraint is assigned to those nodes and two adjacent bearings have different stiffnesses (e.g., bearings under the exterior girder have a dowel and bearings under the interior girder do not), the bottom bearing nodes will translate independently from each other, which is not representative of abutment seat behavior. For the model developed, abutments are assumed to act as a rigid body; therefore, the bottom bearing nodes can translate or rotate as a rigid body with the abutment seat. For dynamic analyses, the initial time step for response-history analysis is set at 0.001 seconds, which is shorter than the time step in typical ground acceleration records used in this project (0.01-0.025 seconds); therefore, no ground motion acceleration data is lost due to time step being too large. Additionally, the implicit Newmark average acceleration time-stepping method, unlike some of its alternatives, is unconditionally stable, meaning it does not have an instability issue due to analysis time step being too large relative to structure’s natural period. The presence of numerous nonlinear spring elements with different loading and unloading stiffnesses, yield strengths, hardening, and degradation parameters makes the model prone to convergence issues. The Newmark-Raphson nonlinear algorithm is used to find a converged state at each analysis step; however, several techniques are implemented to address convergence issues that may arise during a response-history analysis. Firstly, the script contains if-statements which gradually reduce the time step to 1/100 of the initial value. If reducing the time step does not produce a converged solution for that analysis step, the analysis uses different solution algorithms to solve the nonlinear equations of motion including Modified Newton-Raphson, Krylov-Newton, and Broyden solution algorithms. If neither reducing the time step nor changing the nonlinear solution algorithm helps to find a converged state in that analysis step, the script tries one small linear (explicit) analysis step using stiffness values calculated during the last successfully converged step. After the small linear analysis step, the analysis returns to the implicit NewtonRaphson algorithm for future analysis steps. Because using a linear analysis step can result in the structure being in an unrealistic (i.e., not in equilibrium) state; results from an analysis that required a linear analysis step should be carefully reviewed to determine if the response is reasonable. In some instances, a small linear step is needed to get through a particularly tough situation in terms of convergence, after which the implicit methods can resume finding converged solutions for subsequent analysis steps. If the model does not go back to convergence after one linear step, the analysis stops.
7.10. Example Nonlinear Time-History Analysis To demonstrate the results that can be obtained from a nonlinear response-history analysis, a sample bridge model and ground motion were assumed for a demonstration. A three-span simplysupported steel girder bridge was chosen. The length of the approach spans is 27 ft and the length of the main span is 37 ft. The superstructure consists of five W18x130 steel girders and a 40-ftwide 8-in.-thick non-composite concrete deck. Each bent consists of three 30-in-diameter, 20.4-ft210
tall circular concrete columns tied together by concrete bent caps. Steel bearings were used in the model, with high-type fixed bearings at one end of the simply-supported spans, and high-type rocker bearings at the opposite end. Drilled shafts are used for foundations under both abutments and bents. Schematic drawing for the model is shown in Figure 7.53. Note, only elastic flexural elements (girders, bent caps, and columns) located at their respective centers of mass are shown in the figure. The connectivity is provided through zero-length elements and rigid links, not shown on the drawing.
Figure 7.53: Bridge model schematic Prior to execution of response-history analysis, an eigenvalue analysis was performed in order to obtain natural periods and mode shapes of the structure. Figure 7.54 shows the mode shape corresponding to the longest period of the structure (0.51 s). The displacements were deliberately amplified to make the mode shapes more prominent and do not represent realistic bridge deformations expected from seismic loading. Note, beam-column elements, are defined in the figure by drawing straight lines between two end nodes of a member. In the actual OpenSees model, flexural elements are assigned using appropriate finite-element shape functions, and internally simulate flexural deformations in elements. For the case of this bridge, the lowest mode of vibration is deck transverse displacement.
211
Figure 7.54: Bridge mode shape, transverse displacement (Period = 0.51 s) Figure 7.55 shows the mode shape for the deck longitudinal direction movement. The natural period of this mode is 0.39 s. In this case, deck support stiffnesses are symmetric in the direction parallel to the translation, resulting in no deck rotation. Figure 7.56 shows the mode shape associated with bent out-of-phase transverse displacement, resulting in rotation of the middle span. The approach spans, on the other hand, translate without any rotation. The natural period of this mode is 0.35 s.
212
Figure 7.55: Bridge mode shape, longitudinal translation (Period = 0.39 s)
Figure 7.56: Bridge mode shape, rotation (Period = 0.35 s) A ground motion time-history (shown in Figure 7.57) recorded during the 1994 Northridge earthquake was selected for this demonstration analysis (McKenna et al., 2006). The ground motion was applied at a 45-degree angle to the bridge span direction to invoke both longitudinal and transverse bridge deformations. The amplitude of the record was scaled by a factor of two, resulting in a maximum PGA of 0.84g to induce inelastic deformations in the nonlinear springs for demonstration purposes.
213
Figure 7.57: Sample ground motion history Figure 7.58 shows the deck displacement response-history for all three bridge spans in the longitudinal direction. The displacement values are taken as the average displacements of the deck nodes over the middle girder at both ends of the spans. As evident in the figure, the simplysupported spans translate mostly in-phase with each other with similar periods of motion, though they have different amplitudes.
Figure 7.58: Deck displacement response-history (longitudinal direction) Figure 7.59 shows the deck displacement response-history of the spans in the transverse direction. The transverse response has similar trends to the response in the longitudinal direction, except the period of vibration is noticeably higher, which is expected because the bridge natural period is longer in the transverse direction. Figure 7.60 shows the deck rotation response-history throughout the ground excitation. As shown in the plot, all three deck spans underwent small amounts of in214
plane rotation, including the middle span, which shows contribution of the third (rotational) mode to the overall bridge response. However, the amount of middle span rotation is negligible after the strong shaking phase (amplitudes less than 0.5g).
Figure 7.59: Deck displacement response-history (transverse direction)
Figure 7.60: Deck rotation response-history
215
The displacement response-history is a general indicator of global bridge behavior; however, it does not provide any information about a structure’s state of damage. To assess the bridge condition, the level of inelastic deformation, or lack thereof, needs to be quantified. For the models developed for this project all nonlinear effects are simulated with lumped plasticity (zero-length) springs. Each spring (column, bearing, foundation, etc.) needs to be assessed individually and the amount of inelastic deformation needs to be compared to selected limit states representing the levels of slight, moderate, extensive, and complete damage, which are described in detail in Chapter 8.4. The bridge columns used in the example model were found to be flexure-controlled as previously described in Section 7.6.1. Figure 7.61 shows hysteretic plots of one of the bottom column springs in the longitudinal and transverse directions. Both springs exceeded their elastic capacities. The plastic rotation was higher in the longitudinal direction than in the transverse direction. Figure 7.62 displays hysteretic plots for one of the top column springs in both directions. The top longitudinal spring reached significantly lower moment demands compared to the bottom spring, confirming the initial assumption that bridge columns bend primarily in single curvature in the longitudinal direction. The moment demand in the top and bottom column springs in the transverse direction are more similar, though not equal, supporting the assumption that the column responds in double curvature in the transverse direction. Based on the plots in Figure 7.61 and Figure 7.62, hinging only occurred at the bottom of the column as indicated by the springs’ nonlinear response.
Figure 7.61: Column bottom spring hysteresis
Figure 7.62: Column top spring hysteresis
216
Figure 7.63 displays the bearing bilinear spring response of one of the fixed bearings located at abutment. For the case of high-type fixed bearings, the bilinear spring represents prying behavior of masonry plate on rubber pad in both directions. Figure 7.64 shows the hysteretic response of the hysteretic element at the same bearing location in the longitudinal and transverse directions acting in parallel with the bilinear springs. In this case, the hysteretic spring represents resistance and deformation of bearing anchor bolts, which are shown to exhibit inelastic behavior in both directions in this demonstration analysis.
Figure 7.63: Fixed bearing bilinear spring hysteresis
Figure 7.64: Fixed bearing hysteretic spring hysteresis The following two figures present the response of one of the rocker expansion bearings on the opposite end (attached to the bridge bent) of the span for which the fixed bearing behavior was just shown. Figure 7.65 shows the bilinear spring response, where the behavior in the longitudinal direction represents rocking of the bearing, and the behavior in the transverse direction represents masonry plate prying. Figure 7.66 shows the behavior of the hysteretic element. Because there is no restraint in rocker bearings in the longitudinal direction, only the transverse restraint spring is used. The expansion bearings at the bent location experienced relatively small displacements in the transverse direction with the hysteretic element remaining elastic.
217
Figure 7.65: Rocker bearing bilinear spring hysteresis
Figure 7.66: Rocker bearing hysteretic spring hysteresis Figure 7.67 shows the impact spring response at both abutment locations. As evident in the figure, 1-in. gaps between deck and backwall were fully closed during the excitation. The impact force, however, was not high enough to exceed elastic capacity of the springs, meaning there was no concrete spalling caused by pounding. Figure 7.68 shows the longitudinal backwall soil resistance at both abutment locations. As shown, the soil backfill at one of the abutments experienced inelastic behavior.
Figure 7.67: Impact spring hysteresis
218
Figure 7.68: Abutment soil spring hysteresis Figure 7.69 depicts behavior of a drilled shaft under one of the abutments, experiencing inelastic behavior in both orthogonal directions. Figure 7.70 shows the drilled shaft behavior under a bent column. Similarly, both springs experienced inelastic deformations.
Figure 7.69: Abutment shaft spring hysteresis
Figure 7.70: Bent shaft spring hysteresis
7.11. Model Properties of Representative Bridges In the following, the fundamental period and mode shapes of the sampled bridges (see Section 6.5 for details) are discussed. The natural frequency of a system is an inherent property of the system that is dependent only on the initial stiffness of the structure and its seismic mass. It is not dependent on the load function. The natural period of a structure can be used to approximate peak
219
force and displacement demands using ground motion and/or design response spectra with other simplifications to account for multiple mass degrees of freedom and nonlinear effects (Chopra 2012).
7.11.1. Steel Girder Bridges Table 7.3 present the fundamental periods for steel girder bridges, i.e., MCSTEEL and MSSTEEL classes. In particular, this table shows the minimum, average, and maximum of the fundamental (i.e., first mode) periods of the eight bridges that are generated for each bridge geometric configuration. Detailed information on the geometric configurations of MCSTEEL and MSSTEEL bridges can be found in Table 6.17 and Table 6.18, respectively. As seen in the table, the fundamental translational period of MCSTEEL bridges varies between 0.32 second and 0.80 second. According to Table 6.17, these values are associated with bridge configurations that have the shortest and longest span lengths. In fact, by investigating the effect of the geometric and material parameters on the natural period of the bridges, it is found that the span length is the most important factor, which is mainly because of the fact that span length controls the amount of the mass of the bridges. Therefore, longer span lengths tend to result in larger masses, without significant changes in lateral stiffnesses. It is worth noting that by looking into the mode shapes of the bridges in this class, the longitudinal translation mode (similar to the one shown in Figure 7.55, is the fundamental mode for the majority of the bridge models; however, some of the bridge models have a fundamental mode shape representative of transverse direction translation (similar to the one shown in Figure 7.54). For MSSTEEL bridge classes, Table 7.3 shows that the fundamental period varies between 0.26 and 0.42 second. Although the 0.42 second period is associated with the bridge geometric configuration that has the longest span length, the 0.26 second period is for geometric configuration number 5, which, according to Table 6.18, does not have the shortest span length. In fact, the span length (and thus the mass as described previously) is not the only factor that controls the fundamental period. For this bridge class, other parameters such as deck width (and thus number of columns), under clearance (and thus column height), as well as girder type and size have a significant effect on the bridge stiffness, and thus its period. Similar to the MCSTEEL class previously described, the fundamental (i.e., first) mode of the majority of MSSTEEL bridges are modes associated with longitudinal direction translation, Finally, it is worth noting that MSSTEEL bridges generally have lower periods compared to MCSTEEL bridges, which is mainly due to the fact that MCSTEEL bridges have continuous and longer spans, which results in more mass without significant changes in lateral stiffness.
220
Table 7.3: Fundamental period of steel girder bridges in the horizontal direction
Tn (second) Geometric Configurations 1 2 3 4 5 6 7 8
Min 0.32 0.46 0.42 0.42 0.30 0.49 0.37 0.70
MCSTEEL Average* 0.34 0.50 0.45 0.44 0.32 0.53 0.40 0.74
Max 0.36 0.52 0.47 0.49 0.34 0.57 0.44 0.80
Min 0.30 0.30 0.36 0.30 0.26 0.35 0.26 0.29
MSSTEEL Average* 0.32 0.32 0.39 0.33 0.27 0.35 0.28 0.32
Max 0.37 0.33 0.42 0.35 0.29 0.36 0.30 0.34
*This parameter refers to the average of the eight generated samples corresponding to each bridge geometric configuration.
7.11.2. Concrete Girder Bridges Table 7.4 shows the fundamental periods of reinforced and prestressed concrete girder bridges in the horizontal direction. As seen in the table, the fundamental period varies between 0.50 to 1.07 seconds, and 0.36 to 1.18 seconds for MSPC and SSPC girder bridges, respectively. For reinforced concrete bridges, this range is between 0.12 to 0.52 second. In fact, reinforced concrete bridges are much stiffer than prestressed concrete girder bridges, mainly because of the bearing type. Prestressed concrete girder bridges contain elastomeric bearings which are more flexible than concrete-to-concrete friction bearings used in reinforced concrete girder bridges. For more information on the bearing types and modeling parameters, see Sections 6.4.4 and 7.5. Moreover, it is worth noting that for concrete girder bridges considered in this study, the longitudinal translation mode shape controls the fundamental period of the bridges.
221
Table 7.4: Fundamental period of reinforced and prestressed concrete girder bridges
Geometric Configurations
MSPC SSPC MSRC Min Average* Max Min Average* Max Min Average* Max 0.57 0.64 0.73 0.36 0.45 0.58 0.39 0.41 0.43 1 0.91 1.07 1.26 0.75 0.92 1.13 0.47 0.49 0.52 2 0.70 0.81 1.00 0.41 0.54 0.69 0.26 0.29 0.32 3 0.50 0.59 0.69 0.59 0.73 0.96 0.12 0.16 0.21 4 0.62 0.75 0.92 0.72 0.86 1.13 0.19 0.21 0.24 5 0.80 0.96 1.17 0.49 0.60 0.73 0.28 0.31 0.37 6 0.67 0.80 1.07 0.75 0.91 1.16 0.20 0.22 0.25 7 0.66 0.81 1.05 0.72 0.88 1.18 0.28 0.31 0.36 8 *This parameter refers to the average of the eight generated samples corresponding to each bridge geometric configuration.
7.11.3. Concrete Slab Bridges Table 7.5 shows the fundamental periods of reinforced concrete slab bridges. As seen in the table, for continuous slab bridges, the fundamental period varies between 0.13 to 0.42 seconds, which correspond respectively to geometric configuration 5 with the shortest span length and geometric configuration 2 with the longest span length. For simply-supported spans, the fundamental period varies between 0.09 to 0.38 second. Like steel girder bridges, the continuous bridges have higher natural period, which is mainly because of longer spans and larger masses without significant changes in lateral bridge stiffness. Moreover, concrete slab bridges have lower periods compared to other bridge classes including steel girder bridges (MCSTEEL and MSSTEEL), prestressed concrete girder bridges (MSPC and SSPC), and reinforced concrete girder bridges (MSRC). This observation is mainly owing to the fact that slab bridges have generally shorter spans and stiffer bearings. In fact, slab bridges consist of concrete-to-concrete friction bearings, which are much stiffer than steel bearings in steel girder bridges and elastomeric bearings in prestressed concrete bridges. Finally, it is worth noting that their fundamental modes in these concrete slab bridge classes are different from the ones discussed in other bridge classes. In fact, for most of simply-supported reinforced concrete slab bridge (MSRC-Slab), the transverse mode shape forms the fundamental mode shape of the bridges.
222
Table 7.5: Fundamental period of reinforced concrete slab bridges
Tn (second) Geometric Configurations 1 2 3 4 5 6 7 8
Min 0.16 0.27 0.16 0.17 0.13 0.15 0.15 0.18
MCRC-Slab Average* 0.19 0.32 0.20 0.21 0.17 0.18 0.19 0.22
Max 0.26 0.42 0.27 0.28 0.22 0.25 0.25 0.29
Min 0.09 0.24 0.18 0.34 0.18 0.20 0.19 0.13
MSRC-Slab Average* 0.11 0.25 0.21 0.36 0.20 0.21 0.20 0.15
Max 0.15 0.27 0.23 0.38 0.21 0.22 0.23 0.20
*This parameter refers to the average of the eight generated samples corresponding to each bridge geometric configuration.
7.12. Summary In this chapter, the numerical models developed to simulate the seismic behavior of Texas bridges are presented. OpenSees was selected as the structural analysis framework for the study due to its computational efficiency, broad availability of material and element models, as well as code-based input which allows the models to be created through automated scripts. Automated model creation is a significant benefit for this study due to large number of different response-history analyses that need to be performed for fragility curve development. Three-dimensional modeling was selected for bridge models to capture various damage limit states in both longitudinal and transverse directions. Bridge girders were modeled as elastic beam-column elements with corresponding mass and crosssectional properties assigned to them. The mass of the deck and bridge railings was lumped in deck nodes connected to girder elements with rigid links. Deck pounding effects between adjacent simply-supported spans, as well as pounding between the superstructure and abutment backwalls was modeled using nonlinear translational springs in the direction parallel to bridge span (longitudinal direction). Bridge bearings were modeled with nonlinear springs in the longitudinal and transverse directions. One spring has a bilinear material assigned to it, simulating effects of bearing sliding, rocking, or prying, while the other spring has a nonlinear hysteretic material assigned to it to simulate the resistance and damage associated with restraining elements such as anchor bolts, pintles, and dowels. Bent columns were simulated as lumped plasticity elements, i.e., they were modeled with elastic beam-column elements with nonlinear rotational springs on both ends. The rotational springs capture both flexural and shear damage (whichever occurs at a lower demand). Spring rotational capacities are calculated based on column concrete strength, axial load, longitudinal and transverse reinforcement, and reinforcement development/anchorage. Hysteretic unloading/reloading and stiffness degradation parameters were calibrated based on available experimental data. Foundations under bents and abutments were modeled with translational
223
springs in the longitudinal and transverse directions using nonlinear hysteretic materials representing pile or shaft behavior. Effects of soil-structure interaction were ignored due to high uncertainty about soil behavior as well as variability in foundation design. The effects of soil passive resistance when the abutment backwall is displacing toward the soil were simulated with nonlinear longitudinal translational springs at both bridge ends. Soil active resistance (the abutment displacing away from the soil) was ignored due to soil negligible tensile strength. Resistance in the transverse direction was not included as well. Example results from a nonlinear response-history analysis of a bridge were shown for demonstration, and dynamic properties (i.e., fundamental periods and mode shapes) were presented for the bridge samples used in this study.
224
Chapter 8. Fragility Curves 8.1. Overview In this chapter, nonlinear response history analyses (NRHAs) are conducted for bridge samples that are generated in Chapter 6. Each of these bridge samples is subjected to unique ground motion pairs (i.e., multi-directional shaking) representative of Texas seismic hazards. The outputs of the NRHAs are set as input for computational probabilistic models, such as Monte Carlo simulation, to produce bridge component fragility curves, as well as system-level bridge fragility curves for each bridge class. These fragility curves can be used to estimate the likelihood of damage in Texas bridges following an earthquake, which can help to inform post-event actions and inspection prioritization and to identify bridge components and classes that are most vulnerable to earthquake shaking.
8.2. Analytical Fragility Procedure Vulnerability assessment in this study is done using fragility functions. Fragility functions provide the conditional probability that gives the likelihood of whether a structure meets or exceeds a predefined level of damage (limit states) given a ground motion intensity measure. In this study, Peak Ground Acceleration (PGA) is used as ground motion intensity measure. These fragility functions can be then used to make retrofit decisions, to make post-earthquake inspection decisions, and to estimate the total loss of the bridges after an earthquake. In this study, the fragility curves are used to give guidance for post-earthquake inspection decisions for Texas bridges. Fragility curves can be developed following three main methodologies (1) expert based fragility functions, (2) empirical fragility functions, and (3) analytical fragility functions. Expert based fragility curves were first developed in the 1980’s, when the Applied Technology Council (ATC) put together a panel of 42 experts in order to develop damage probability matrices for various components of California infrastructure (ATC 1985). These matrices provided estimations of damage likelihood given certain ground motion intensity based on judgement and experience-level of each expert. This method was used again in the work of Padgett and DesRoches (2007) to develop improved bridge functionality relationships to be used in fragility analysis. Expert based fragility functions rely solely on the experience and the number of experts involved, which brings about a major concern of subjectivity. Due to these concerns, and the collection of post-earthquake damage data, and the development of analytical probabilistic models, this method is rarely used. Empirical fragility curves are developed from actual earthquake damage data. Following the 1989 Loma Prieta, 1994 Northridge, and the 1995 Kobe earthquakes, the empirical method became fairly popular. Examples of empirical fragility curves can be found in the studies of Basoz and Kiremidjian (1996), Yamazaki et al. (1999), Der Kiureghian (2002), Shinozuka et al. (2003), and Elnashai et al. (2004). Although this method provides a very realistic risk assessment of earthquake
225
damage, it does have its limitations. These limitations being, (i) statistical insignificant results due to small sample sizes and (ii) inconsistencies in the post-earthquake assessments as different inspectors could report different levels of damage. This methodology is not feasible for Texas because of lake of available data that has been reported because of earthquake. When actual post-earthquake damage and ground motion data is not available, analytical methods must be used to develop fragility curves. Throughout the last decade researchers have been developing and using analytical methodologies and procedures to generate fragility curves (Choi 2002; de Felice and Giannini 2010; Karim and Yamazaki 2003; Mackie and Stojadinović 2001; Nielson and DesRoches 2007a; Nielson 2005; Pan 2007; Ramanathan 2012; Shinozuka et al. 2000a). Analytical fragility functions can be generated using seismic response data from elasticspectral analysis, non-linear static analysis, or non-linear time history analysis. Despite being one of the most computationally demanding methods, the non-linear time history method is often viewed as one of the more reliable methods available (Shinozuka et al. 2003). This methodology forms the framework used in the present vulnerability assessment. This study utilizes a probabilistic framework, which considers uncertainty in ground motions and local soil conditions, as well as uncertainty in design and detailing practices over the past several decades when the bridge population was constructed. In this framework, fragility functions are provided to evaluate the vulnerability of Texas bridges to these natural and induced seismic hazards. There are three key parameters in this framework as follows: structural demand, D, which refers to the responses of the bridges from nonlinear time-history analysis; structural capacity, C; and the probability of the damage, pf, which is the probability that the structural demand, D, meets or exceeds the structural capacity, C, and reads: = p f P [ D / C > 1 | PGA ]
(8-1) Assuming lognormal distributions for demand and capacity, Cornell et al. (2002) showed that the above-mentioned probability can be computed using the following equation: p f = Φ[
ln( S D / SC )
β D|PGA 2 + β C 2
| PGA]
(8-2)
where SD and βD|PGA are, respectively, the median and logarithmic dispersion of the seismic demands conditioned on PGA, and SC and βC are, respectively, the median and dispersion of the capacity and Φ is the standard normal cumulative distribution function. Therefore, to compute the probability of damage, statistical models are required to estimate the median and dispersion of the seismic demands and capacities. The main steps to produce analytical fragility curves are shown in Figure 8.1. To take into account the uncertainty in the ground motion, the first step is to obtain a suite of ground motions that represent the seismic hazards of the studied area (Chapter 4). Second, bridge samples are randomly generated to be statistically representative of the Texas bridge inventory (Chapter 6). Recall that this study classified the Texas bridges into seven different classes that the bridges in each class have similar seismic behavior. For each bridge class, 64 bridge samples are generated by taking
226
into account the uncertainty in geometric as well as modeling parameters (Chapter 6). Each selected bridge sample is simulated with a nonlinear computational model (Chapter 7) and is subjected to a randomly selected ground motion that is scaled to various PGA levels. Then, for each ground motion-bridge pair, a nonlinear time history analysis is conducted for a variety of PGA levels. The outputs of the nonlinear analyses, the PGA of the selected ground motion, and the demands of different components (e.g., bearing deformations, abutment deformations, and column rotations) are set as an input for the probabilistic seismic demand model (PSDM) to predict the SD and βD|PGA for each bridge component. In addition, for each component, the probabilistic seismic capacity model (PSCM) is developed to predict SC and βC. Having both PSDM and PSCM for each component, the fragility curves can be computed using Eq. (8-2). Finally, by developing the fragility curves for each component, the fragility functions for a particular bridge class can be computed. The first two steps of this numerical fragility procedure, including ground motion and bridge selection and bridge nonlinear modeling, were discussed in detail in the previous chapters (Chapter 4, 6, and 7, respectively). The other steps are described in detail in the following sections. Ground Motions
Bridge Samples
Repeat For all Components P(Damage Sta
PGA, di
Probabilistic Seismic Demand Model
SD, βD|PGA Component Fragility Curves
Probabilistic Seismic Capacity Model
Slight Moderate Extensive Complete
SC , β C Bridge Fragility Curves
Nonlinear Time History Analysis
Figure 8.1: Analytical fragility function procedure
8.3. Probabilistic Seismic Demand Model Probabilistic Seismic Demand Models (PSDMs) establish a relationship between the component demands (e.g., plastic rotation of column, bearing displacement, abutment displacement, etc.) and the selected ground motion intensity measure, which can be used to develop component level fragility functions. PSDMs are developed by recording peak component demands, di, from each ground motion-bridge model pair, and by plotting the demand versus the ground motion intensity measure values for that ground motion. Cornel et al. (2002) showed that the median of seismic demands tends to follow a power function of intensity measure as follows: S D = aPGA b
(8-3) This equation can be transformed to logarithm space where ln(SD) follows a linear function with respect to PGA, with an intercept of ln(a) and a slope of b as follows: 227
ln( S D= ) ln(a ) + b × ln(PGA)
(8-4)
Figure 8.2 presents a schematic of a typical PSDM as well as the linear function of Eq. 8.3 through the peak demand data obtained from nonlinear response-history analyses. As seen in the figure, coefficients a and b can be computed by fitting a linear regression to the lognormal of the outputs from nonlinear time history analyses. Cornell et al. (2002) proposed that the conditional seismic demands typically follow a lognormal distribution, resulting in normal distribution with median of ln(SD) and dispersion of βD|PGA, in the transformed space (Figure 8.2). The variation or dispersion of the seismic demands about the mean, given the intensity measure, is the conditional lognormal standard deviation of the seismic demand (βD|PGA). According to Padgett et al. (2008), βD|PGA is approximately estimated by computing the dispersion of the data around the fitted linear regression using the following equation: N
β D|IM =
∑ [ln(d ) − ln(S i =1
i
D
)]2
(8-5) N −2 Recall that in this study, the seismic demands of columns, bearings, and abutments are recorded. In particular, the seismic demands comprise the plastic rotation of columns, the longitudinal and transverse deformations of bearings, and deformations in passive, active, and transverse directions of abutments. The parameters of the PSDM for the aforementioned seismic demands are shown in Table 8.1 through Table 8.7 for the different bridge classes considered in this study.
ln( S D )= b ⋅ ln(IM)+ln(a)
N (ln( S D ), β D|IM )
Figure 8.2: Illustration of parameters of the PSDM in the transformed space
228
Table 8.1: PSDM parameter estimations for MCSTEEL bridges
a
b
βD|PGA
Component
Abbreviation
Column
Rot
0.003 1.03
1.10
Fixed bearing-Long.
fx_L
0.11
0.92
1.11
Fixed bearing-Trans.
fx_T
0.48
1.50
1.19
Expan. bearing-Long.
ex_L
1.23
0.69
0.74
Expan. bearing-Trans.
ex_T
0.48
1.16
0.89
Abutment-Active
abut_A
0.03
0.23
0.69
Abutment-Passive
abut_P
0.02
0.58
1.37
Abutment-Trans.
abut_T
0.33
0.40
0.82
Table 8.2: PSDM parameter estimations for MSSTEEL bridges
a
b
βD|PGA
Component
Abbreviation
Column
Rot
Fixed bearing-Long.
fx_L
0.58
1.19
0.84
Fixed bearing-Trans.
fx_T
0.65
1.70
0.98
Expan. bearing-Long.
ex_L
1.26
0.83
0.67
Expan. bearing-Trans.
ex_T
0.52
1.59
0.98
Abutment-Active
abut_A
0.07
0.41
1.24
Abutment-Passive
abut_P
0.05
0.65
1.43
Abutment-Trans.
abut_T
0.12
0.46
0.54
0.0027 0.96
0.92
Table 8.3: PSDM parameter estimations for MSPC bridges
Abbreviation
Column
Rot
0.003 0.98
0.91
Fixed bearing-Long.
fx_L
1.28
1.02
1.09
Fixed bearing-Trans.
fx_T
1.31
1.19
1.19
Expan. bearing-Long.
ex_L
1.43
0.89
0.88
Expan. bearing-Trans.
ex_T
1.35
1.19
1.07
Abutment-Active
abut_A
0.08
0.40
0.97
Abutment-Passive
abut_P
0.16
0.88
1.41
Abutment-Trans.
abut_T
0.11
0.54
0.89
229
a
b
βD|PGA
Component
Table 8.4: PSDM parameter estimations for MSRC bridges
a
b
βD|PGA
Component
Abbreviation
Column
Rot
Fixed bearing-Long.
fx_L
0.52
1.32
0.95
Fixed bearing-Trans.
fx_T
0.15
1.72
1.35
Expan. bearing-Long.
ex_L
0.84
1.19
0.67
Expan. bearing-Trans.
ex_T
0.40
2.08
1.14
Abutment-Active
abut_A
0.14
0.36
0.59
Abutment-Passive
abut_P
0.22
0.79
0.86
Abutment-Trans.
abut_T
0.11
0.47
0.53
0.0026 1.2
1.01
Table 8.5: PSDM parameter estimations for SSPC bridges
Component
Abbreviation
a
b
βD|PGA
Fixed bearing-Long.
fx_L
2.03
0.98
0.85
Fixed bearing-Trans.
fx_T
1.42
1.03
0.93
Expan. bearing-Long.
ex_L
1.81
0.90
0.83
Expan. bearing-Trans.
ex_T
1.42
1.03
0.93
Abutment-Active
abut_A
0.08
0.17
0.71
Abutment-Passive
abut_P
0.30
0.82
0.88
Abutment-Trans.
abut_T
0.09
0.41
0.83
Table 8.6: PSDM parameter estimations for MCRC-slab bridges
Abbreviation
Column
Rot
Fixed bearing-Long.
fx_L
0.00
0.80
0.96
Fixed bearing-Trans.
fx_T
0.01
1.10
1.06
Expan. bearing-Long.
ex_L
0.68
1.42
0.95
Expan. bearing-Trans.
ex_T
0.67
1.77
1.12
Abutment-Active
abut_A
0.11
0.17
0.46
Abutment-Passive
abut_P
0.08
0.38
0.81
Abutment-Trans.
abut_T
0.10
0.15
0.47
230
a
b
βD|PGA
Component
0.0028 0.96
0.94
Table 8.7: PSDM parameter estimations for MSRC-slab bridges
a
b
βD|PGA
Component
Abbreviation
Column
Rot
0.003 0.95
0.91
Fixed bearing-Long.
fx_L
0.37
1.18
0.93
Fixed bearing-Trans.
fx_T
0.16
1.49
1.40
Expan. bearing-Long.
ex_L
0.72
1.19
0.66
Expan. bearing-Trans.
ex_T
0.63
1.97
1.01
Abutment-Active
abut_A
0.05
0.22
0.54
Abutment-Passive
abut_P
0.09
0.71
1.11
Abutment-Trans.
abut_T
0.05
0.29
0.53
8.4. Probabilistic Seismic Capacity Model For each component, four levels of damage (i.e., limit states) are defined as slight, moderate, excessive, and complete. The first step in developing the capacity models requires establishing a qualitative definition for each damage state. In past bridge fragility studies, it is common to adopt the damage states used in the FEMA loss assessment package HAZUS-MH (Choi 2002; Nielson 2005; Padgett 2007; Tavares et al. 2013) to ensure compatibility between the developed fragility functions and the HAZUS framework. Engineering judgment can, however, be used in refining these damage states as they can vary greatly depending on the condition, age, and type of the structure (Choi et al. 2004). The qualitative definitions for the slight, moderate, extensive, and complete damage states as given in HAZUS can be found in Table 8.8. These qualitative descriptions are given in terms of visual damage indicators for various components, and in some cases indications of potential component failures and loss of load-carrying capacity. The qualitative damage state definitions adopted in this study (Table 8.8) follow the HAZUS framework, with slight modifications in terminology to be more consistent with the TxDOT Bridge Inspection Manual and the TxDOT “Elements” Field Inspection and Coding Manual.
231
Table 8.8: Qualitative damage state descriptions considering Texas specific details
After defining qualitative limit states, the next step in developing capacity models is determining quantitative metrics to evaluate the occurrence of the described limit states. Quantification of these damage metrics is often based on individual component capacities or limit states, and then these limit state capacities are mapped to the corresponding damage states and functionalities of the system. Limit states must be defined by a metric consistent with the engineering demand parameters that can be evaluated in a computational model (e.g., ductility demands or displacement), and are characterized and represented by median values, Sc, and dispersion values, βc. To stay consistent with the demand models, which are assumed to take on lognormal distributions, the component capacity models are also assumed to have a lognormal distribution. There are three general methods used to create the capacity models: the prescriptive (physicsbased) approach, the descriptive (judgmental) approach, or a combination of both using a Bayesian approach (Nielson and DesRoches 2007a). The prescriptive method, also known as the physics-based method, is an approach that considers the mechanics of the structure to assess the level of damage and post-event functionality. A component’s internal force or deformation is determined from a structural analysis and is used to evaluate the occurrence of damage that corresponds to a certain functionality level. For example, one can assume that at a column curvature ductility of 1.0 the longitudinal steel begins to yield; therefore, the traffic capacity must be reduced until the bridge is inspected. The descriptive, or judgmental, approach attempts to subjectively correlate levels of component deformation or observed damage to post-event functionality and repair requirements based on expert opinion of bridge inspectors/officials. This data is typically gathered through surveys. Initial efforts were made through the FEMA-funded Applied Technology Council (ATC)-13 project to gather expert-opinions data for lifeline facilities in California to be used in developing the fragility curves found in HAZUS (Padgett 2007); however, the scope of the questionnaire was extremely broad (e.g., covering building, bridges, and utility system damage states) and the number of respondents with particular expertise in bridge engineering was low. Padgett (2007) designed and 232
conducted a survey to gather more extensive data focusing on bridges in the Central and Eastern United States (CEUS). In this survey, respondents were shown images of damaged bridge components (e.g., abutment settlement, expansion joint offsets, and column damage) from previous earthquakes, and they were asked to identify the level of functionality, repair procedures, and repair time associated with various levels of component deformation (e.g., abutment settlement or expansion joint offset displacements) or observed damage (e.g., column cracking, spalling, bar buckling, etc.). Survey data was collected from twenty-eight bridge engineers from nine different CEUS DOTs. This approach can be very subjective; however, expert-based opinion is thought to more accurately represent post-earthquake action decisions made by bridge officials. The Bayesian approach recognizes that both the prescriptive (physics-based) and descriptive (survey-based) approaches offer valuable information, and thus combine data from both using Bayesian theory, which allows you to update probability distributions when additional information is acquired (Nielson 2005). This process is carried out by following Bayes’ Theorem as:
P[ Bi | A] =
P[ A | Bi ]P[ B ] n
∑ P[ A | B ] j =1
(8-6)
i
where A is the new information that has been acquired, and Bi is the updated information. Figure 4.2 shows an example of the results for the updated moderate damage state for columns based on a combination of physics-based and survey-based capacity models. A full description of this method can be found in Nielson (2005).
Figure 8.3: Bayesian updating of distribution of moderate damage state for columns (Nielson 2005) A combination of all three of these techniques were used in determining the component capacities used in this study. The individual component limit state values are discussed in the following sections and are summarized in Table 8.11 at the end of this section. In early seismic fragility studies, it was common practice to use column capacity to represent the capacity of the bridge system (Karim and Yamazaki 2003; Mackie and Stojadinovic 2004; Shinozuka et al. 2000a);
233
however, more recent research has shown that all major vulnerable bridge components should be considered when determining system-level damage (Nielson and DesRoches 2007a; Tavares et al. 2013). Major bridge components considered in this study include: columns, bearings (steel and elastomeric), and abutments. Details regarding the damage state models that have been used for each of these components in this study are given in the sections below.
8.4.1. Columns In previous bridge fragility studies (Nielson 2005; Ramanathan 2012; Tavares et al. 2013), the qualitative description of reinforced concrete column damage states remain consistent. These damage states and their descriptions are given as: • Slight – yielding of outermost reinforcement steel and minor cracking • Moderate – minor cracking and spalling • Extensive – major cracking and spalling with exposed core concrete • Complete – loss of confinement, buckling of reinforcing steel, and core crushing The engineering demand parameters and values of the parameters used to evaluate the occurrence of these limit states, however, have varied from study to study. Drift, displacement ductility (µΔ), and curvature ductility (µϕ) are all metrics that have been used to define the performance of reinforced concrete columns. In the more recent fragility studies, researchers tend to use curvature ductility as the performance metric of choice for columns as this value can be obtained from computational models employing fiber cross-section-based beam-column elements. Curvature ductility is defined as the maximum curvature demand from the response-history analysis divided by the curvature at yielding of the outer most reinforcing steel. Table 8.9 shows the comparison of performance metrics and limit state median values used in these previous studies.
234
Table 8.9: Column limit state comparison
A major reason for the differences in column limit state values in the various studies is due to the regional column design and detailing practices or the design era of the columns in question. Ramanathan (2012) focused on columns in California bridges, but recognized the evolution in column design as brittle columns (pre-1971), strength-degrading columns (1971–1990), and ductile columns (post 1990). Figure 8.4 shows the expected behavior of columns from these three design eras, indicating the component damage thresholds (CDTs) along with photographic examples of these damage states. Note that as ductile detailing requirements improved in California over the decades, the curvature ductility values corresponding to the damage states increased. The Nielson (2005) study focused on bridge columns in the CEUS that were nonseismically detailed and had little to no confinement in the plastic hinge regions. In this particular study, limit state values were based on displacement ductility values from the Hwang (2000) seismic fragility study of Memphis, Tennessee bridges, but values were converted into curvature ductility values based on guidance from the Seismic Retrofitting Manual for Highway Bridges 235
(FHWA 1995). The displacement ductility selected in the Hwang (2000) study corresponded to key points in the cross-section flexural behavior (i.e., full yielding of the tension steel for the slight damage state, concrete reaching an assumed crushing strain of 0.002 for the moderate damage state, etc.). Note that the curvature ductility for these damage states had magnitudes similar to those from the 1971–1990 “strength-degrading” California columns from the Ramanathan (2012) study.
236
Designed before 1971
Designed between 1971 and 1990
c) Designed after 1990 Figure 8.4: Depiction of column performance by design era (Ramanathan, 2012) The engineering demand parameters and values of the parameters used to evaluate the occurrence of these limit states, however, have varied from study to study. Drift, displacement ductility (µΔ), and curvature ductility (µϕ) are all metrics that have been used to define the performance of reinforced concrete columns. In the more recent fragility studies, researchers tend to use curvature ductility as the performance metric of choice for columns as this value can be obtained from computational models employing fiber cross-section-based beam-column elements. Curvature ductility is defined as the maximum curvature demand from the response-history analysis divided by the curvature at yielding of the outer most reinforcing steel. Table 8.9 shows the comparison of performance metrics and limit state median values used in these previous studies.
237
In the present study, to be consistent with the modeling approach suggested for columns, plastic rotation (Rot) is used to evaluate the performance of reinforced concrete columns. This metric has also been used in the work done by the ACI 369 committee (2016) for the ASCE 41-17 standard. In that work, plastic rotations are proposed for three different pre-defined limit states as immediate occupancy (IO), life safety (LS), and collapse prevention (CP), which are shown in Table 8.10. As seen in the table, these values depend on anl and bnl which describe column inelastic rotation capacities to the points that limit the hardening region and strength degradation respectively (See Figure 7.35 for more details). Table 8.10: Column limit state values suggested by ASCE 41-17
Limit State
Plastic rotation
IO
0.15 anl ≤ 0.005
LS
0.5 bnl
CP
0.7 bnl
Note: anl and bnl are computed using the equations in Table 7.1.
The definition of these limit states is very similar to the slight, moderate, and extensive levels of damage suggested by HASUZ, respectively. Thus, the proposed values can be used for Slight, Moderate, and Extensive levels of damage. For Complete level of damage defined in Table 8.8, the present study considers bnl, inelastic rotation capacity before strength degradation, as the limit state value. As seen in the table, the limit state values depend on the column properties. By investigating columns with different properties considered in this study, it is observed that the limit state values vary between 0.002 and 0.004 for Slight level of damage, between 0.011 and 0.033 for Moderate level of damage, between 0.018 and 0.046 for Extensive level of damage, and between 0.021 and 0.058 for Complete level of damage. Thus, the median values of 0.003, 0.01, 0.02, and 0.03 are considered for Slight, Moderate, Extensive, and Complete levels of damage, respectively. It should be noted that the limit state values discussed above were developed only considering flexural behavior of columns; however, reinforced concrete columns that have not been seismically designed and do not provide adequate transverse reinforcing are also susceptible to a more brittle shear failure. In order to determine which failure mode (i.e., flexural or shear) governs a columns behavior, one must compare the shear and flexural strengths of the column. If the column reaches its nominal flexural capacity prior to reaching its nominal shear capacity, the column is considered flexure-controlled. All of the bridge columns in this study were found to be flexure-controlled; thus, column shear limit state values are not given in this report.
238
8.4.2. Bearings Mander et al (1996) conducted extensive experimental research on the response of steel bearings subjected to cyclic loading, which has been the foundation for estimating limit state median values throughout several past bridge fragility studies. This experimental research showed that failure of the anchor bolts connecting the base of the bearing to the concrete support typically controls the behavior and critical limit state values for steel bearings. For past tests of high-type fixed steel bearings, noticeable damage was first observed at a deformation of 0.25 inch (6mm), when cracks tend to form around the concrete bearing areas (Mander et al, 1996). For this reason, a 0.25 inch bearing deformation is used for the “slight” limit state median value in this study. The limit state median value for the “moderate” damage state is assumed to be at a deformation of 0.75 inches (20mm), where prying action in the bearing is first observed. This behavior results in more significant cracking and spalling of the concrete bearing areas, and significant deformation of the anchor bolts can be observed. Based on observations of anchor bolt fracture in the past tests, a bearing deformation of 1.5 inches (40mm) is assumed for the “extensive” limit state median value, resulting in subsequent sliding or toppling of the bearing. Finally, the “complete” limit state is assumed to take place at a deformation that exceeds the typical width of the bridge seat, resulting in unseating of the girder and ultimately complete or partial collapse of the span. While visually being able to determine if a bridge span has collapsed during post-earthquake inspection can be straightforward, determining a bearing deformation value that would indicate collapse in a numerical bridge model is not. Nielson (2005), using the prescriptive approach, suggests that unseating will occur at a displacement of 10 inches (255mm) based on the width of the bridge seat for the bridge population in question. Results from a survey of bridge officials in the CEUS, conducted in the Padgett study (2007), indicated an expected bearing deformation of greater than or equal to 6 inches to cause girder unseating. Nielson (2005), using Bayseian updating and the survey results to update the prescriptive expected value, suggests that an expected bearing deformation of 7.25 inches would causing girder unseating. More details on the Bayesian updating process can be found in Nielson (2005). This variation in median values shows that there is some discrepancy in determining displacement consistent bearing deformations associated with girder unseating. Recognizing these challenges and uncertainties in determining the “complete” limit state median value for bearings, and due to the lack of experimental data of girder-bearing-seat subassemblies, it was determined to use the updated value, which takes into account engineering judgement, suggested in the Nielson study (2005). Through the investigation of TxDOT as-built drawings, it was determined that this value of 7.25 inches is also consistent with the typical distance between the centerline of bearing and the edge of the bridge seat. Typical details for fixed steel bearing design provide the same number of anchor bolts providing restraint in either direction, indicating that fixed type steel bearings have similar behaviors in both the longitudinal and transverse directions (Nielson 2005). Also, while expansion type steel bearings are expected to accommodate more deformation in the longitudinal direction, the transverse behavior of a steel expansion bearing is expected to be similar to that of the fixed type
239
bearing. Thus, the limit states for the longitudinal and transverse fixed steel bearings, as well as the steel expansion bearings in the transverse direction are assumed to follow the same limit state values as discussed above and are summarized in Table 8.11. For expansion bearings (e.g., rockers and sliding bearings) in the longitudinal direction, the damage of concern is instability of the bearing, which would result in significant movement in the superstructure, and in the worst cases unseating of the span (Pan 2007). The dimensions of the bearings and ultimately the width of the bridge seat generally govern this damage and instability. The experimental bearing tests conducted by Mander et al (1996) showed that instability of expansion bearings was first observed at a deformation of half the width of the masonry plate (100mm). Using these test results Choi (2002) proposed a displacement of 4 inches (100mm) as the “moderate” limit state for expansion bearings. Investigation of as-built drawings indicated that the size of the masonry plates used in older steel girder bridges in Texas varies with span length, ranging from a width of 6 inches up to 14 inches. For example, longer span lengths result in larger bearing forces, which requires a larger masonry plate. However, typical span lengths for steel girder bridges used in this study (e.g., spans less than 120ft) correspond to bearings with masonry plates ranging in width from 6 to 9 inches. Therefore, a “moderate” limit state median value of 3.75 inches is used in this study. Considering unseating of a span as the “complete” damage state, a displacement of 7.25 inches, as previously discussed, is used as the median value for the “complete” limit state. Following the work of Choi (2002) the “slight” and “extensive” limit state median values were picked between the “moderate” and “complete” values, and do not correspond to any designated observed damage. These values are 1.5 inches of displacement for “slight” damage, and 5 inches for “extensive” damage. As previously mentioned, elastomeric bearings are common bearing types used with concrete superstructures (i.e., PC girder bridge class). The behavior of these type of bearings is typically characterized by sliding; however, unimpeded sliding can only occur after complete fracture of the retention dowels, if present (Nielson 2005). As discussed in Tech Memo 8, the only difference between expansion and fixed elastomeric bearings are the slotted holes in the elastomeric pad and girder allowing the longitudinal movement of the superstructure at the expansion bearing locations. Because dowels, which are embedded in the bridge seat and extend through the elastomeric pad into the bottom of the concrete girder, cannot be observed after construction, it is difficult for an inspector to visually differentiate between expansion and fixed elastomeric bearings. For this reason, it is common to use the same limit state values for the fixed and expansion elastomeric bearings, in both the longitudinal and transverse directions (Nielson 2005). This detailing, which causes the dowels to be hidden from outside inspection, also makes it difficult to visually inspect and identify damage in the retention dowels (e.g., yielding or fracture of the dowel). Thus, limit state expected values related to dowel fracture must be related to observable displacements that can be associated with capacity implications and possibly repair efforts, rather than observed dowel damage. For example, Nielson (2005) stated that a peak transient displacement of 1 inch is expected to result in permanent deformations in the bearing that can be easily observed by an inspector and may have caused minor dowel yielding but is expected to have little effect on bearing capacity. A peak bearing displacement of 3 inches would imply possible dowel fracture and may
240
require minor deck realignment. At 5 inches of peak bearing displacement, the dowels are expected to be fully fractured, resulting in not only deck realignment, but also requiring installation of a new retention mechanism for the concrete girders. At a bearing deformation of 7.25 inches, unseating of the span is expected to occur. Therefore, the values for the slight, moderate, extensive, and complete limit states used in this study are displacements of 1 inch, 3 inches, 5 inches, and 7.25 inches, respectively. Other reinforced concrete superstructures (e.g., RC slab and girders) do not utilize elastomeric pads as the bearing between the superstructure and the substructure. These older details, which typically consist of ¾ inch dowels and roofing felt, do rely on the same type of restraint system (i.e., steel dowels connecting the superstructure and substructure) and are expected to have similar “sliding” type of behavior. For this reason, the limit state values for the elastomeric bearings, discussed above, will be used for the alternative concrete bearings typically used in the RC slab and girder bridge classes.
8.4.3. Abutments Abutments primarily resist vertical loads and act as a retaining wall to the backfill supporting the approach slab; however, they do provide resistance against deformation and earthquake induced inertial forces from the bridge superstructure (Saini and Saiidi, 2013). Deformation of the abutment in the longitudinal direction can be resisted passively or actively. Passive resistance is developed as the abutment pushes into the soil backfill (compression), and active resistance is when the abutment is pulled away from the backfill (tension). The passive soil pressure and the foundation (e.g., piles or drilled shafts) provide resistance in passive action, while active action is resisted solely by the foundation (i.e., the soil is assumed to have no tensile resistance). Abutments also provide transverse stiffness, which can be attributed to the foundation or the wing walls, if present. Typically, abutment limit states are defined in terms of the first yield point and ultimate displacement of the abutment foundation and backwall (Choi 2002; Tavares et al. 2013). Martin and Yan (1995) provide guidelines for estimating ultimate displacement in the passive direction, as they suggest a multi-linear behavior of abutments in the passive action, and their tests show that the ultimate passive earth pressure becomes mobilized at a displacement of 6% to 10% of abutment height, depending on the type of soil (e.g., cohesive vs cohesionless). Their tests also suggest abutments in the passive action see first yielding and second yielding at displacements of 0.6% and 1.5% of abutment height, respectively. Nielson (2005) proposed that an inspector would not be able to identify noticeable (i.e., “slight”) damage until cracking of the abutment and backwall occurred at or around second yielding, and “moderate” damage would occur at a longitudinal displacement of about 6 inches. Nielson (2005) also proposed, based on survey results of practicing CEUS bridge engineers, that abutment deformation was highly unlikely to reach an “extensive” or “complete” limit state. This particular study adopts the limit state values proposed by Nielson (2005). Limit states for abutments in the active or transverse directions are again typically defined in terms of first yield and ultimate deformations. When considering pile bent abutments, which are typical 241
in the CEUS and Texas, Caltrans (1999) proposes that ultimate displacement occurs around a displacement of 1 inch, and first yield will occur at 30% of the ultimate displacement. Using these Caltrans recommendations, coupled with relevant engineering judgment (i.e., survey results from practicing bridge engineers) through Bayesian updating, Nielson (2005) proposed that an abutment deformation of 0.375 inches should be considered as “slight” damage, 1.5 inches as “moderate” damage, and 3 inches as “extensive” damage in the active action and transverse direction. Similar to the behavior in the passive action, Nielson (2005) suggested that, based on engineering judgement and the lack of “complete” damage observed in abutments in past earthquakes, abutment displacement in the active or transverse direction during a seismic event would not cause “complete” damage to a bridge structure. Due to the similar design and details of CEUS and Texas bridge abutments (e.g., seat type pile/shaft abutments), the limit states proposed by Nielson (2005) for abutments were used in this study. Assuming an average abutment height of 7 ft, based on review of as-built drawings and TxDOT Standards, the second yielding point of an abutment in the passive direction is expected to occur at a deformation of about 1.25 inches, which was considered as the “slight” limit state median value. An abutment deformation of 6 inches in the passive direction was used as the “moderate” limit state value in this study. For both the active and transverse abutment deformations, median values of 0.375 inches, 1.5 inches, and 3 inches are used as the “slight,” “moderate,” and “extensive” limit states, respectively.
8.4.4. Foundations and Expansion Joints Foundations and expansion joints are two other bridge components that are potentially susceptible to damage during an earthquake event. These components are often considered as secondary components (Ramanathan 2012), as their damage does not necessarily compromise the overall stability of the system (i.e., in the case of expansion joints), or their fragility is far lower than other major components (e.g., damage in columns or bearings is much likelier to occur before damage in the foundation). In this particular study, the capacity of the foundation and columns are assumed to be related due to the typical integral drilled shaft/column foundation detail assumed. Depending on the design and detailing of this type of substructure component, the foundation and column can act as one component (e.g., with the same diameter column and shaft), or the column can be designed with a smaller diameter than the shaft, causing damage to occur in the smaller column section. In this study, foundation capacity is not considered explicitly and is instead implicitly included in the column capacity and median limit state values. Expansion joints are an important component of a bridge structure and are expected to experience damage during an earthquake event (e.g., due to pounding and crushing of the concrete deck). Although this type of damage may affect the functionality or the required repair of the structure (e.g., resulting in reduced traffic speed due to rough joints, or required patching of joints that may increase repair costs), it is not expected to affect the overall stability of the structure. The capacity or damage of expansion joints is not typically considered explicitly in a fragility analysis; instead, it is common to map expansion joint damage to the limit states of other components. For example,
242
if an expansion bearing experiences a displacement of 3 inches (which is considered “moderate” damage), it is expected that there will be moderate cracking and spalling at the expansion bearings, which will increase the time and costs of structural repairs. For this reason, expansion joint behavior was considered when developing the qualitative structural level limit states but are not considered explicitly at the component level. According to past studies (Cornell et al. 2002; Nielson 2005), it is assumed that the capacity for each limit state follows a lognormal distribution with a median of SC and dispersion of βC. The values of SC are assumed based on engineering judgement and test results as previously discussed and as summarized in Table 8.11. To account for the uncertainty in capacity of each component, the coefficient of variation (COV) of 25% for slight and moderate, and 50% for extensive and complete limit states are taken into account, which results in βC of 0.25 for slight and moderate, and βC of 0.47 for extensive and complete limit states using the following equation: β= C
1 + COV 2
(8-7)
Table 8.11: Limit state median and dispersion values for bridge components Slight
Component
Moderate
Extensive
Complete
SC
βC
SC
βC
SC
βC
SC
βC
Column-Rotation (radian)
Rot
0.003
0.25
0.01
0.25
0.02
0.47
0.03
0.47
Steel Fixed bearing-Long. (in)
fx_L
0.25
0.25
0.75
0.25
1.5
0.47
7.25
0.47
Steel Fixed bearing-Trans. (in)
fx_T
0.25
0.25
0.75
0.25
1.5
0.47
7.25
0.47
Steel Expan. bearing-Long. (in)
ex_L
1.5
0.25
4.1
0.25
5.3
0.47
7.25
0.47
Steel Expan. bearing-Trans. (in)
ex_T
0.25
0.25
0.75
0.25
1.5
0.47
7.25
0.47
Elasto. Fixed bearing-Long. (in)
fx_L
1
0.25
3
0.25
5
0.47
7.25
0.47
Elasto. Fixed bearing-Trans. (in)
fx_T
1
0.25
3
0.25
5
0.47
7.25
0.47
Elasto. Expan. bearing-Long. (in)
ex_L
1
0.25
3
0.25
5
0.47
7.25
0.47
Elasto. Expan. bearing-Trans. (in)
ex_T
1
0.25
3
0.25
5
0.47
7.25
0.47
Abutment-Passive (in)
abut_P
1.45
0.25
5.8
0.25
8.0
0.47
10.0
0.47
Abutment-Active (in)
abut_A
0.375
0.25
1.5
0.25
3
0.47
8
0.47
Abutment-Trans (in)
abut_T
0.375
0.25
1.5
0.25
3
0.47
8
0.47
8.5. Component-Level Fragility Curves Given demand and capacity models for each component, the probability of damage can be computed using Eq. (8-2). Figure 8.5 through Figure 8.11 show the fragility curves for different components of different bridge classes considered in this study. Each plot of the figures represents the fragility functions of the components for one specific limit state (e.g., slight, moderate, extensive, and complete). As seen in these figures, the probability of damage for columns and abutments are similar amongst the different bridge types; however, the probability of damage for bearings changes a lot from one bridge class to the others.
243
For steel girder bridges, as seen in Figure 8.5 and Figure 8.6, the bearings are the most vulnerable component and are most likely to experience damage during an earthquake. This is mainly due to the fact that this bridge class, based on the age of the bridge samples, have steel bearings which are known to be vulnerable to seismic hazards (NCHRP, 1977). Although this type of bearings has recently been replaced by elastomeric pads in modern steel girder bridges, as discussed in Section 6.4, the majority of the steel bridges constructed in Texas have steel bearings. Moreover, as seen in Figure 8.5, for continuous steel girder bridges, the expansion bearings are more vulnerable compared to fixed bearings, which is largely because of the instability of steel rocker bearings under large deformations. Moreover, fixed bearings in MSSTEEL bridges tend to be more vulnerable than fixed bearings in MCSTEEL bridges. Figure 8.7 and Figure 8.8 respectively show the results for multi-span and single-span prestressed concrete girder bridge. As seen in the figure, for prestressed concrete girder bridge, like steel girder bridges, the bearings are the most vulnerable components of the bridges. As discussed in Chapter 6, prestressed girder bridges employ elastomeric bearings with elastomeric pad and dowels. The results indicate that although the elastomeric bearings have a slightly lower probability of damage compared to steel bearing, elastomeric bearings are the most vulnerable component of prestressed concrete girder bridges. For reinforced concrete girder and slab, bridges i.e., MSRC, MCRC-Slab, and MSRC-Slab, as seen in Figure 8.9 through Figure 8.11, the column is the most vulnerable component. This observation is attributed to the fact that for these bridge classes, the bearings consist of numerous dowels and concrete-on-concrete friction, which provides significant strength and stiffness, resulting in lower deformations compared to steel and elastomeric bearings. Finally, regardless of the bridge class, it is found that abutments are the least vulnerable component of the bridges. Due to their relative flexibility and lower strength, the bearings are expected to experience large deformations and subsequent damage, limiting the loads that can be transferred to the abutments. These fragility curves can be used as a guidance for post-event bridge inspection, to identify the critical components most likely to exhibit damage.
244
Slight
Moderate
Probability of damage
Extensive
Complete 1
1
1
1
0.8
0.8
0.8
0.8
0.6
0.6
0.6
0.6
0.4
0.4
0.4
0.4
0.2
0.2
0.2
0.2
0
0.2
0.4
0.6
0.8
0
1
0
0
0
0
0.2
PGA (g)
0.4
0.6
0.8
0
1
0.2
PGA (g)
Column µƟ
0.4
0.6
0.8
0
1
0.2
0.4
PGA (g)
0.6
0.8
1
PGA (g)
Fixed Bearing Expansion Bearing fx_L ex_L fx_T ex_T
Abutment abut_P abut_A abut_T Figure 8.5: Component fragility curves of MCSTEEL bridges
Slight
Moderate
Probability of damage
1
Extensive
Complete 1
1
1
0.8
0.8
0.8
0.8
0.6
0.6
0.6
0.6
0.4
0.4
0.4
0.4
0.2
0.2
0.2
0.2
0 0.2
0.4
0.6
0.8
1
PGA (g)
0
0.2
0.4
0.6
0.8
1
PGA (g)
Column µƟ
0
0
0 0
0
0.2
0.4
0.6
0.8
1
0
0.2
PGA (g)
Fixed Bearing Expansion Bearing fx_L ex_L fx_T ex_T
Abutment abut_P abut_A abut_T Figure 8.6: Component fragility curves of MSSTEEL bridges
245
0.4
0.6
PGA (g)
0.8
1
Probability of damage
Slight
Moderate
Extensive
Complete
1
1
1
1
0.8
0.8
0.8
0.8
0.6
0.6
0.6
0.6
0.4
0.4
0.4
0.4
0.2
0.2
0.2
0.2
0 0.2
0.4
0.6
0.8
1
0
0
0 0
0
0.2
PGA (g)
0.4
0.6
0.8
0
1
0.2
PGA (g)
Column µƟ
0.4
0.6
0.8
0
1
0.2
PGA (g)
0.4
0.6
0.8
1
0.8
1
PGA (g)
Fixed Bearing Expansion Bearing fx_L ex_L fx_T ex_T
Abutment abut_P abut_A abut_T Figure 8.7: Component fragility curves of MSPC bridges
Probability of damage
Slight
Moderate
Extensive
Complete
1
1
1
1
0.8
0.8
0.8
0.8
0.6
0.6
0.6
0.6
0.4
0.4
0.4
0.4
0.2
0.2
0.2
0.2
0
0.2
0.4
0.6
0.8
1
PGA (g)
0
0.2
0.4
0.6
0.8
1
PGA (g)
Column µƟ
0
0
0
0
0
0.2
0.4
0.6
0.8
1
0
0.2
PGA (g)
Fixed Bearing Expansion Bearing fx_L ex_L fx_T ex_T
Abutment abut_P abut_A abut_T Figure 8.8: Component fragility curves of SSPC bridges
246
0.4
0.6
PGA (g)
Probability of damage
Slight
Moderate
Extensive
Complete
1
1
1
1
0.8
0.8
0.8
0.8
0.6
0.6
0.6
0.6
0.4
0.4
0.4
0.4
0.2
0.2
0.2
0.2
0
0
0 0
0.2
0.4
0.6
0.8
1
0
0.2
PGA (g)
0.4
0.6
0.8
1
0 0
0.2
PGA (g)
Column µƟ
0.4
0.6
0.8
1
0
0.2
PGA (g)
0.4
0.6
0.8
1
0.8
1
PGA (g)
Fixed Bearing Expansion Bearing fx_L ex_L fx_T ex_T
Abutment abut_P abut_A abut_T Figure 8.9: Component fragility curves of MSRC bridges
Probability of damage
Slight
Moderate
Extensive
Complete
1
1
1
1
0.8
0.8
0.8
0.8
0.6
0.6
0.6
0.6
0.4
0.4
0.4
0.4
0.2
0.2
0.2
0.2
0
0.2
0.4
0.8
0.6
1
PGA (g)
Column µƟ
0
0
0
0
0
0.2
0.4
0.6
0.8
1
PGA (g)
0
0.2
0.4
0.6
0.8
1
0
0.2
PGA (g)
Fixed Bearing Expansion Bearing fx_L ex_L fx_T ex_T
Abutment abut_P abut_A abut_T Figure 8.10: Component fragility curves of MCRC-slab bridges
247
0.4
0.6
PGA (g)
Probability of damage
Slight
Moderate
Extensive
Complete
1
1
1
1
0.8
0.8
0.8
0.8
0.6
0.6
0.6
0.6
0.4
0.4
0.4
0.4
0.2
0.2
0.2
0.2
0
0 0
0.2
0.4
0.6
0.8
1
PGA (g)
0
0 0
0.2
0.4
0.6
0.8
1
0
0.2
PGA (g)
Column µƟ
0.4
0.6
0.8
1
0
0.2
PGA (g)
0.4
0.6
0.8
1
PGA (g)
Fixed Bearing Expansion Bearing fx_L ex_L fx_T ex_T
Abutment abut_P abut_A abut_T Figure 8.11: Component fragility curves of MSRC-slab bridges
8.6. System-Level Fragility Curves System-level fragility curves provide an estimation of the vulnerability of the entire bridge system and are useful tools in developing post-event action plans or loss estimations. In early bridge studies, such as Karim and Yamazaki (2003), Mackie and Stojadinovic (2004), and Shinozuka et al. (2000b), it was assumed that the columns were most vulnerable part of the bridge, and thus the column fragility were assumed to represent the fragility of the entire bridge system. However, as shown in the previous section, it is observed that in most bridge classes, bearing is the most vulnerable component of the bridge system in the state of Texas. In this regard, more recent fragility studies, powered by advancements in computing capabilities, considered the vulnerability of multiple components to more accurately represent the fragility of the bridge system. The concept of combining multiple component fragilities into a single system-level fragility significantly increases the complexity of fragility analysis, which makes the use of closed form integration of multiple component fragilities extremely difficult, if not impossible. For this reason, researchers have explored several methods for developing system-level fragility curves. One common approach is the use of first-order reliability bounds (Nielson and DesRoches 2007a; Pan 2007). First-order reliability can be expressed as: n
m
i =1
i =1
max[ P( Fcomp _ i )] ≤ P(Fsystem ) ≤ 1 − ∏ [1 − P(Fcomp _ i )]
(8-8)
where P(Fcomp-i) is the probability of failure of the ith component. The lower bound assumes complete component correlation, where the entire bridge fragility is controlled by the most vulnerable component, which may underestimate the bridge fragility as it ignores potential damage in components with lower, yet still significant, vulnerabilities. The upper bound assumes no correlation between damage in different components, in which failure of a single component (i.e., a component exceeding a certain limit state) constitutes failure of the entire bridge. This upper
248
bound is mathematically represented by the product of the component survival probabilities and can overestimate the bridge fragility since it ignores likely correlation of damage among various components. Nielson and DesRoches (2007b) found that the upper bound provides a good estimation of the system fragility; however, they concluded that direct estimation of system-level fragility considering component correlation using numerical integration is a more accurate approach, showing a reduction in fragilities of up to 10 percent. This direct estimation approach has also been used in more recent studies such as Ramanathan (2012) and Tavares et al. (2013). The direct estimation approach recognizes that there is some sort of correlation of damage among the components, as the component PSDMs are compiled into a joint seismic probability density model (JPSDM) for the system. As previously stated, it is assumed that, for a given PGA, the demands follow lognormal distributions, resulting in normal distributions in natural logarithm space (as demonstrated in Figure 8.2). The JPSDM is developed in natural logarithm space using the transformed marginal distributions of the components as well as taking into account the correlation between the component-level demands in the transformed space. Therefore, The JPSDM takes on a multivariate normal distribution in natural logarithm space and can be fully described by a vector of mean demands and a covariance matrix in natural logarithm space. Table 8.12 shows the correlation among the seismic demands of multi-span continuous steel girder bridges, i.e., MCSTEEL, in natural logarithm space. From Table 8.12, values in the matrix closer to 1.0 indicate higher correlation in component demands. For example, the largest value (other than self-correlation values of 1.0) of 0.9 in the location corresponding to ln(ex_T) and ln(fx_T) indicates that demands in the transverse direction of expansion and fixed bearings are highly correlated. The correlation among seismic demands of other bridge classes are available in Appendix F. Table 8.12: Correlation of seismic demands for MCSTEEL bridges
ln(Rot) ln(fx_L) ln(fx_T) ln(Rot) 1.00 0.58 0.62 ln(fx_L) 0.58 1.00 0.54 ln(fx_T) 0.62 0.54 1.00 ln(ex_L) 0.93 0.71 0.60 ln(ex_T) 0.54 0.39 0.72 ln(abut_P) 0.63 0.28 0.43 ln(abut_A) 0.53 0.24 0.49 ln(abut_T) 0.50 0.18 0.62
ln(ex_L) 0.93 0.71 0.60 1.00 0.48 0.62 0.55 0.47
ln(ex_T) 0.54 0.39 0.72 0.48 1.00 0.19 0.01 0.15
ln(abut_P) ln(abut_A) ln(abut_T) 0.63 0.53 0.50 0.28 0.24 0.18 0.43 0.49 0.62 0.62 0.55 0.47 0.19 0.01 0.15 1.00 0.70 0.62 0.70 1.00 0.90 0.62 0.90 1.00
In order to develop fragility curves, the JPSDM must be integrated over all possible failure domains (i.e., for each limit state of each component). This integration provides the probability of failure for a particular system at a given value of PGA. To compute this integration in this study, it is assumed that if any component exceeds any level of damage, then the whole bridge exceeds that level of damage. It is a conservative assumption that provides equal weight to damage in any component regardless of the relative “importance” of each component, though it is consistent with other past research (Nielson and DesRoches 2007b). Thus, for each level of damage, it is assumed 249
that the probability of damage for a bridge is the union of the probabilities that bridge components exceed that limit state, given mathematically as: n
P (Failsystem | LS) = P (Failcomponenet-i | LS)
(8-9)
i =1
Therefore, with this approach, whole system is considered to be more fragile than any one of the bridge components. Figure 8.12a illustrates the bi-variate probability density function over the failure domain. This figure demonstrates the correlation between demands from two components (d1 and d2), as indicated by the contour lines showing the multivariate distribution of the JPSDM. The failure domain for the system is indicated by the shaded parts of the plot, where either component exceeding its capacity for a specific limit state constitutes the entire system exceeding that limit state.
d2
d2 (d1, d2)
P(Failcom-2) LS for d2
C2 = LS for d2
P(Failcom-1)
Joint probability density function
LS for d1
d1 C1 = LS for d1
(a) JPSDM over failure domain at a given PGA
d1
(b) Monto Carlo Simulation at a given PGA
Figure 8.12: Bi-variate joint probability density function Computing the system fragility from the JPSDM of multiple components is commonly computed using a numerical integration technique, such as Monte Carlo simulation (Figure 8.12b). In each sample of Monte Carlo simulation (indicated by the dots in Figure 8.12b), random realizations are generated for both the demand (d1, d2) and capacity (C1, C2) of each component. Then, the failure of each component and, in turn, the bridge system is evaluated by comparing the paired realizations. In the simulation process, the probability of failure given a PGA is computed using an indicator function, If. In each sample, if the demand of any of component exceeds the corresponding randomly generated capacity (as indicated by the red dots in Figure 8.12b), the indicator function is equal to one, indicating that the bridge fails; otherwise, If is equal to zero. By way of illustration, the indicator function for computing the integration for a bi-variate distribution, shown in Figure 8.12b, is as follows:
250
if d1 > c1 or d 2 > c2
1 If = 0
(8-10)
if d1 < c1 and d 2 < c2
where d1 and d2 are the randomly generated demands, and c1 and c2 are the corresponding randomly generated capacities given a specific value of PGA. To properly account for the uncertainty of demand and capacity, 106 number of realizations are generated in this study. Hence, probability of failure at a given PGA value is estimated as the number of samples that exceeded that limit state (i.e., failed) divided by the total number of samples, which is expressed mathematically using the following equation: N
P [ LS | PGA ] =
∑I i =1
fi
(8-11)
N = 106
where P[LS|PGA] is the probability of exceeding a specific limit state (LS) at the system level given a PGA. This sampling is then carried out over a wide range of PGA values to compute the probability of failure for different values of PGA, which forms the underlying data for the generation of fragility curves. Fragility curves are assumed to follow a lognormal distribution and are, therefore, produced via a simple linear regression of the underlying failure probabilities at various PGA levels to estimate the median PGA (i.e., PGA corresponding to 50% likelihood of exceeding the specified limit state) and dispersion of the fragility functions. Table 8.13 presents the median PGA and dispersion values for the fragility curves of the bridge classes considered in this study. For instance, the median probability of exceeding the slight level of damage for MSSTEEL girder bridges is 0.27 g, which means that for ground motions with PGA of 0.27 g, there is 50% chance that bridges in that class experience slight or severe levels of damage. As seen in the table, regardless of the limit state, median PGA values for steel girder bridges are lower than other bridges, indicating the fact that steel girder bridges are more vulnerable than other bridges. This observation, as discussed in previous section, is mainly because of the higher vulnerability of steel bearings used in steel girder bridges compared to other bearing types. Table 8.13: Median PGA (in units of g) and dispersion of fragility curves of the bridge systems
Slight Bridge Class MCSTEEL MSSTEEL MSPC SSPC MCRC-Slab MSRC-Slab MSRC
Moderate
Extensive
Complete
Median
Dispersion
Median
Dispersion
Median
Dispersion
Median
Dispersion
0.26 0.27 0.46 0.37 0.93 0.99 0.82
0.97 0.72 0.98 0.90 0.81 0.66 0.78
0.82 0.64 1.32 1.17 2.17 2.26 2.03
0.76 0.72 0.98 0.88 0.83 0.69 0.84
1.33 0.99 1.77 1.65 3.00 2.92 2.56
0.84 0.75 1.02 0.93 0.94 0.78 0.91
3.53 2.69 2.46 2.44 4.23 3.71 3.23
1.03 0.83 1.04 0.94 1.01 0.80 0.94
Figure 8.13 presents the fragility curves for all bridge classes based on the median and dispersion values shown in Table 8.13. Each plot of the figure represents the fragility curves for one specific 251
limit state. As seen in the figure, there are noticeable differences in the system-level bridge fragility curves of different bridge classes, which is mainly attributed to the relative vulnerability of the bearings used in each bridge class as previously discussed. Figure 8.13 shows that steel girder bridges, both simply-supported and continuous ones, are the most vulnerable bridge types in Texas, which is mainly because of their bearing types, as discussed in the previous section on component fragility curves. Prestressed concrete girder bridges are expected to have slightly better seismic performance compared to steel girder bridges. This observation is attributed to the fact that they have elastomeric bearings which are believed to exhibit better seismic performance compared to the steel bearings common in steel girder bridges. Reinforced concrete girder and slab bridges, however, are expected to be the least vulnerable, which is attributed to their bearing performance as discussed in the previous section. Recall that the largest PGA values recorded in the ground motions used in this report came from the November 7, 2016 Cushing, Oklahoma M5.0 event. The largest PGA recorded during this event was approximately 0.59g, which was at a hypocentral distance of 5.2km. Other stations ranging from 6.4km to 9.6km from the hypocenter recorded peak PGA values ranging from 0.20g to 0.32g. These data suggest that larger magnitude induced earthquake (M5+) have a significant likelihood of producing slight to moderate damage in steel and prestressed concrete girder bridges nearby the hypocenter (e.g., hypocentral distances less than approximately 10km). These fragility curves are used to develop a rapidly-deployable post-earthquake response plan for state officials. Establishing a post-event response plan facilitates economic and timely bridge inspections following a seismic event and can help ensure public safety. Details of this post-event response plan are discussed in Chapter 9. Slight
Moderate
Probability of damage
Extensive
Complete 1
1
1
1
0.8
0.8
0.8
0.8
0.6
0.6
0.6
0.6
0.4
0.4
0.4
0.4
0.2
0.2
0.2
0.2
0
0.2
0.4
0.6
0.8
1
PGA (g)
MCSTEEL MSSTEEL
0
0
0
0
0
0.2
0.4
0.6
0.8
1
PGA (g)
0
0.2
0.4
0.6
0.8
PGA (g)
MSPC MCRC-Slab SSPC MSRC-Slab Figure 8.13: Bridge fragility curves
1
0
0.2
0.4
0.6
0.8
1
PGA (g)
MSRC
Finally, it should be noted that the findings here are limited to the modeling assumptions of this study and the available data for Texas bridges. Specific examples of assumptions made in this study that may affect the assessment of seismic vulnerability of Texas bridges include, but are not limited to:
252
• In this study, heavily skewed (skew angles greater than 15 degrees) and curved bridges are ignored in the modeling assumptions. Such bridges have been shown to be particularly vulnerable to seismic hazards (Noori et al. 2016; Zakeri et al. 2013a; b). • The column height in the bridge samples in this study were determined using NBI underclearance data. Underclearance data is only provided for bridges that cross over navigable roadways; therefore, bridges that do not cross over navigable roadways or flyovers with multiple levels of roadway beneath are not represented in the bridge population statistics. Very tall bridges (e.g., tall flyovers) are expected to be much more flexible and may have very different seismic performance than the bridges considered in this study. Additionally, very short bridges, such as those over low-water crossings, may have short columns that are stiffer and more susceptible to shear failure modes, which may significantly affect seismic performance compared to the bridge samples considered in this study. • In this study, it is assumed that the probabilistic seismic demand models follow a power function with respect to the intensity measure, i.e., PGA, or in other words, a linear model in log-log space. This assumed model for the PSDM regression may not accurately capture nonlinear variations of seismic demands in all ranges of ground shaking intensity. Further research should be done on the appropriateness of other regression models for relating seismic response to ground shaking intensity over a broader range of seismic intensities. • The capacity models used in this study were largely based on those from previous bridge fragility studies. Due to the lack of data on the seismic performance of bearings used in reinforced concrete girder and slab bridges in Texas (i.e., those with dowels and simulated concrete-on-concrete friction), such bearings were assumed to have the same limit state capacity models as elastomeric bearings. The appropriateness of such an assumption should be evaluated as empirical seismic performance data from such bearings becomes available in future experimental research programs and earthquakes. • In the nonlinear bridge models used in this study, flexural hinges are assumed to occur at the top and bottom of the columns, which is an appropriate assumption for pile foundations and drilled shafts with larger diameter than the column above. This assumed column hinge model does not capture the potential location of hinge formation in integral column-shaft foundations where the drilled shafts have the same diameter as the columns above. In such integral column-shaft foundations, flexural hinges may form below the ground surface, the location of which is dependent on drilled shaft and soil properties and can only be captured with more sophisticated modeling of soil-structure interaction. Development of hinges below the ground surface may affect the column deformations, and thus fragilities, compared to the column hinge models assumed in this study.
8.7. Summary This chapter presents component-level and system-level fragile curves for the bridge classes considered in this study. The system-level fragility curves are developed considering the vulnerability of multiple components, i.e., bearings, columns, and abutments. To do so, the correlation of seismic demands in different components are taken into account. The system-level
253
fragility curves are generated by assuming that if any component exceeds any level of damage, the whole bridge exceeds that level of damage. The system-level fragility curves can used to inform post-earthquake inspection decisions (as will be discussed in the following chapter of this report), and the component-level fragility curves give a guidance to inspectors on which components are more vulnerable and may require additional attention during inspection. It is shown that steel girder bridges, both simply-supported and continuous bridges, are the most vulnerable bridge classes in Texas, which is mainly because of the steel bearings of these bridge classes. Furthermore, reinforced concrete bridges, both girder and slab types, are expected to have better seismic performance compared to the other bridge types in Texas. It is also shown that, regardless of the bridge class, abutments are the least vulnerable component of the bridges. Bearings are the most vulnerable components of the steel and prestressed concrete girder bridges, and columns are expected to be the most vulnerable component of reinforced concrete bridges. It should be also noted that the findings of this chapter are limited to the assumptions made in the bridge sampling and modeling process, which may warrant further investigation.
254
Chapter 9. Post-Earthquake Action Plans 9.1. Overview The chapter proposes a procedure to use the previously described fragility functions in developing a post-earthquake action plan. First, the inspection or action criteria must be defined by decision makers (e.g., TxDOT officials). Then, the bridges the seismic fragility curves can be used in conjunction with ground shaking intensity maps to identify the bridges that require inspection or some other action. For this chapter, implementation of a post-event action plan is demonstrated using the deterministic seismic scenario maps described in Chapter 5 and two assumed inspection criteria. Finally, the number of bridges requiring inspection for the two assumed criteria are compared to the existing criterion in TxDOT’s current post-event action plan.
9.2. Inspection Criteria After an earthquake, TxDOT’s initial approach is to inspect all the bridges within a specified radius of concern that depends on the earthquake magnitude, as given in Table 9.1. TxDOT would start its search within the radius of concern and would expand its inspection efforts outward if required. As seen in the table, the inspection plan only depends of the magnitude and location of the earthquake as does not account for bridge vulnerability or variability of ground motion shaking associated with soil conditions and event-to-event variability. Table 9.1: Existing response plan of TxDOT to earthquake
Earthquake Magnitude Mw < 4.0 4.0 < Mw < 4.5 4.5 < Mw < 5.0 5.0 < Mw < 5.5 Mw > 5.5
Radius of Concern (miles) N/A 6 9 14 30
To make more informed inspection decisions, the fragility curves developed in Chapter 9 can be used to account for the relative vulnerability of different bridge types to prioritize inspection of those bridges most likely to be damaged. Additionally, using ground motion intensity maps specific to the earthquake event and the soil conditions (e.g., the ShakeMaps produced by USGS following all events of M>3.0) will provide accurate estimations of the geographic distribution of ground shaking intensities for identifying areas of most concern. To develop a post-event action plan, first, a threshold for inspection must first be determined. Ultimately, TxDOT officials are responsible for determining this threshold based on the level of risk they are willing to assume. Here, as the purpose of demonstration, two examples of criteria are assumed as follows:
255
• Criterion 1: inspect all bridges that have at least a 10% probability of exceeding the Slight damage state. • Criterion 2: inspect all bridges that have at least a 5% probability of exceeding the Moderate damage state. Using the fragility curves developed in Chapter 9, one can find the threshold that correspond to the abovementioned criteria. For instance, Figure 9.1 shows the fragility curves that are developed for the MSSTEEL bridge class. As seen in the figure, the corresponding PGA values for the first and second criteria are 0.11 g and 0.19 g, respectively. In fact, for this bridge class, all the MSSTEEL bridges that are in areas with PGA ≥ 0.11 g and PGA ≥ 0.19 g would require inspection according to the first and second inspection criteria, respectively. The PGA thresholds for all other bridge classes can be computed by following in the same procedure. Table 9.2 presents the PGA thresholds for the two assumed inspection criteria for all bridge classes considered in this study. As seen in the table, MSSTEEL bridges have the lowest PGA values requiring inspection, representing the fact that MSSTEEL bridges are the most vulnerable bridges compared to all other bridge classes.
Criteria 1 0.1 0.05
Criteria 2
0.1
Figure 9.1: Fragility curves for MSSTEEL bridge class
256
Table 9.2: PGA threshold for different bridge classes
PGA Threshold (g) Bridge Classes
First criteria
Second criteria
MCSTEEL
0.13
0.23
MSSTEEL
0.11
0.19
MSPC
0.13
0.26
MSRC
0.30
0.50
MCRC-SLAB
0.32
0.55
MSRC-SLAB
0.42
0.72
Right after the earthquake, USGS generates ShakeMaps providing geographic distribution of various ground shaking intensity measures, such as PGA, PGV, and spectral accelerations at certain natural periods. One can use the USGS ShakeMap PGA contours corresponding to the thresholds in Table 9.2 to identify the areas over which inspection is required for each bridge class. In the absence of ShakeMaps form recent Texas earthquakes, the deterministic hazard maps shown in Figure 5.5 through Figure 5.12 demonstrate that with increasing distance from the epicenter, the PGA values rapidly diminish.
9.3. Inspection Decisions for Fort Worth Earthquake Scenario For purposes of demonstrating the post-event action plan, the M6 Fort Worth scenario presented in Chapter 5 of this report is considered. Figure 5.9 shows the deterministic hazard map developed for that earthquake scenario. As seen in the figure, the largest PGA in the vicinity of the earthquake epicenter is approximately 0.63g. Further from the epicenter, the values of PGA decrease. Figure 9.2 through Figure 9.7 show the locations of bridges from each bridge class overlaid on the scenario hazard map. The PGA contours correspond to the two example inspection criteria are shown for each bridge class, as well as the 30-mile radius of concern according to the existing TxDOT action plan. The location of each bridge is indicated by a dot in the figures. The existing inspection criteria requires that all bridges within the 30-mile radius of concern should be inspected, regardless of bridge class. However, the contours indicating the area for inspection using the two example criteria in the proposed action plan not only consider the relative vulnerability of each bridge class, but also take into account the effects of soil and ground motion characteristics specific to that particular earthquake event and location. These figures also show the locations of all the bridges that needs to be inspected for each bridge class.
257
Per first criterion
Per second criterion
Per existing criterion
Figure 9.2: Hazard map with MCSTEEL bridges
258
Per first criterion
Per second criterion
Per existing criterion
Figure 9.3: Hazard map with MSSTEEL bridges
259
Per first criterion
Per second criterion
Figure 9.4: Hazard map with MSPC bridges
260
Per existing criterion
Per first criterion
Per second criterion
Figure 9.5: Hazard map with MSRC bridges
261
Per existing criterion
Per first criterion
Per second criterion
Per existing criterion
Figure 9.6: Hazard map with MCRC-slab bridges
262
Per first criterion
Per second criterion
Per existing criterion
Figure 9.7: Hazard map with MSRC-slab bridges Table 9.3 shows the number of the bridges that would require inspection for this assumed M6 Fort Worth earthquake scenario for the existing criterion and the two example criteria for the proposed action plan. As seen in the table, for each bridge, there is a noticeable difference between the number of the bridges that require inspection based on the proposed criteria and existing criterion. For instance, based on the existing criteria, 1014 MSPC bridges need to be inspected after this earthquake; however, the two example criteria used in the proposed action plan lead to significantly lower numbers. Moreover, although the MSSTEEL bridge class is the most vulnerable bridge class, the table shows that MSPC bridge class has the largest number of bridges that need to be inspected, which is because of the frequency of the latter bridge class in the area that the earthquake happened.
263
Table 9.3: Number of bridges requiring inspection after the hypothetical M6 Fort Worth earthquake scenario
First criteria
Second criteria
Excising Criteria
Bridge Classes
10% probability of Slight damage
5% probability of Moderate damage
Bridge within 30 miles
MCSTEEL
102
57
188
MSSTEEL
12
8
28
MSPC
292
85
1014
MSRC
0
0
51
MCRC-SLAB
15
6
69
MSRC-SLAB
0
0
14
Total
421
156
1364
9.4. Summary This chapter presents a post-earthquake action plan based on the fragility curves that were developed in this study for different bridge classes. For implementation of this action plan, the user (i.e., TxDOT officials) should define a threshold for the action; then, using the Texas-specific fragility curves, the corresponding intensity measure (i.e., PGA) threshold requiring action can be identified. Maps of ground motion shaking intensity produced immediately following an earthquake event, along with the previously determined PGA thresholds, can be used to determine the area requiring action for each bridge class. This methodology not only takes into account the effects of the earthquake shaking on different bridge classes, but also considers the ground motions characteristics and soil effects specific to each earthquake event. A demonstration of the proposed post-event action plan using two example criteria for inspection was discussed using a hypothetical M6 Fort Worth earthquake scenario previously developed in Chapter 5.
264
References AASHTO. (2016). AASHTO LRFD Bridge Design Specifications. American Association of State Highway and Transportation Officials, Washington, DC. Al Aawar, W. (2015). “Non-linear modeling parameters for reinforced concrete columns with inadequate lap splices.” Abrams, M., and Hook, S. J. (1995). “Simulated ASTER data for geologic studies.” IEEE Transactions on Geoscience and remote sensing, IEEE, 33(3), 692–699. ACI. (2016). Code Requirements for Seismic Evaluation and Retrofit of Existing Concrete Buildings. American Concrete Institute, Committee 369. ACI Committee 318. (2014). Building Code Requirements for Structural Concrete (ACI 318-14). American Concrete Institute, Farmington Hills, Michigan,. Amirihormozaki, E., Pekcan, G., and Itani, A. (2015). “Analytical Modeling of Horizontally Curved Steel Girder Highway Bridges for Seismic Analysis.” Journal of Earthquake Engineering, 19(19). Anagnostopoulos, S. A. (1988). “Pounding of buildings in series during earthquakes.” Earthquake engineering & structural dynamics, Wiley Online Library, 16(3), 443–456. ASCE. (2014). Seismic evaluation and retrofit of existing buildings. ASCE/SEI 41-13, Reston, VA. ATC. (1985). Earthquake Damage Evaluation Data for California. Report No. ATC-13, Applied Technology Council. Atkinson, G. M., Greig, D. W., and Yenier, E. (2014). “Estimation of moment magnitude (M) for small events (M< 4) on local networks.” Seismological Research Letters, GeoScienceWorld, 85(5), 1116–1124. Atkinson, G. M., and Mahani, A. B. (2013). “Estimation of moment magnitude from ground motions at regional distances.” Bulletin of the Seismological Society of America, Seismological Society of America, 103(1), 107–116. Aviram, a., Aviram, a., Mackie, K., Mackie, K., Stojadinovic, B., and Stojadinovic, B. (2008). “Guidelines of Nonlinear Analysis of Bridge Structures in California.” PEER report, (August). Basoz, N., and Kiremidjian, A. S. (1996). “Risk assessment for highway systems.” Rep. No. 118, John A. Blume Earthquake Engineering Center. Boore, D. M. (2010). “Orientation-independent, nongeometric-mean measures of seismic intensity from two horizontal components of motion.” Bulletin of the Seismological Society of America, Seismological Society of America, 100(4), 1830–1835. Boulanger, R. W., Curras, C. J., Kutter, B. L., Wilson, D. W., and Abghari, A. (1999). “Seismic soil-pile-structure interaction experiments and analyses.” Journal of Geotechnical and Geoenvironmental Engineering, American Society of Civil Engineers, 125(9), 750–759. Bournonville, M., Dahnke, J., and Darwin, D. (2004). Statistical analysis of the mechanical properties and weight of reinforcing bars.
265
Bozorgzadeh, A., Megally, S. H., Ashford, S., and Restrepo, J. I. (2007). “Seismic response of sacrificial exterior shear keys in bridge abutments.” SSRP, 4, 14. Brown, L. T., Diehl, J. G., and Nigbor, R. L. (2000). “A simplified procedure to measure average shear-wave velocity to a depth of 30 meters (VS30).” Proceedings of 12th world conference on earthquake engineering. Caltrans. (1999). “Caltrans Seismic Design Criteria Version 1 . 1.” (July). Caltrans. (2013). “Seismic Design Criteria Version 1.7.” California Department of Transportation: Sacramento, CA, U.S., (April). Chen, W., and Duan, L. (2003). Bridge engineering: seismic design. CRC press. Choi, E. (2002). “Seismic Analysis and Retrofit of Mid-America Bridges.” Georgia Institute of Technology. Choi, E., DesRoches, R., and Nielson, B. (2004). “Seismic fragility of typical bridges in moderate seismic zones.” Engineering Structures, 26(2), 187–199. Chopra, A. (2012). Dynamics of Structures: Theory and Applications to Earthquake Engineering. Prentice Hall, New Jersey. Cornell, C. A., Jalayer, F., Hamburger, R. O., and Foutch, D. A. (2002). “Probabilistic Basis for 2000 SAC Federal Emergency Management Agency Steel Moment Frame Guidelines.” 128(4), 526–533. Cox, B. R., Bachhuber, J., Rathje, E., Wood, C. M., Dulberg, R., Kottke, A., Green, R. A., and Olson, S. M. (2011). “Shear wave velocity-and geology-based seismic microzonation of Portau-Prince, Haiti.” Earthquake Spectra, 27(S1), S67–S92. Crone, A. J., and Luza, K. V. (1990). “Style and timing of Holocene surface faulting on the Meers fault, southwestern Oklahoma.” Geological Society of America Bulletin, Geological Society of America, 102(1), 1–17. CSI. (2016). “SAP200 v19. Retrieved from https://www.csiamerica.com/products/sap2000.” Davis, S. D., and Frohlich, C. (1993). “Did (or will) fluid injection cause earthquakes?-criteria for a rational assessment.” Seismological Research Letters, GeoScienceWorld, 64(3-4), 207– 224. Davis, S. D., Nyffenegger, P. A., and Frohlich, C. (1995). “The 9 April 1993 earthquake in southcentral Texas: Was it induced by fluid withdrawal?” Bulletin of the Seismological Society of America, Seismological Society of America, 85(6), 1888–1895. DesRoches, R., and Fenves, G. L. (1997). NEW DESIGN AND ANALYIS PROCEDURES FOR INTERMEDIATE HINGES IN MULTIPLE-FRAME BRIDGES. Doser, D. I., Baker, M. R., Luo, M., Marroquin, P., Ballesteros, L., Kingwell, J., Diaz, H. L., and Kaip, G. (1992). “The not so simple relationship between seismicity and oil production in the Permian Basin, West Texas.” pure and applied geophysics, Springer, 139(3-4), 481–506. Douglas, J. (2016). Ground motion prediction equations 1964–2016. Department of Civil and Environmental Engineering, University of Strathclyde, Glasgow, United Kingdom,. Eaton, D. W., and Mahani, A. B. (2015). “Focal mechanisms of some inferred induced earthquakes in Alberta, Canada.” Seismological Research Letters, GeoScienceWorld, 86(4), 1078–1085. Elnashai, A. S., Borzi, B., and Vlachos, S. (2004). “Deformation-based vulnerability functions for
266
RC bridges.” Structural Engineering and Mechanics, Taejon, Korea: Techno-Press, c1993-, 17(2), 215–244. Fan, Z., Eichhubl, P., Gale, J., Olson, J. E., Frohlich, C., and Gono, V. (2014). “Was the Timpson, Texas, M4. 8 event induced by fluid injection?” AGU Fall Meeting Abstracts. Fang, J. Q., Li, Q. S., Jeary, A. P., and Liu, D. K. (1999). “Damping of tall buildings: Its evaluation and probabilistic characteristics.” The Structural Design of Tall Buildings, John Wiley & Sons, Ltd., 8(2), 145–153. Farahbod, A. M., Kao, H., Cassidy, J. F., and Walker, D. (2015). “How did hydraulic-fracturing operations in the Horn River Basin change seismicity patterns in northeastern British Columbia, Canada?” The Leading Edge, Society of Exploration Geophysicists, 34(6), 658– 663. de Felice, G., and Giannini, R. (2010). “An efficient approach for seismic fragility assessment with application to old reinforced concrete bridges.” Journal of Earthquake Engineering, Taylor & Francis, 14(2), 231–251. FEMA. (2003). HAZUS-MH MR4: Technical Manual. Vol. Earthquake Model. Federal Emergency Management Agency, Washington DC. FHWA. (1995). Recording and Coding Guide for the Structure Inventory and Appraisal of the Nation’s Bridges. Vol. FHWA-PD-96-001. Office of Engineering Bridge Division, Federal Highway Administration, McLean, VA. Filipov, E. (2012). “Nonlinear seismic analysis of quasi-isolation systems for earthquake protection of bridges.” Frohlich, C. (2012). “Two-year survey comparing earthquake activity and injection-well locations in the Barnett Shale, Texas.” Proceedings of the National Academy of Sciences, National Acad Sciences, 109(35), 13934–13938. Frohlich, C., and Brunt, M. (2013). “Two-year survey of earthquakes and injection/production wells in the Eagle Ford Shale, Texas, prior to the MW4. 8 20 October 2011 earthquake.” Earth and Planetary Science Letters, Elsevier, 379, 56–63. Frohlich, C., and Davis, S. D. (2002). Texas earthquakes. University of Texas Press. Frohlich, C., Deshon, H., Stump, B., Hayward, C., Hornbach, M., and Walter, J. I. (2016a). “A Historical Review of Induced Earthquakes in Texas.” Seismological Research Letters, 87(4), 1–17. Frohlich, C., DeShon, H., Stump, B., Hayward, C., Hornbach, M., and Walter, J. I. (2016b). “A historical review of induced earthquakes in Texas.” Seismological Research Letters, GeoScienceWorld, 87(4), 1022–1038. Frohlich, C., Ellsworth, W., Brown, W. A., Brunt, M., Luetgert, J., MacDonald, T., and Walter, S. (2014). “The 17 May 2012 M4. 8 earthquake near Timpson, East Texas: An event possibly triggered by fluid injection.” Journal of Geophysical Research: Solid Earth, Wiley Online Library, 119(1), 581–593. Fumal, Te., and Tinsley, J. C. (1985). “Mapping shear-wave velocities of near-surface geologic materials.” Evaluating earthquake hazards in the Los Angeles region: an earth-science perspective, US Geol. Surv. Profess. Pap, 1360, 101–126. Ghannoum, W., and Sivaramakrishnan, B. (2012a). ACI 369 rectangular column database. Data
267
set. . Ghannoum, W., and Sivaramakrishnan, B. (2012b). ACI 369 circular column database. Dataset. . Goldsmith, W. (1978). Impact: the theory and physical behaviour of colliding solids. University Microfilms. Goulet, C. A., Cramer, C. H., Darragh, R. B., Silva, W. J., Hashash, Y. M. A., Harmon, J., Stewart, J. P., Wooddell, K. E., and Youngs, R. R. (2014). “PEER NGA-East database.” PEER Report 2014, 17. Gupta, H. K. (2002). “A review of recent studies of triggered earthquakes by artificial water reservoirs with special emphasis on earthquakes in Koyna, India.” Earth-Science Reviews, Elsevier, 58(3), 279–310. Hamidreza, B., Ahmad, M. I., and Ian, G. B. (2010). “Guidelines for the Seismic Design of Ductile End Cross Frames in Steel Girder Bridge Superstructures.” Unr, Report No.(July). Harding, S. T. (1981). “Induced seismic Cogdell Canyon Reef oil field.” US Geol. Surv. OpenFile Rept, 67–81. Hassani, B., and Atkinson, G. M. (2015). “Referenced Empirical Ground-Motion Model for Eastern North America.” Seismological Research Letters, 86, 477–491. Healy, J. H., Rubey, W. W., Griggs, D. T., and Raleigh, C. B. (1968). “The denver earthquakes.” Science, 161(3848), 1301–1310. Herrmann, R. B., Benz, H., and Ammon, C. J. (2011). “Monitoring the earthquake source process in North America.” Bulletin of the Seismological Society of America, Seismological Society of America, 101(6), 2609–2625. Hinton, D. D., and Olien, R. M. (2002). Oil in Texas: the gusher age, 1895-1945. University of Texas Press. Holland, A. (2011). Examination of possibly induced seismicity from hydraulic fracturing in the Eola Field, Garvin County, Oklahoma. Oklahoma Geological Survey. Hornbach, M. J., DeShon, H. R., Ellsworth, W. L., Stump, B. W., Hayward, C., Frohlich, C., Oldham, H. R., Olson, J. E., Magnani, M. B., Brokaw, C., and others. (2015). “Causal factors for seismicity near Azle, Texas.” Nature communications, Nature Publishing Group, 6. Horton, S. (2012). “Disposal of hydrofracking waste fluid by injection into subsurface aquifers triggers earthquake swarm in central Arkansas with potential for damaging earthquake.” Seismological Research Letters, GeoScienceWorld, 83(2), 250–260. Hough, S. E. (2014). “Shaking from injection-induced earthquakes in the central and eastern United States.” Bulletin of the Seismological Society of America, Seismological Society of America. Hough, S. E., Armbruster, J. G., Seeber, L., and Hough, J. F. (2000). “On the modified Mercalli intensities and magnitudes of the 1811--1812 New Madrid earthquakes.” Journal of Geophysical Research: Solid Earth, Wiley Online Library, 105(B10), 23839–23864. Huntington, D. E., and Lyrintzis, C. S. (1998). “Improvements to and limitations of Latin hypercube sampling.” Probabilistic Engineering Mechanics, Elsevier, 13(4), 245–253. Iman, R. L., and Conover, W.-J. (1982). “A distribution-free approach to inducing rank correlation among input variables.” Communications in Statistics-Simulation and Computation, Taylor 268
& Francis, 11(3), 311–334. Iwahashi, J., and Pike, R. J. (2007). “Automated classifications of topography from DEMs by an unsupervised nested-means algorithm and a three-part geometric signature.” Geomorphology, Elsevier, 86(3), 409–440. Janská, E., and Eisner, L. (2012). “Ongoing seismicity in the Dallas-Fort Worth area.” The Leading Edge, Society of Exploration Geophysicists, 31(12), 1462–1468. Justinic, A. H., Stump, B., Hayward, C., and Frohlich, C. (2013). “Analysis of the Cleburne, Texas, earthquake sequence from June 2009 to June 2010.” Bulletin of the Seismological Society of America, Seismological Society of America, 103(6), 3083–3093. Kahle, A. B., and Rowan, L. C. (1980). “Evaluation of multispectral middle infrared aircraft images for lithologic mapping in the East Tintic Mountains, Utah.” Geology, Geological Society of America, 8(5), 234–239. Karim, K. R., and Yamazaki, F. (2003). “A simplified method of constructing fragility curves for highway bridges.” Earthquake engineering & structural dynamics, Wiley Online Library, 32(10), 1603–1626. Keller, G. R., Rogers, A. M., and Orr, C. D. (1987). “Seismic Activity in the Permian Basin Area of West Texas and Southeastern New Mexico, 1975--79.” Seismological Research Letters, GeoScienceWorld, 58(2), 63–70. Kent, D. C., and Park, R. (1971). “Flexural members with confined concrete.” Journal of the Structural Division. Keranen, K. M., Weingarten, M., Abers, G. A., Bekins, B. A., and Ge, S. (2014). “Sharp increase in central Oklahoma seismicity since 2008 induced by massive wastewater injection.” Science, American Association for the Advancement of Science, 345(6195), 448–451. Kim, B., Hashash, Y. M. A., Rathje, E. M., Stewart, J. P., Ni, S., Somerville, P. G., Kottke, A. R., Silva, W. J., and Campbell, K. W. (2016). “Subsurface Shear Wave Velocity Characterization Using P-Wave Seismograms in Central and Eastern North America.” Earthquake Spectra, Earthquake Engineering Research Institute, 32(1), 143–169. Der Kiureghian, A. (2002). “Bayesian methods for seismic fragility assessment of lifeline components.” Acceptable Risk Processes--Lifelines and Natural Hazards, 61–77. Kottke, A. R., Hashash, Y., Stewart, J. P., Moss, C. J., Nikolaou, S., Rathje, E. M., Silva, W. J., and Campbell, K. W. (2012). “Development of geologic site classes for seismic site amplification for central and eastern North America.” Kramer, S. L. (1996). Geotechnical earthquake engineering. Prentice Hall, New Jersey. Lou, K., and Cheng, F. Y. (1996). “Post-earthquake assessment of bridge colapso and design parameters.” 11th World Conference on Earthquake Engineering, CD ROOM, paper. Mackie, K., and Stojadinovic, B. (2004). “Fragility curves for reinforced concrete highway overpass bridges.” 13th World Conference on Earthquake Engineering, 1–6. Mackie, K., and Stojadinović, B. (2001). “Probabilistic seismic demand model for California highway bridges.” Journal of Bridge Engineering, American Society of Civil Engineers, 6(6), 468–481. Maison, B. F., and Kasai, K. (1990). “SLAM-2: A Computer Program for the Analysis of Structural Pounding (Extended Version).” June, Available from the National Information 269
Service for Earthquake Engineering, University of California, Berkeley, CA. Mander, J. B., Priestley, M. J. N., and Park, R. (1988). “Theoretical stress-strain model for confined concrete.” Journal of structural engineering, American Society of Civil Engineers, 114(8), 1804–1826. Mander, J., Kim, D., Chen, S., and Premus, G. (1996). “Response of steel bridge bearings to the reversed cyclic loading.” Technical Report NCEER 96-0014, Buffalo, NY. McGann, C. R., Arduino, P., and Mackenzie-Helnwein, P. (2011). “Simplified procedure to account for a weaker soil layer in lateral load analysis of single piles.” Journal of Geotechnical and Geoenvironmental Engineering, American Society of Civil Engineers, 138(9), 1129–1137. McKenna, F., Fenves, G. L., Scott, M. H., and others. (2000). “Open system for earthquake engineering simulation.” University of California, Berkeley, CA. Mtenga, P. V. (2007). Elastomeric Bearing Pads Under Combined Loading. Report to the Florida Department of Transportation, Contract No: BC352-16, Tallahassee, FL. Muthukumar, S. (2003). “A contact element approach with hysteresis damping for the analysis and design of pounding in bridges.” Georgia Institute of Technology. Ni, S., Li, Z., and Somerville, P. (2014). “Estimating subsurface shear velocity with radial to vertical ratio of local P waves.” Seismological Research Letters, GeoScienceWorld, 85(1), 82–90. Nicholson, C., and Wesson, R. L. (1990). Earthquake hazard associated with deep well injection. Alexandria, VA (United States); US Geological Survey. Nicot, J.-P., and Scanlon, B. R. (2012). “Water use for shale-gas production in Texas, US.” Environmental science & technology, ACS Publications, 46(6), 3580–3586. Nielson, B. G. (2005). “Analytical fragility curves for highway bridges in moderate seismic zones.” Environmental Engineering, (December), 400. Nielson, B. G., and DesRoches, R. (2007a). “Analytical seismic fragility curves for typical bridges in the central and southeastern United States.” Earthquake Spectra, 23(3), 615–633. Nielson, B. G., and DesRoches, R. (2007b). “Seismic fragility methodology for highway bridges using a component level approach.” Earthquake Engineering & Structural Dynamics, 36, 823–839. Noori, H. Z., Amiri, G. G., Nekooei, M., and Zakeri, B. (2016). “Seismic fragility assessment of skewed MSSS-I girder concrete bridges with unequal height columns.” Journal of Earthquake and Tsunami, World Scientific, 10(01), 1550013. Olien, R. M. (2010). “Oil and gas industry.” Handbook of Texas Online, Texas State Historical Association, http://www. tshaonline. org/handbook/online/articles/doogz (last accessed August 2015. Olson, D. R., and Frohlich, C. (1992). “Research Note: Felt Reports from the 20 July 1991 Falls City Earthquake, Karnes County, Texas.” Seismological Research Letters, GeoScienceWorld, 63(4), 603–604. Olsson, A. M. J., and Sandberg, G. E. (2002). “Latin hypercube sampling for stochastic finite element analysis.” Journal of Engineering Mechanics, American Society of Civil Engineers, 128(1), 121–125. 270
Padgett, J. E. (2007). “Seismic Vulnerability Assessment of Retrofitted Bridges Using Probabilistic Methods Seismic Vulnerability Assessment of Retrofitted Bridges Using Probabilistic.” Environmental Engineering, 1–10. Padgett, J. E., and DesRoches, R. (2007). “Bridge functionality relationships for improved seismic risk assessment of transportation networks.” Earthquake Spectra, 23(1), 115–130. Padgett, J. E., Nielson, B. G., and Desroches, R. (2008). “Selection of optimal intensity measures in probabilistic seismic demand models of highway bridge portfolios.” (December 2007), 711–725. Pan, Y. (2007). “Seismic fragility and risk management of highway bridges in New York State.” 12(December), 10031. Pan, Y., Agrawal, A. K., Ghosn, M., and Alampalli, S. (2010). “Seismic Fragility of Multispan Simply Supported Steel Highway Bridges in New York State. II: Fragility Analysis, Fragility Curves, and Fragility Surfaces.” Journal of Bridge Engineering, 15(5), 462–472. Parker, G. A., Harmon, J. A., Stewart, J. P., Hashash, Y. M. A., Kottke, A. R., Rathje, E. M., Silva, W. J., and Campbell, K. W. (2017). “Proxy-Based VS30 Estimation in Central and Eastern North America.” Bulletin of the Seismological Society of America, Seismological Society of America. Patel, R., Dubey, S. K., and Pathak, K. K. (2014). “Effect of depth span ratio on the behaviour of beams.” International Journal of Advanced Structural Engineering (IJASE), Springer, 6(2), 3. Pennington, W. D., Davis, S. D., Carlson, S. M., DuPree, J., and Ewing, T. E. (1986). “The evolution of seismic barriers and asperities caused by the depressuring of fault planes in oil and gas fields of south Texas.” Bulletin of the Seismological Society of America, Seismological Society of America, 76(4), 939–948. Petersen, B. M. D., Mueller, C. S., Moschetti, M. P., Hoover, S. M., Rubinstein, J. L., Andrea, L., Michael, A. J., Ellsworth, W. L., Mcgarr, A. F., Holland, A. A., Anderson, J. G., Jewell, S., and Survey, U. S. G. (2015). “Incorporating Induced Seismicity in the 2014 United States National Seismic Hazard Model — Results of 2014 Workshop and Sensitivity Studies.” USGS Open File Report, 2015-1070, 75. Petersen, M. D., Mueller, C. S., Moschetti, M. P., Hoover, S. M., Shumway, A. M., McNamara, D. E., Williams, R. A., Llenos, A. L., Ellsworth, W. L., Michael, A. J., and others. (2017). “2017 one-year seismic-hazard forecast for the Central and Eastern United States from induced and natural earthquakes.” Seismological Research Letters, GeoScienceWorld, 88(3), 772–783. Petersen, M., Mueller, C. S., Moschetti, M. P., Hoover, S. M., Llenos, A. L., Ellsworth, W. L., Michael, A. J., Rubinstein, J. L., McGarr, A. F., and Rukstales, K. S. (2016a). “2016 OneYear Seismic Hazard Forecast for the Central and Eastern United States from Induced and Natural Earthquakes.” Open-File Report, (June), 1–50. Petersen, M., Mueller, C. S., Moschetti, M. P., Hoover, S. M., Llenos, A. L., Ellsworth, W. L., Michael, A. J., Rubinstein, J. L., Mcgarr, A. F., Rukstales, K. S., Jewell, S., Kimball, S. M., and Survey, U. S. G. (2016b). “2016 One-Year Seismic Hazard Forecast for the Central and Eastern United States from Induced and Natural Earthquakes.” Pottatheere, P., and Renault, P. (2008). “Seismic vulnerability assessment of skew bridges.”
271
Proceedings of Fourteenth World Conference on Earthquake Engineering. Beijing, China. Pratt, W. E., and Johnson, D. W. (1926). “Local subsidence of the Goose Creek oil field.” The Journal of Geology, University of Chicago Press, 34(7, Part 1), 577–590. Priestley, M. J. N., Seible, F., and Calvi, G. M. (1996). Seismic design and retrofit of bridges. John Wiley & Sons. Ramanathan, K. N. (2012). Next generation seismic fragility curves for California bridges incorporating the evolution in seismic design philosophy. Georgia Institute of Technology. Ramelli, A. R., and Slemmons, D. B. (1990). “Implications of the Meers fault on seismic potential in the central United States.” Reviews in Engineering Geology, Geological Society of America, 8, 59–76. Rashidi, S., and Ala Saadeghvaziri, M. (1997). “Seismic Modeling of Multi-Span SimplySupported Bridges UsingAdina.” Computers & Structures, 64(5/6), 1025–1039. RISA-Technologies. (2016). “RISA-3D. Retrieved from http://risa.com/p_risa3d.html.” Rogers, A. M., and Malkiel, A. (1979). “A study of earthquakes in the Permian Basin of TexasNew Mexico.” Bulletin of the Seismological Society of America, Seismological Society of America, 69(3), 843–865. Sanford, A., Balch, R., Jaksha, L., and Delap, S. (1993). “Location and Fault Mechanism of the 2 January 1992 Rattlesnake Canyon Earthquake in Southeastern New Mexico.” Open-File Rept, 70. Sellards, E. H. (1933). “The Wortham-Mexia, Texas, earthquake.” Contributions to Geology, Univ. Texas Bull, 3201, 105–112. Shinozuka, M., Feng, M. Q., Kim, H., Uzawa, T., and Ueda, T. (2003). Statistical analysis of fragility curves. Report No. MCEER-03-0002, MCEER. Shinozuka, M., Feng, M. Q., Kim, H.-K., and Kim, S.-H. (2000a). “Nonlinear static procedure for fragility curve development.” Journal of engineering mechanics, American Society of Civil Engineers, 126(12), 1287–1295. Shinozuka, M., Feng, M. Q., Lee, J., and Naganuma, T. (2000b). “Statistical analysis of fragility curves.” Journal of engineering mechanics, American Society of Civil Engineers, 126(12), 1224–1231. Skoumal, R. J., Brudzinski, M. R., and Currie, B. S. (2015). “Earthquakes induced by hydraulic fracturing in Poland Township, Ohio.” Bulletin of the Seismological Society of America, Seismological Society of America, 105(1), 189–197. Stewart, J. P., Klimis, N., Savvaidis, A., Theodoulidis, N., Zargli, E., Athanasopoulos, G., Pelekis, P., Mylonakis, G., and Margaris, B. (2014). “Compilation of a local VS profile database and its application for inference of VS30 from geologic-and terrain-based proxies.” Bulletin of the Seismological Society of America, Seismological Society of America, 104(6), 2827–2841. Suckale, J. (2009). “Induced seismicity in hydrocarbon fields.” Advances in geophysics, Elsevier, 51, 55–106. Sullivan, I., and Nielson, B. G. (2010). “Sensitivity analysis of seismic fragility curves for skewed multi-span simply supported steel girder bridges.” Structures Congress 2010: 19th Analysis and Computation Specialty Conference, 226–237. Tavares, D. H., Suescun, J. R., Paultre, P., and Padgett, J. E. (2013). “Seismic Fragility of a 272
Highway Bridge in Quebec.” Journal of Bridge Engineering, 18(11), 1131–1139. Texas House Bill 2. (2015). http://www.capitol.state.tx.us/tlodocs/84R/billtext/pdf/HB00002F.pdf, accessed 15 September 2015. Torbol, M., and Shinozuka, M. (2012). “Effect of the angle of seismic incidence on the fragility curves of bridges.” Earthquake Engineering & Structural Dynamics, Wiley Online Library, 41(14), 2111–2124. TxDOT. (1962). As-built Drawing – NBI Bridge No. 161780032603016. Texas Department of Transportation, Austin, TX. TxDOT. (2004). Bridge Standards – Steel Beam Spans 24’ Roadway (SSB-24). Texas Department of Transportation, Austin, Tx. Retrieved from: http://www.txdot.gov/insdtdot/orgchart/cmd/cserve/standard/bridge-e.htm#STEELBEAMS. TxDOT. (2005). Bridge Standards – 30’-4” Concrete Slab and Girder Span – 24ft Roadway (CG30-24). Texas Department of Transportation, Austin, TX. Retrieved from: http://www.txdot.gov/insdtdot/orgchart/cmd/cserve/standard/bridgee.htm#CONCRETESLAB&GIRDER(PANFORM). TxDOT. (2006). Bridge Standards – Steel Beam Standard Design (SBSD). Texas Department of Transportation, Austin, Tx, Retrieved from: http://www.txdot.gov/insdtdot/orgchart/cmd/cserve/standard/bridge-e.htm#STEELBEAMS. TxDOT. (2015). Bridge Standards – Common Foundation Details (FD). Texas Department of Transportation, Austin, TX. Retrieved from: www.dot.state.tx.us/insdtdot/orgchart/cmd/cserve/standard/bridge-e.htm. TxDOT. (2017). Bridge Standards – Prestressed Concrete I-Girders. Texas Department of Transportation, Austin, TX. Retrieved from: http://www.txdot.gov/insdtdot/orgchart/cmd/cserve/standard/bridgee.htm#PRESTRESSEDCONCRETEI-GIRDERS. U.S. Department of Transportation Federal Highway Administration. (2014). “LRFD Seismic Analysis and Design of Bridges - Reference Manual.” (FHWA-NHI-15-004), 608. Udden, J. A. (1926). The Southwest Earthquake of July 30, 1925. University of Texas at Austin. Unanwa, C., and Mahan, M. (2012). “Statistical analysis of concrete compressive strengths for California highway bridges.” Journal of Performance of Constructed Facilities, American Society of Civil Engineers, 28(1), 157–167. Voss, J. A., and Herrmann, R. B. (1980). “A surface wave study of the June 16, 1978 Texas earthquake.” Seismological Research Letters, GeoScienceWorld, 51(1), 1–14. Wald, D. J., and Allen, T. I. (2007). “Topographic slope as a proxy for seismic site conditions and amplification.” Bulletin of the Seismological Society of America, Seismological Society of America, 97(5), 1379–1395. Walsh, F. R., and Zoback, M. D. (2015). “Oklahoma’s recent earthquakes and saltwater disposal.” Science advances, American Association for the Advancement of Science, 1(5), e1500195. Walter, J. I., Dotray, P. J., Frohlich, C., and Gale, J. F. W. (2016). “Earthquakes in northwest Louisiana and the Texas--Louisiana border possibly induced by energy resource activities within the Haynesville Shale Play.” Seismological Research Letters, GeoScienceWorld. Weingarten, M., Ge, S., Godt, J. W., Bekins, B. A., and Rubinstein, J. L. (2015). “High-rate 273
injection is associated with the increase in US mid-continent seismicity.” Science, American Association for the Advancement of Science, 348(6241), 1336–1340. Wills, C. J., and Clahan, K. B. (2006). “Developing a map of geologically defined site-condition categories for California.” Bulletin of the Seismological Society of America, Seismological Society of America, 96(4A), 1483–1501. Wills, C. J., Petersen, M., Bryant, W. A., Reichle, M., Saucedo, G. J., Tan, S., Taylor, G., and Treiman, J. (2000). “A site-conditions map for California based on geology and shear-wave velocity.” Bulletin of the Seismological Society of America, Seismological Society of America, 90(6B), S187–S208. Wills, C. J., and Silva, W. (1998). “Shear-wave velocity characteristics of geologic units in California.” Earthquake Spectra, 14(3), 533–556. Wolf, J. P., and Skrikerud, P. E. (1980). “Mutual pounding of adjacent structures during earthquakes.” Nuclear Engineering and Design, Elsevier, 57(2), 253–275. Yamazaki, F., Hamada, T., Motoyama, H., and Yamauchi, H. (1999). “Earthquake damage assessment of expressway bridges in Japan.” Optimizing Post-Earthquake Lifeline System Reliability, 361–370. Yerkes, R. F., and Castle, R. O. (1976). “Seismicity and faulting attributable to fluid extraction.” Engineering Geology, Elsevier, 10(2-4), 151–167. Yong, A. (2007). “Geophysical site characterization using geomorphology, geology and integrated digital imaging methods on satellite data.” California State University, Northridge. Yong, A., Hough, S. E., Iwahashi, J., and Braverman, A. (2012). “A terrain-based site-conditions map of California with implications for the contiguous United States.” Bulletin of the Seismological Society of America, Seismological Society of America, 102(1), 114–128. Zakeri, B., Padgett, J. E., and Amiri, G. G. (2013a). “Fragility analysis of skewed single-frame concrete box-girder bridges.” Journal of Performance of Constructed Facilities, American Society of Civil Engineers, 28(3), 571–582. Zakeri, B., Padgett, J. E., and Ghodrati Amiri, G. (2013b). “Fragility assessment for seismically retrofitted skewed reinforced concrete box girder bridges.” Journal of Performance of Constructed Facilities, American Society of Civil Engineers, 29(2), 4014043. Zalachoris, G., Rathje, E. M. (2018). “Ground Motion Prediction Equation for Small-to-Moderate Earthquake Events in Texas, Oklahoma, and Kansas.” Earthquake Spectra, (In prepar. Zalachoris, G., and Rathje, E. M. (2017). “Ground Motion Models for Earthquake Events in Texas , Oklahoma , and Kansas.” 3rd International Conference on Performance Based Design in Earthquake Geotechnical Engineering, Vancouver, BC, Canada. Zalachoris, G., Rathje, E. M., and Paine, J. G. (2017). “V S30 Characterization of Texas , Oklahoma , and Kansas Using the P-Wave Seismogram Method.” Earthquake Spectra, 33(3), 943–961.
274
Appendix A. Records of Earthquakes in Texas This section addresses the ground motions recorded in Texas. In this regard, Table A.1 contains the catalog of Texas earthquakes having magnitude 3 or greater. This catalog is a compilation of earthquakes having magnitudes of 3 or greater as reported by Frohlich and Davis (2002), the International Seismological Centre (ISC), or the National Earthquake Information Centre. Focal mechanisms are available for entries in bold type. Tabled origin times and epicenters are as reported by the indicated agency, rounded to nearest second and 0.01° of latitude and longitude. Agencies are as cited in reference list: CMT – centroid moment tensor (Harvard University); GCMT – global centroid moment tensor (Columbia University); IDC – International Data Centre, Comprehensive Nuclear Test Ban Treaty (Austria); ISC – International Seismological Centre (United Kingdom); NEIC – National Earthquake Information Center (U.S.A.); SLM – St. Louis University moment tensor. Tabled magnitudes (Mag) are (1) those reported Frohlich and Davis (2002), if available; (2) moment magnitude MW, if available; or otherwise (3) as reported by the U.S. Geological Survey. Magnitude types are: mN – estimated from felt area; Mcorr – corrected magnitude of Rogers and Malkiel (1979); MC – coda-length magnitude; MW – moment magnitude; ML – local magnitude; MS - surface wave magnitude; mb – body-wave magnitude; mbLg – magnitude derived from 1-second Lg waves. Values for maximum reported Mercalli intensity (Imax) are (1) as reported by Frohlich and Davis (2002); (2) as determined in a field investigation; or otherwise (3) as reported by the U.S. Geological Survey. Felt areas are as reported by Frohlich and Davis (2002) or as reported in a subsequent publication. Type is assessed from scores assigned for answers to questions as described in Table 1 and Table 2: score 0.0-1.0 – T: tectonic; score 1.5-2.0 – PsI: possibly induced; score 2.5-3.5 – PrI: probably induced; score 4.05.0 – ACI: almost certainly induced; ?? – possibly spurious report (i.e., may be grossly mislocated, or may not be an earthquake). Then, Table A.2 presents catalog of Texas earthquakes, scored to assess whether event may be induced. Columns QT to QP show score for answers to questions 1 to 5 in Table 1 (0.0 for “No”, 0.5 for “possibly”, 1.0 for “yes”); sum column is sum of scores. Type is: T (tectonic) = 0.0 to 1.0; PsI (possibly induced) = 1.5 to 2.0; PrI (probably induced) = 2.5-3.5; ACI (almost certainly induced) = 4.0-5.0; ?? – possibly spurious report. Ref column indicates reference providing published evidence indicating the event is ACI or PrI.
275
Table A.1: Catalog of Texas earthquakes having magnitude 3 or greater Date and origin time 02 04:30 17:57 22:14 20 06 19
Lat °N
Imax
Mag
Agency
29.6 30.25 30.15 30.53 32. 31.7 31.10
98.0 97.6 97.06 96.3 106.5 95.2 97.60
3.6 3.1 4.1 3.3 3.6 4.0 3.9
mN mN mN mN mN mN mN
V III-IV V-VI IV V VI IV-V
35.20
101.80
3.6
mN
V
96.00 95.90 101.30 106.5 94.98 101.2 101.3 101.1 104.6 104.6 104.6 104.6 104.6 104.6 104.6 104.6 104.6 104.6 104.6 106.5 104.6
Davis et al. (1989) Docekal (1970) Davis et al. (1989) Davis et al. (1989) Davis et al. (1989) Docekal (1970) Davis et al. (1989) Northrup & Sanford (1972) Docekal (1970) von Hake & Cloud (1971) Woolard (1968) Docekal (1970) Pratt & Johnson (1926) Docekal (1970) Docekal (1970) Davis et al. (1989) Davis et al. (1989) Davis et al. (1989) Dumas et al. (1980) Davis et al. (1989) Davis et al. (1989) Davis et al. (1989) Davis et al. (1989) Davis et al. (1989) Davis et al. (1989) Davis et al. (1989) Davis et al. (1989) Docekal (1970) Davis et al. (1989)
3.8 3.3 3.9 4.7
mN mN mN mN
IV IV VI VI
7600 200,000
3.3 5.4 3.0 3.6 3.0 6.3 3.0 3.3 3.3 3.6 3.0 4.2 3.0 3.6 3.2 3.0
mN mN mN mN mN MW mN mN mN mN mN mN mN mN mN mN
IV VI III V III VIII III IV IV V III V III III II-III III
14 Feb. 1 May 5 Jan. 31 Jan. 31 May 8 Jan. 9 Oct.
1847 1873 1887 1887 1889 1891 1902
Apr.
1907
8 May 30 Dec. 28 Mar. 7 Mar. 29 July 30 July 31 July 16 Aug. 16 Aug. 16 Aug. 16 Aug. 16 Aug. 16 Aug. 16 Aug. 18 Aug. 18 Aug. 18 Aug. 26 Aug. 2 Oct. 3 Nov.
1910 1914 1917 1923 1925 1925 1925 1925 1931 1931 1931 1931 1931 1931 1931 1931 1931 1931 1931 1931 1931
11:30 12:17 18 08 11:15 11:40:22 12:17 12:45 13:35 19:33 08:42 19:36 22 — — 15:50
30.10 30.50 35.40 31.8 29.70 34.5 35.4 35.5 30.7 30.7 30.7 30.7 30.7 30.7 30.7 30.7 30.7 30.7 30.7 31.8 30.7
9 Apr.
1932
10:17
31.7
96.4
Reagor et al. (1982)
4.0
mN
12 Apr.
1934
01:40
33.9
95.5
Docekal (1970)
4.2
mN
17:30 01:00 29:56 05:03
Felt area (km2) 1200 — 4600 — — — 5600
Lon °W
276
Type/Location
County
T T T T T T T
Seguin Manor Paige Wellborn El Paso Rusk Creedmoor
Guadalupe Travis Bastrop Brazos El Paso Cherokee Travis
??
Amarillo
Potter
— 520,000 — — — 1,000,000 — — — — — 20,000 — 6,800 — —
T T T T PrI ?? PsI PsI T T T T T T T T T T T T T
Waller Grimes Carson El Paso Harris Briscoe Carson Carson Jeff Davis Jeff Davis Jeff Davis Jeff Davis Jeff Davis Jeff Davis Jeff Davis Jeff Davis Jeff Davis Jeff Davis Jeff Davis El Paso Jeff Davis
VI
6,400
ACI
V
13,000
T
Hempstead Anderson Panhandle El Paso Goose Creek Silverton Panhandle White Deer Valentine Valentine Valentine Valentine Valentine Valentine Valentine Valentine Valentine Valentine Valentine El Paso Valentine WorthamMexia Trout Switch
2900
Limestone Lamar
19 June 20 June 20 June 20 June 8 Aug.
1936 1936 1936 1936 1936
21 03:13:37 03:18:27 03:24:06 01:40
35.2 35.7 35.7 35.7 31.8
100.7 101.4 101.4 101.4 106.5
Davis et al. (1989) Docekal (1970) Docekal (1970) Docekal (1970) Docekal (1970)
3.0 3.9 3.9 5.0 3.0
mN mN mN mN mN
III III III-IV VI III
Felt area (km2) — — 21,000 110,000 —
15 Oct. 31 Mar. 12 Mar. 20 Mar. 20 June 17 Oct. 27 Jan. 19 Mar. 19 Mar. 19 Mar. 19 Mar.
1936 1937 1948 1950 1951 1952 1955 1957 1957 1957 1957
18 23:45 04:29 13:23 18:37:10 15:48 00:37 16:37:39 17:41:17 22:36 22:45
31.8 31.8 36.0 33.3 35.0 30.1 30.6 32.6 32.6 32.6 32.6
106.5 106.5 102.5 97.8 102.0 93.8 104.5 94.7 94.7 94.7 94.7
Docekal (1970) Docekal (1970) Reagor et al. (1982) Docekal (1970) Docekal (1970) Reagor et al. (1982) Docekal (1970) Docekal (1970) Docekal (1970) Docekal (1970) Docekal (1970)
3.0 3.0 5.2 3.3 4.2 3.3 3.3 4.7 3.0 3.0 3.0
mN mN mN mN mN mN mN mN mN mN mN
III III VI IV V IV IV V III III III
— — 240,000 — 74,000 — — 45,000 3,000 3,000 3,000
T T T ?? PsI PsI T PrI PrI PrI PrI
6 Mar.
1962
09:59:10
31.2
104.8
Frohlich & Davis (2002)
3.5
ML
—
—
T
24 Apr. 24 Apr. 24 Apr. 27 Apr. 28 Apr. 30 Apr. 7 May 2 June 3 June 3 June 3 June 8 Nov. 21 Nov. 3 Feb. 30 Aug. 20 July 14 Aug.
1964 1964 1964 1964 1964 1964 1964 1964 1964 1964 1964 1964 1964 1965 1965 1966 1966
01:20:55 07:33:53 12:07:07 21:50:27 21:18:35 20:30:00 07:33:53 23:00:00 00:00:00 02:27:24 09:37:00 09:25:59 11:21:22 19:59:32 05:17:30 09:04:58 15:25:47
31.5 31.6 31.3 31.3 31.3 31.5 31.2 31.3 31.3 31.5 31.0 31.9 31.9 31.9 31.9 35.7 31.9
93.9 93.9 93.8 93.8 93.8 93.8 94.0 94.0 94.0 93.9 94.0 103.1 103.1 103.1 103.0 101.2 103.0
Davis et al. (1989) Davis et al. (1989) Davis et al. (1989) Davis et al. (1989) Davis et al. (1989) Davis et al. (1989) Davis et al. (1989) Davis et al. (1989) Davis et al. (1989) Davis et al. (1989) Davis et al. (1989) Sanford et al. (1978) Sanford et al. (1978) Sanford et al. (1978) Sanford et al. (1978) von Hake & Cloud (1968) Sanford et al. (1978)
3.7 3.7 3.2 3.2 4.4 3.0 3.2 4.2 4.2 3.1 3.6 3.0 3.1 3.3 3.5 4.1 3.4
mb mb mb mb mb mb mb mb mb mb mb Mcorr Mcorr Mcorr mb mN mb
V IV IV IV VI III V V V III IV — — — — V VI
— — — — 2,700 — — — — — — — — — — 36,000 50,000
T T T T T T T T T T T PrI PrI PrI PrI PsI PrI
Date and origin time
Lat °N
Lon °W
Agency
Imax
Mag
277
Type/Location
County
PsI PsI PsI PsI T
Clarendon Borger Borger Borger El Paso
Gray Hutchison Hutchison Hutchison El Paso
El Paso El Paso Dalhart Chico Amarillo Orange Valentine Gladewater Gladewater Gladewater Gladewater Van Horn area Hemphill Hemphill Hemphill Hemphill Hemphill Hemphill Hemphill Hemphill Hemphill Hamphill Hemphill Kermit Kermit Kermit Kermit Borger Kermit
El Paso El Paso Hartley Wise Randall Orange Jeff Davis Gregg Gregg Gregg Gregg Culberson Sabine Sabine Sabine Sabine Sabine Sabine Sabine Sabine Sabine Sabine Jasper Winkler Winkler Winkler Winkler Hutchison Winkler
12 May 12 May 30 July 31 July 24 Sept. 9 Dec. 10 Dec. 25 Dec. 15 Feb. 20 Apr. 24 June 1 Aug.
1969 1969 1971 1971 1971 1972 1972 1973 1974 1974 1974 1974
08:26:19 08:49:16 01:45:51 14:53:49 01:01:54 05:58:44 14:37:50 02:46:10 13:33:50 23:46:10 18:03:10 13:33:10
31.8 31.8 31.72 31.70 31.6 31.75 31.75 28.82 36.39 29. 29. 29.
106.4 106.4 103.00 103.06 103.2 106.40 106.40 98.20 100.52 98. 98. 98.
von Hake & Cloud (1971) von Hake & Cloud (1971) Reagor et al. (1982) Reagor et al. (1982) Reagor et al. (1982) Davis et al. (1989) Davis et al. (1989) Davis et al. (1989) ISC Frohlich & Davis (2002) Frohlich & Davis (2002) Frohlich & Davis (2002)
3.9 3.6 3.0 3.4 3.2 3.0 3.0 3.2 4.5 3.0 3.4 3.0
ML ML mb mb Mcorr ML ML MC mb MC MC MC
VI VI — — — IV III IV V — — —
Felt area (km2) — — — — — 1,500 100 — 110,000 — — —
30 Dec.
1974
08:05:27
30.9
103.1
Frohlich & Davis (2002)
3.7
ML
—
—
T
1 Aug.
1975
07:27:57
31.4
104.0
Coffman & Stover (1977)
4.8
mb
II
—
T
19 Jan. 25 Jan. 5 Aug. 17 Sept. 26 Apr. 7 June 22 July 28 Nov. 2 Mar. 16 June 16 June 9 June 9 June 6 Nov.
1976 1976 1976 1976 1977 1977 1977 1977 1978 1978 1978 1980 1981 1981
04:03:30 04:48:28 18:53:09 03:56:29 09:03:07 23:01:20 04:01:10 01:40:52 10:04:53 11:46:54 11:53:33 22:37:10 01:46:33 12:36:41
31.90 31.90 31.6 31.4 31.9 33.0 31.8 33.35 31.55 33.01 33.0 35.50 31.76 31.95
103.09 103.09 103.0 102.5 103.1 100.7 102.7 100.72 102.56 100.72 100.8 101.05 94.28 95.92
Gordon (1983) Gordon (1983) Frohlich & Davis (2002) Frohlich & Davis (2002) Keller et al. (1981) Frohlich & Davis (2002) Frohlich & Davis (2002) ISC Gordon (1983) ISC ISC ISC Davis et al. (1989) Davis et al. (1989)
3.5 3.9 3.0 3.1 3.3 3.1 3.0 3.5 3.5 4.6 3.4 4.3 3.2 3.3
ML ML ML
IV V — — IV — —
— 2,000 — — — — —
mN mbLg mbLg
III V — V III V
— 100,000 — 35,000 — 800
PrI PrI PrI PrI PrI ACI PrI ACI PrI ACI PrI PsI PsI PrI
4 Jan.
1982
16:56:10
31.18
102.35
ISC
3.9
mbLg
III
2,500
PrI
28 Mar. 19 Sept.
1982 1982
23:24:33 06:15:42
29. 32.03
98. 100.68
Frohlich & Davis (2002) ISC
3.0 3.0
MC mbLg
—
—
PsI PsI
Date and origin time
Lat °N
Lon °W
Agency
Imax
Mag
278
Mcorr ML MC Mcorr ML mbLg mbLg
Type/Location T T PrI PrI PrI T T ACI PsI PsI PsI PsI
El Paso El Paso Kermit Kermit Kermit El Paso El Paso Fashing Perryton South Texas South Texas South Texas Fort Stockton Delaware Basin Kermit Kermit Kermit Kermit Kermit Snyder Kermit Spur Kermit Snyder Snyder Pampa Center Jacksonville Fort Stockton South Texas Silver
County El Paso El Paso Winkler Winkler Ward El Paso El Paso Atascosa Ochiltree Wilson Wilson Wilson Pecos Reeves Winkler Winkler Ward Crane Winkler Scurry Ector Kent Crane Scurry Scurry Gray Shelby Anderson Pecos Wilson Coke
14 Oct. 7 Nov. 28 Nov. 3 Apr. 23 July 3 Mar. 3 Mar. 8 Mar. 3 Apr. 21 May 8 Aug. 11 Sept. 19 Sept. 18 Sept. 30 Jan. 3 Mar. 20 July
1982 1982 1982 1983 1983 1984 1984 1984 1984 1984 1984 1984 1984 1985 1986 1986 1991
12:52:46 00:04:19 02:36:48 04:55:22 15:24:39 01:03:26 01:58:25 01:31:28 04:55:24 13:30:14 01:31:27 14:47:33 06:15:42 15:54:05 22:26:37 11:45:17 23:38:17
36.05 35.2 32.92 35.40 28.82 28.87 28.87 28.87 35.32 35.4 28.87 31.96 32.03 33.55 32.02 35.31 29.0
102.53 100.2 100.85 102.41 98.18 98.50 98.50 98.50 102.4 102.4 98.50 100.66 100.68 97.02 100.70 102.52 98.0
ISC ISC ISC ISC Davis et al. (1989) Davis et al. (1989) Davis et al. (1989) Davis et al. (1989) Frohlich & Davis (2002) Frohlich & Davis (2002) Davis et al. (1989) Frohlich & Davis (2002) Frohlich & Davis (2002) ISC ISC Frohlich & Davis (2002) Olson & Frohlich (1991)
3.9 3.1 3.3 3.4 3.4 3.9 3.2 3.1 3.4 3.1 3.1 3.0 3.2 3.3 3.3 3.1 3.6
mbLg mbLg mbLg mbLg mbLg mbLg MC mbLg mbLg mbLg mbLg mbLg mbLg mbLg mbLg mbLg mbLg
III — IV
Felt area (km2) 8,200 — 32,000
V V IV IV — — IV — — V IV — IV
200 1,300 100 100 — — — — — 700 — — 110
T PsI ACI PsI ACI ACI ACI ACI PsI PsI ACI PsI PsI PsI PsI T PrI
2 Jan.
1992
11:45:36
32.36
102.97
ISC
4.6
mb
V
440,000
PsI
26 Aug. 9 Apr. 16 May 29 Sept 30 Nov 14 Apr. 14 Apr. 15 Apr. 15 Apr. 1 June 12 Nov.
1992 1993 1993 1993 1993 1995 1995 1995 1995 1995 1995
03:24:53 12:29:19 15:30:19 02:01 03:07 00:32:56 02:19:38 10:33:43 14:33:30 01:06:16 17:45:59
32.18 28.87 28.9 35.9 35.86 30.29 30.5 30.22 30.26 30.28 30.2
102.71 98.50 98.5 103.03 103.03 103.32 103.1 103.24 103.33 103.35 103.2
ISC Frohlich & Davis (2002) Frohlich & Davis (2002) ISC NEIC ISC ISC ISC ISC Frohlich & Davis (2002) Frohlich & Davis (2002)
3.0 4.3 3.0 3.3 3.3 5.7 3.3 3.6 4.0 3.5 3.6
mbLg mbLg mbLg mbLg mbLg MW mbLg mbLg mbLg mbLg mbLg
25 Mar.
1996
06:43:47
35.61
102.60
ISC
3.5
23 Nov.
1996
10:54:18
35.11
100.60
Frohlich & Davis (2002)
3.0
Date and origin time
Lat °N
Lon °W
Agency
Imax
Mag
279
Type/Location
VI IV
5,000 300
VI felt
760,000 —
VI IV felt
52,000 36,000 —
PsI ACI ACI T T T T T T T T
mbLg
—
—
PsI
mbLg
possibly felt
—
PsI
Dalhart Wheeler Co. Snyder Oldham Fashing Pleasanton Pleasanton Pleasanton Oldham Co. Oldham Co. Pleasanton Coke County Coke County Valley View Silver Oldham Co. Falls City Rattlesnake Canyon Andrews Fashing Fashing Dalhart Dalhart Alpine Alpine Alpine Alpine Alpine Alpine near Channing near McLean
County Hartley Wheeler Scurry Oldham Atascosa Atascosa Atascosa Atascosa Oldham Oldham Atascosa Coke Coke Cooke Coke Oldham Karnes Andrews Andrews Atascosa Atascosa Hartley Hartley Brewster Pecos Brewseter Brewster Brewster Brewster Huntley Donley
Date and origin time
Lat °N
Lon °W
Agency
Imax
Mag
Felt area (km2) 110 110 950 1,100 3,900
Type/Location
12 Feb. 15 Feb. 24 Mar. 31 May 15 Apr. 27 Apr. 7 Aug. 7 Aug. 7 Aug. 10 Aug. 17 Aug. 16 Dec. 22 Nov. 24 Sept. 3 Apr.
1997 1997 1997 1997 1998 1998 2000 2000 2000 2000 2000 2000 2001 2003 2005
23:53:11 09:08:55 22:31:34 03:26:41 10:33:42 15:22:46 17:19:06 18:34:09 21:36:21 13:59:50 01:08:05 22:08:53 00:07:08 15:02:09 14:39:17
35.11 35.11 27.72 33.22 30.23 35.42 35.36 35.39 35.29 35.39 35.36 35.23 31.79 35.30 28.39
100.60 100.60 97.95 96.00 103.24 102.27 101.84 101.81 101.90 101.81 101.70 101.78 102.63 101.74 100.31
Frohlich & Davis (2002) Frohlich & Davis (2002) Frohlich et al. (2012) ISC ISC ISC ISC NEIC ISC NEIC ISC ISC NEIC NEIC NEIC
3.0 3.2 3.8 3.4 3.6 3.2 3.3 3.0 3.0 3.0 3.9 3.9 3.1 3.3 3.5
mbLg mbLg mbLg mbLg mbLg mbLg mbLg mbLg mbLg mbLg mbLg mbLg mbLg mbLg mbLg
IV V V-VI IV III
IV IV
PsI PsI ACI T T T PsI PsI PsI PsI PsI PsI PsI PsI T
18 Feb.
2006
05:49:41
35.67
101.79
NEIC
3.5
ml
III
PsI
28 Mar. 27 Sept. 7 Oct. 29 Jan. 7 Apr. 12 Oct. 14 Oct.
2006 2007 2007 2008 2008 2008 2008
23:55:11 15:21:02 13:54:22 10:24:53 09:51:13 12:08:16 03:07:28
35.36 35.47 34.51 32.90 28.93 35.62 35.77
101.87 100.11 100.15 100.84 98.00 100.32 100.75
NEIC NEIC NEIC NEIC ISC NEIC ISC
3.0 3.0 3.1 3.3 3.9 3.0 3.7
ml mbLg mbLg mbLg MW mbLg MW
IV
PsI PsI T PrI PrI PsI PsI
31 Oct.
2008
05:01:55
32.84
97.03
NEIC
3.0
mbLg
IV
ACI
16 May
2009
16:24:05
32.82
97.09
ISC
3.3
mbLg
IV
ACI
16 May
2009
16:58:38
32.85
97.10
NEIC
3.0
mbLg
ACI
27 Jan. 4 Feb. 8 Mar. 25 Apr.
2010 2010 2010 2010
04:59:33 09:41:28 23:47:28 02:10:42
32.87 35.49 28.94 27.72
100.90 102.62 98.03 97.95
Gan & Frohlich (2013) NEIC NEIC Frohlich et al. (2012)
3.1 3.3 3.0 3.9
mbLg MW
PrI PsI PrI ACI
280
mbLg
III III III III V IV
5,000
III
V III 950
near McLean near McLean Alice Commerce Alpine Oldham Amarillo Amarillo Amarillo Amarillo Amarillo Amarillo Odessa Amarillo Eagle Pass Lake Meredith Amarillo Wheeler Childress Snyder Falls City Briscoe Miami Dallas-Fort Worth Dallas-Fort Worth Dallas-Fort Worth Snyder Borger Falls City? Alice
County Donley Donley Jim Wells Hunt Brewster Oldham Potter Potter Potter Potter Potter Potter Ector Potter Maverick Moore Potter Wheeler Childress Scurry Karnes Wheeler Roberts Tarrant Tarrant Tarrant Scurry Oldham Karnes Jim Wells
Date and origin time 8 Aug. 9 Oct. 26 Oct. 21 Dec. 17 Feb. 1 Mar. 12 Mar. 13 Mar. 14 Mar. 19 Mar. 28 Mar. 2 Apr. 2 May 17 Jul. 11 Sept. 12 Sept. 20 Oct. 12 Nov. 24 Nov. 9 Dec. 17 Dec. 18 Jan 24 Jan. 4 Feb. 10 May 17 May 15 Jun. 24 Jun. 24 Jun. 12 Aug. 30 Sept. 30 Sept. 7 Nov.
2010 2010 2010 2010 2011 2011 2011 2011 2011 2011 2011 2011 2011 2011 2011 2011 2011 2011 2011 2011 2011 2012 2012 2012 2012 2012 2012 2012 2012 2012 2012 2012 2012
01:12:38 07:42:28 06:56:29 13:53:18 18:25:34 03:30:13 15:22:00 20:16:21 00:19:49 23:24:01 09:12:12 22:05:14 19:07:15 06:58:01 12:27:44 14:18:34 12:24:42 10:34:54 23:15:49 18:47:32 14:46:58 22:30:54 18:21:03 12:48:09 15:15:39 08:12:01 07:02:32 08:55:59 17:46:43 00:36:04 04:04:59 04:09:03 17:38:00
Lat °N
Lon °W
Agency
32.90 32.95 32.93 28.64 30.11 32.88 32.88 32.97 32.96 32.98 32.91 33.06 33.04 32.49 32.88 32.80 28.85 28.88 32.94 32.94 32.81 32.36 30.32 28.82 31.88 31.89 32.48 28.40 32.49 35.42 32.87 32.83 27.25
100.85 100.90 100.90 98.04 103.30 100.84 100.90 100.84 100.81 100.77 100.82 100.76 100.79 97.17 100.83 100.83 98.15 98.23 100.85 100.88 100.85 97.49 103.38 98.17 94.40 94.41 97.25 98.41 97.26 101.85 97.00 96.96 98.82
NEIC Gan & Frohlich (2013) Gan & Frohlich (2013) NEIC NEIC NEIC NEIC ISC NEIC NEIC NEIC NEIC ISC Frohlich (2012) ISC ISC ISC ISC NEIC ISC NEIC ISC NEIC ISC Frohlich et al. (2014) Frohlich et al. (2014) ISC ISC ISC ISC ISC NEIC ISC
Mag 3.4 3.1 3.1 3.2 3.3 3.1 3.0 3.8 3.0 3.0 3.0 3.0 3.2 3.0 4.3 3.4 4.8 3.5 3.1 3.5 3.2 3.3 3.6 3.0 3.9 3.9 3.3 3.4 3.5 3.3 3.4 3.1 3.4
281
MW mbLg mbLg
Imax
Felt area (km2)
III
mbLg mbLg mbLg MW mbLg mbLg mbLg mbLg mbLg mbLg MW mbLg MW
IV IV III VI
mbLg mbLg mbLg mbLg mbLg
III III IV IV
MW MW mbLg
V VII IV
mbLg mbLg mbLg mbLg mb
IV
II III
IV
11,000
20,000
Type/Location PrI PrI PrI ACI T PrI PrI PrI PrI PrI PrI PrI PrI PrI PrI PrI ACI ACI PrI PrI PrI ACI T ACI ACI ACI ACI ACI ACI PsI PrI PrI PsI
Snyder Snyder Snyder Fashing Marathon Snyder Snyder Snyder Snyder Snyder Snyder Snyder Snyder Venus Snyder Snyder Fashing Fashing Snyder Snyder Snyder Cleburne Alpine Fashing Timpson Timpson Cleburne Pleasanton Cleburne Amarillo Irving Irving Hebronville
County Scurry Scurry Scurry Bee Brewster Scurry Scurry Kent Kent Kent Scurry Kent Kent Johnson Scurry Scurry Atascosa Atascosa Scurry Scurry Scurry Johnson Brewster Atascosa Shelby Shelby Johnson McMullen Johnson Potter Dallas Dallas Jim Hogg
Date and origin time
Lat °N
Lon °W
Agency
Mag
Imax
Felt area (km2)
Type/Location
23 Jan. 25 Jan. 6 May 14 May 2 Sept. 2 Sept. 9 Nov. 12 Nov. 20 Nov. 25 Nov. 26 Nov.
2013 2013 2013 2013 2013 2013 2013 2013 2013 2013 2013
04:16:19 07:01:20 23:11:59 00:05:40 21:52:37 23:51:15 19:54:31 17:36:03 00:40:35 07:43:03 14:24:03
32.89 31.87 32.97 31.14 31.85 31.96 32.93 31.11 33.09 32.90 32.89
97.00 94.44 100.84 104.78 94.30 94.50 97.69 105.38 97.68 97.63 97.53
NEIC Frohlich et al. (2014) NEIC NEIC IDC IDC NEIC NEIC IDC NEIC NEIC
3.0 3.9 3.0 3.1 4.2 4.3 3.0 3.1 3.6 3.3 3.0
mbLg MW mbLg MW MW mbLg mbLg mbLg mbLg
IV III
28 Nov.
2013
07:58:34
32.94
97.97
NEIC
3.6
mbLg
IV
ACI
29 Nov. 8 Dec.
2013 2013
06:14:10 06:10:01
32.90 33.01
97.63 97.34
NEIC IDC
3.1 3.6
mbLg mbLg
III IV
ACI ACI
9 Dec.
2013
09:23:14
32.98
98.03
IDC
3.7
mbLg
IV
ACI
22 Dec. 23 Dec. 6 Jan. 13 Jan. 28 Jan 14 May 10 Sept. 14 Sept. 3 Oct. 23 Nov. 30 Nov. 3 Dec. 31 Dec. 6 Jan. 6 Jan. 7 Jan. 7 Jan.
2013 2013 2014 2014 2014 2014 2014 2014 2014 2014 2014 2014 2014 2015 2015 2015 2015
17:31:55 13:11:34 08:41:20 17:40:21 17:43:44 15:52:17 17:53:24 09:19:00 04:52:33 03:15:47 05:52:24 13:33:39 18:31:40 21:10:31 21:55:19 00:52:09 06:59:03
32.92 32.93 35.21 32.94 32.95 32.78 28.84 32.91 31.72 32.84 32.53 36.50 32.93 32.84 32.92 32.88 32.84
97.58 97.59 102.91 97.57 97.53 100.88 98.67 100.82 94.03 96.89 97.19 100.11 100.85 96.90 100.85 96.91 96.91
NEIC NEIC IDC NEIC NEIC NEIC NEIC NEIC NEIC NEIC IDC IDC NEIC NEIC NEIC IDC NEIC
3.3 3.3 3.5 3.1 3.0 3.1 3.2 3.2 3.1 3.3 3.4 4.0 3.2 3.5 3.5 3.6 3.1
mbLg mbLg
III IV IV III
ACI ACI T ACI PrI PrI ACI PrI PsI PrI PrI PsI PrI PrI PrI PrI PrI
282
mbLg mbLg mbLg mbLg mbLg mbLg mbLg mbLg mbLg mbLg mbLg mbLg mbLg
III V
III
V V
IV IV V
PrI ACI PrI T ACI ACI ACI T ACI ACI ACI
Irving Timpson Snyder Van Horn Timpson Timpson Azle Hudspeth Azle Reno Reno Mineral Wells Azle Azle Mineral Wells Reno Reno Boise Reno Snyder Snyder Jourdanton Snyder Center Irving Mansfield Follett Snyder Irving Snyder Irving Irving
County Dallas Shelby Kent Culberson Shelby Shelby Parker Hudspeth Wise Parker Parker Parker Denton Parker Parker Parker Parker Oldham Parker Scurry Scurry Atascosa Scurry Shelby Dallas Johnson Lipscomb Scurry Dallas Scurry Dallas Dallas
Date and origin time
Lat °N
Lon °W
Agency
Mag
Imax
Felt area (km2)
Type/Location
20 Jan. 31 Jan. 2 Feb. 19 Feb. 27 Feb. 2 Apr. 4 Apr. 17 Apr. 3 May 7 May 17 May 18 May 4 Aug.
2015 2015 2015 2015 2015 2015 2015 2015 2015 2015 2015 2015 2015
20:25:49 02:17:02 00:39:27 20:31:20 12:18:21 22:36:21 00:16:33 22:15:14 15:11:16 22:58:05 22:15:13 18:14:29 15:06:32
32.84 28.86 35.23 29.45 32.83 32.85 31.16 31.03 32.85 32.48 31.05 32.87 31.17
96.90 98.13 101.75 96.91 96.89 96.94 103.25 103.19 96.95 97.10 103.19 96.96 103.28
NEIC NEIC IDC NEIC NEIC NEIC NEIC NEIC NEIC NEIC NEIC NEIC NEIC
3.0 3.1 3.1 3.1 3.1 3.3 3.3 3.1 3.2 4.0 3.1 3.3 3.3
mbLg mbLg mbLg mbLg mbLg mbLg mbLg
12 Aug.
2015
20:49:22
31.05
103.16
NEIC
3.0
mbLg
PsI
7 Nov. 10 Nov. 14 Dec. 17 Dec.
2015 2015 2015 2015
05:18:20 21:43:04 12:35:03 22:29:56
31.32 31.32 29.23 32.96
103.09 103.05 97.51 97.35
NEIC NEIC NEIC NEIC
3.0 3.2 3.0 3.0
mbLg mbLg mbLg mbLg
PsI PsI PsI PsI
283
mbLg MW mbLg mbLg mbLg
V IV IV V
V IV V
IV V
PrI ACI T PsI PrI PrI PsI PsI PrI PrI PsI PrI PsI
Irving Fashing Amarillo Hallettsville Irving Irving Pecos Pecos Irving Venus Pecos Irving Pecos Fort Stockton Monahans Monahans Nixon Haslet
County Dallas Atascosa Potter Lavaca Dallas Dallas Pecos Pecos Dallas Johnson Pecos Dallas Pecos Pecos Ward Ward Wilson Tarrant
Table A.2: Catalog of Texas earthquakes, scored to assess whether event may be induced
Date 14 Feb. 1 May 5 Jan. 31 Jan. 31 May 8 Jan. 9 Oct. Apr. 8 May 30 Dec. 28 Mar. 7 Mar.
Year 1847 1873 1887 1887 1889 1891 1902 1907 1910 1914 1917 1923
Time 02 04:30 17:57 22:14 20 06 19
QT 0.0 0.0 0.0 0.0 0.0 0.0 0.0
QS 0.0 0.0 0.0 0.0 0.0 0.0 0.0
QD 0.0 0.0 0.0 0.0 0.0 0.0 0.0
QF 0.0 0.0 0.0 0.0 0.0 0.0 0.0
QP 0.0 0.0 0.0 0.0 0.0 0.0 0.0
Sum 0.0 0.0 0.0 0.0 0.0 0.0 0.0
17:30 01:00 1956 05:03
0.0 0.0 0.0 0.0
0.0 0.0 0.0 0.0
0.0 0.0 0.0 0.0
0.0 0.0 0.0 0.0
0.0 0.0 0.0 0.0
0.0 0.0 0.0 0.0
Type T T T T T T T ?? T T T T
1.0
1.0
0.0
0.5
1.0
3.5
PrI
1.0 1.0 0.0 0.0 0.0 0.0 0.0 0.0 0.0 0.0 0.0 0.0 0.0 0.0 0.0
0.5 0.5 0.0 0.0 0.0 0.0 0.0 0.0 0.0 0.0 0.0 0.0 0.0 0.0 0.0
0.0 0.0 0.0 0.0 0.0 0.0 0.0 0.0 0.0 0.0 0.0 0.0 0.0 0.0 0.0
0.0 0.0 0.0 0.0 0.0 0.0 0.0 0.0 0.0 0.0 0.0 0.0 0.0 0.0 0.0
0.0 0.0 0.0 0.0 0.0 0.0 0.0 0.0 0.0 0.0 0.0 0.0 0.0 0.0 0.0
1.5 1.5 0.0 0.0 0.0 0.0 0.0 0.0 0.0 0.0 0.0 0.0 0.0 0.0 0.0
?? PsI PsI T T T T T T T T T T T T T
1925 29 July 30 July 31 July 16 Aug. 16 Aug. 16 Aug. 16 Aug. 16 Aug. 16 Aug. 16 Aug. 18 Aug. 18 Aug. 18 Aug. 26 Aug. 2 Oct. 3 Nov.
1925 1925 1925 1931 1931 1931 1931 1931 1931 1931 1931 1931 1931 1931 1931 1931
11:30 12:17 18 08 11:15 11:40:22 12:17 12:45 13:35 19:33 08:42 19:36 22 — — 15:50
284
Ref
Pratt & Johnson (1926)
Location Seguin Manor Paige Wellborn El Paso Rusk Creedmoor Amarillo Hempstead Anderson Panhandle El Paso
County Guadalupe Travis Bastrop Brazos El Paso Cherokee Travis Potter Waller Grimes Carson El Paso
Goose Creek
Harris
Silverton Panhandle White Deer Valentine Valentine Valentine Valentine Valentine Valentine Valentine Valentine Valentine Valentine Valentine El Paso Valentine
Briscoe Carson Carson Jeff Davis Jeff Davis Jeff Davis Jeff Davis Jeff Davis Jeff Davis Jeff Davis Jeff Davis Jeff Davis Jeff Davis Jeff Davis El Paso Jeff Davis
Date
Year
Time
QT
QS
QD
QF
QP
Sum
Type
9 Apr.
1932
10:17
1.0
1.0
0.5
1.0
1.0
4.5
ACI
12 Apr. 19 June 20 June 20 June 20 June 8 Aug. 15 Oct. 31 Mar. 12 Mar. 20 Mar. 20 June 17 Oct. 27 Jan.
1934 1936 1936 1936 1936 1936 1936 1937 1948 1950 1951 1952 1955
01:40 21 03:13:37 03:18:27 03:24:06 01:40 18 23:45 04:29 13:23 18:37:10 15:48 00:37
0.0 1.0 1.0 1.0 1.0 0.0 0.0 0.0 0.0
0.0 1.0 1.0 1.0 1.0 0.0 0.0 0.0 0.0
0.0 0.0 0.0 0.0 0.0 0.0 0.0 0.0 0.0
0.0 0.0 0.0 0.0 0.0 0.0 0.0 0.0 0.0
0.0 0.0 0.0 0.0 0.0 0.0 0.0 0.0 0.0
0.0 2.0 2.0 2.0 2.0 0.0 0.0 0.0 0.0
1.0 1.0 0.0
0.5 0.5 0.0
0.0 0.0 0.0
0.0 0.0 0.0
0.0 0.0 0.0
1.5 1.5 0.0
T PsI PsI PsI PsI T T T T ?? PsI PsI T
19 Mar.
1957
16:37:39
1.0
1.0
0.0
0.0
0.5
2.5
PrI
19 Mar.
1957
17:41:17
1.0
1.0
0.0
0.0
0.5
2.5
PrI
19 Mar.
1957
22:36
1.0
1.0
0.0
0.0
0.5
2.5
PrI
19 Mar.
1957
22:45
1.0
1.0
0.0
0.0
0.5
2.5
PrI
6 Mar. 24 Apr. 24 Apr. 24 Apr. 27 Apr. 28 Apr. 30 Apr. 7 May 2 June 3 June 3 June
1962 1964 1964 1964 1964 1964 1964 1964 1964 1964 1964
09:59:10 01:20:55 07:33:53 12:07:07 21:50:27 21:18:35 20:30:00 07:33:53 23:00:00 00:00:00 02:27:24
0.0 0.0 0.0 0.0 0.0 0.0 0.0 0.0 0.0 0.0 0.0
0.0 0.0 0.0 0.0 0.0 0.0 0.0 0.0 0.0 0.0 0.0
0.0 0.0 0.0 0.0 0.0 0.0 0.0 0.0 0.0 0.0 0.0
0.0 0.0 0.0 0.0 0.0 0.0 0.0 0.0 0.0 0.0 0.0
0.0 0.0 0.0 0.0 0.0 0.0 0.0 0.0 0.0 0.0 0.0
0.0 0.0 0.0 0.0 0.0 0.0 0.0 0.0 0.0 0.0 0.0
T T T T T T T T T T T
285
Ref Sellards (1933)
Frohlich & Davis (2002) Frohlich & Davis (2002) Frohlich & Davis (2002) Frohlich & Davis (2002)
Location WorthamMexia Trout Switch Clarendon Borger Borger Borger El Paso El Paso El Paso Dalhart Chico Amarillo Orange Valentine
County Limestone Lamar Gray Hutchison Hutchison Hutchison El Paso El Paso El Paso Hartley Wise Randall Orange Jeff Davis
Gladewater
Gregg
Gladewater
Gregg
Gladewater
Gregg
Gladewater
Gregg
Van Horn area Hemphill Hemphill Hemphill Hemphill Hemphill Hemphill Hemphill Hemphill Hemphill Hamphill
Culberson Sabine Sabine Sabine Sabine Sabine Sabine Sabine Sabine Sabine Sabine
Date 3 June
Year 1964
Time 09:37:00
QT 0.0
QS 0.0
QD 0.0
QF 0.0
QP 0.0
Sum 0.0
Type T
8 Nov.
1964
09:25:59
1.0
1.0
0.0
0.0
1.0
3.0
PrI
21 Nov.
1964
11:21:22
1.0
1.0
0.0
0.0
1.0
3.0
PrI
3 Feb.
1965
19:59:32
1.0
1.0
0.0
0.0
1.0
3.0
PrI
30 Aug.
1965
05:17:30
1.0
1.0
0.0
0.0
1.0
3.0
PrI
20 July
1966
09:04:58
1.0
1.0
0.0
0.0
0.0
2.0
PsI
14 Aug.
1966
15:25:47
1.0
1.0
0.0
0.0
1.0
3.0
PrI
12 May 12 May
1969 1969
08:26:19 08:49:16
0.0 0.0
0.0 0.0
0.0 0.0
0.0 0.0
0.0 0.0
0.0 0.0
T T
30 July
1971
01:45:51
1.0
1.0
0.0
0.0
1.0
3.0
PrI
31 July
1971
14:53:49
1.0
1.0
0.0
0.0
1.0
3.0
PrI
24 Sept.
1971
01:01:54
1.0
1.0
0.0
0.0
1.0
3.0
PrI
9 Dec. 10 Dec.
1972 1972
05:58:44 14:37:50
0.0 0.0
0.0 0.0
0.0 0.0
0.0 0.0
0.0 0.0
0.0 0.0
T T
25 Dec.
1973
02:46:10
1.0
1.0
0.5
0.5
1.0
4.0
ACI
15 Feb. 20 Apr. 24 June 1 Aug. 30 Dec. 1 Aug.
1974 1974 1974 1974 1974 1975
13:33:50 23:46:10 18:03:10 13:33:10 08:05:27 07:27:57
1.0 1.0 1.0 1.0 1.0 0.0
0.5 0.5 0.5 0.5 0.5 0.0
0.0 0.0 0.0 0.0 0.0 0.0
0.0 0.0 0.0 0.0 0.0 0.0
0.0 0.0 0.0 0.0 0.0 0.0
1.5 1.5 1.5 1.5 1.5 0.0
PsI PsI PsI PsI PsI T
19 Jan.
1976
04:03:30
1.0
1.0
0.0
0.0
1.0
3.0
PrI
25 Jan.
1976
04:48:28
1.0
1.0
0.0
0.0
1.0
3.0
PrI
286
Ref Doser et al. (1992) Doser et al. (1992) Doser et al. (1992) Doser et al. (1992) Doser et al. (1992)
Doser et al. (1992) Doser et al. (1992) Doser et al. (1992)
Pennington et al. (1986)
Doser et al. (1992) Doser et al. (1992)
Location Hemphill
County Jasper
Kermit
Winkler
Kermit
Winkler
Kermit
Winkler
Kermit
Winkler
Borger
Hutchison
Kermit
Winkler
El Paso El Paso
El Paso El Paso
Kermit
Winkler
Kermit
Winkler
Kermit
Ward
El Paso El Paso
El Paso El Paso
Fashing
Atascosa
Perryton South Texas South Texas South Texas Fort Stockton Delaware Basin
Ochiltree Wilson Wilson Wilson Pecos Reeves
Kermit
Winkler
Kermit
Winkler
Date
Year
Time
QT
QS
QD
QF
QP
Sum
Type
5 Aug.
1976
18:53:09
1.0
1.0
0.0
0.0
1.0
3.0
PrI
17 Sept.
1976
03:56:29
1.0
1.0
0.0
0.0
1.0
3.0
PrI
26 Apr.
1977
09:03:07
1.0
1.0
0.0
0.0
1.0
3.0
PrI
7 June
1977
23:01:20
1.0
1.0
0.5
0.5
1.0
4.0
ACI
22 July
1977
04:01:10
1.0
1.0
0.0
0.0
1.0
3.0
PrI
28 Nov.
1977
01:40:52
1.0
1.0
0.0
0.0
0.0
2.0
PrI
2 Mar.
1978
10:04:53
1.0
1.0
0.0
0.0
1.0
3.0
PrI
16 June
1978
11:46:54
1.0
1.0
0.5
0.5
1.0
4.0
ACI
16 June
1978
11:53:33
1.0
1.0
0.5
0.5
1.0
4.0
ACI
9 June
1980
22:37:10
1.0
1.0
0.0
0.0
0.0
2.0
PsI
9 June
1981
01:46:33
0.5
0.5
0.0
0.0
0.5
1.5
PsI
6 Nov.
1981
12:36:41
1.0
1.0
0.0
0.0
0.5
2.5
PrI
4 Jan.
1982
16:56:10
1.0
1.0
0.0
0.0
0.5
2.5
PrI
28 Mar. 19 Sept. 14 Oct. 7 Nov.
1982 1982 1982 1982
23:24:33 06:15:42 12:52:46 00:04:19
1.0 1.0 0.0 1.0
0.5 1.0 0.0 1.0
0.0 0.0 0.0 0.0
0.0 0.0 0.0 0.0
0.0 0.0 0.0 0.0
1.5 2.0 0.0 2.0
PsI PsI T PsI
287
Ref Doser et al. (1992) Doser et al. (1992) Doser et al. (1992) Davis & Pennington (1989) Doser et al. (1992) Davis & Pennington (1989) Doser et al. (1992) Davis & Pennington (1989) Davis & Pennington (1989) Pennington & Carlson (1984) Frohlich & Davis (2002) Doser et al. (1992)
Location
County
Kermit
Ward
Kermit
Crane
Kermit
Winkler
Snyder
Scurry
Kermit
Ector
Spur
Kent
Kermit
Crane
Snyder
Scurry
Snyder
Scurry
Pampa
Gray
Center
Shelby
Jacksonville
Anderson
Fort Stockton
Pecos
South Texas Silver Dalhart Wheeler Co.
Wilson Coke Hartley Wheeler
Date
Year
Time
QT
QS
QD
QF
QP
Sum
Type
28 Nov.
1982
02:36:48
1.0
1.0
0.5
0.5
1.0
4.0
ACI
3 Apr.
1983
04:55:22
1.0
1.0
0.0
0.0
0.0
2.0
PsI
23 July
1983
15:24:39
1.0
1.0
0.5
0.5
1.0
4.0
ACI
3 Mar.
1984
01:03:26
1.0
1.0
0.5
0.5
1.0
4.0
ACI
3 Mar.
1984
01:58:25
1.0
1.0
0.5
0.5
1.0
4.0
ACI
8 Mar.
1984
01:31:28
1.0
1.0
0.5
0.5
1.0
4.0
ACI
3 Apr. 21 May
1984 1984
04:55:24 13:30:14
1.0 1.0
0.5 0.5
0.0 0.0
0.0 0.0
0.0 0.0
1.5 1.5
PsI PsI
8 Aug.
1984
01:31:27
1.0
1.0
0.5
0.5
1.0
4.0
ACI
11 Sept. 19 Sept. 18 Sept. 30 Jan. 3 Mar.
1984 1984 1985 1986 1986
14:47:33 06:15:42 15:54:05 22:26:37 11:45:17
1.0 1.0 1.0 1.0 0.0
1.0 1.0 1.0 1.0 0.0
0.0 0.0 0.0 0.0 0.0
0.0 0.0 0.0 0.0 0.0
0.0 0.0 0.0 0.0 0.0
2.0 2.0 2.0 2.0 0.0
PsI PsI PsI PsI T
20 July
1991
23:38:17
1.0
1.0
0.0
0.5
1.0
3.5
PrI
2 Jan.
1992
11:45:36
1.0
1.0
0.0
0.0
0.0
2.0
PsI
26 Aug.
1992
03:24:53
1.0
1.0
0.0
0.0
0.0
2.0
PsI
9 Apr.
1993
12:29:19
1.0
1.0
0.5
0.5
1.0
4.0
ACI
16 May
1993
15:30:19
1.0
1.0
0.5
0.5
1.0
4.0
ACI
29 Sept 30 Nov 14 Apr. 14 Apr.
1993 1993 1995 1995
02:01 03:07 00:32:56 02:19:38
0.0 0.0 0.0 0.0
0.0 0.0 0.0 0.0
0.0 0.0 0.0 0.0
0.0 0.0 0.0 0.0
0.0 0.0 0.0 0.0
0.0 0.0 0.0 0.0
T T T T
288
Ref Davis & Pennington (1989) Pennington et al. (1986) Pennington et al. (1986) Pennington et al. (1986) Pennington et al. (1986)
Pennington et al. (1986)
Frohlich & Brunt (2013)
Location
County
Snyder
Scurry
Oldham
Oldham
Fashing
Atascosa
Pleasanton
Atascosa
Pleasanton
Atascosa
Pleasanton
Atascosa
Oldham Co. Oldham Co.
Oldham Oldham
Pleasanton
Atascosa
Coke County Coke County Valley View Silver Oldham Co.
Coke Coke Cooke Coke Oldham
Falls City
Karnes
Rattlesnake Canyon Andrews Pennington et al. (1986) Pennington et al. (1986)
Andrews Andrews
Fashing
Atascosa
Fashing
Atascosa
Dalhart Dalhart Alpine Alpine
Hartley Hartley Brewster Pecos
Date 15 Apr. 15 Apr. 1 June 12 Nov. 25 Mar. 23 Nov. 12 Feb. 15 Feb.
Year 1995 1995 1995 1995 1996 1996 1997 1997
Time 10:33:43 14:33:30 01:06:16 17:45:59 06:43:47 10:54:18 23:53:11 09:08:55
QT 0.0 0.0 0.0 0.0 1.0 1.0 1.0 1.0
QS 0.0 0.0 0.0 0.0 0.5 0.5 0.5 0.5
QD 0.0 0.0 0.0 0.0 0.0 0.0 0.0 0.0
QF 0.0 0.0 0.0 0.0 0.0 0.0 0.0 0.0
QP 0.0 0.0 0.0 0.0 0.0 0.0 0.0 0.0
Sum 0.0 0.0 0.0 0.0 1.5 1.5 1.5 1.5
Type T T T T PsI PsI PsI PsI
24 Mar.
1997
22:31:34
1.0
1.0
1.0
1.0
1.0
5.0
ACI
31 May 15 Apr. 27 Apr. 7 Aug. 7 Aug. 7 Aug. 10 Aug. 17 Aug. 16 Dec. 22 Nov. 24 Sept. 3 Apr. 18 Feb. 28 Mar. 27 Sept. 7 Oct.
1997 1998 1998 2000 2000 2000 2000 2000 2000 2001 2003 2005 2006 2006 2007 2007
03:26:41 10:33:42 15:22:46 17:19:06 18:34:09 21:36:21 13:59:50 01:08:05 22:08:53 00:07:08 15:02:09 14:39:17 05:49:41 23:55:11 15:21:02 13:54:22
0.0 0.0 1.0 1.0 1.0 1.0 1.0 1.0 1.0 1.0 1.0 0.0 1.0 1.0 1.0 0.0
0.0 0.0 1.0 0.5 0.5 0.5 0.5 0.5 0.5 1.0 0.0 0.0 1.0 1.0 1.0 0.0
0.0 0.0 0.0 0.0 0.0 0.0 0.0 0.0 0.0 0.0 0.0 0.0 0.0 0.0 0.0 0.0
0.0 0.0 0.0 0.0 0.0 0.0 0.0 0.0 0.0 0.0 0.0 0.0 0.0 0.0 0.0 0.0
0.0 0.0 0.0 0.0 0.0 0.0 0.0 0.0 0.0 0.0 0.0 0.0 0.0 0.0 0.0 0.0
0.0 0.0 2.0 1.5 1.5 1.5 1.5 1.5 1.5 2.0 1.0 0.0 2.0 2.0 2.0 0.0
T T PsI PsI PsI PsI PsI PsI PsI PsI PsI T PsI PsI PsI T
29 Jan.
2008
10:24:53
1.0
1.0
0.0
0.5
1.0
3.5
PrI
7 Apr.
2008
09:51:13
1.0
1.0
0.0
0.5
1.0
3.5
PrI
12 Oct. 14 Oct.
2008 2008
12:08:16 03:07:28
1.0 1.0
1.0 1.0
0.0 0.0
0.0 0.0
0.0 0.0
2.0 2.0
PsI PsI
289
Ref
Frohlich et al. (2012)
Gan & Frohlich (2013) Frohlich & Brunt (2013)
Location Alpine Alpine Alpine Alpine near Channing near McLean near McLean near McLean
County Brewseter Brewster Brewster Brewster Huntley Donley Donley Donley
Alice
Jim Wells
Commerce Alpine Oldham Amarillo Amarillo Amarillo Amarillo Amarillo Amarillo Odessa Amarillo Eagle Pass Lake Meredith Amarillo Wheeler Childress
Hunt Brewster Oldham Potter Potter Potter Potter Potter Potter Ector Potter Maverick Moore Potter Wheeler Childress
Snyder
Scurry
Falls City
Karnes
Briscoe Miami
Wheeler Roberts
Date
Year
Time
QT
QS
QD
QF
QP
Sum
Type
31 Oct.
2008
05:01:55
1.0
1.0
1.0
1.0
1.0
5.0
ACI
16 May
2009
16:24:05
1.0
1.0
1.0
1.0
1.0
5.0
ACI
16 May
2009
16:58:38
1.0
1.0
1.0
1.0
1.0
5.0
ACI
27 Jan.
2010
04:59:33
1.0
1.0
0.0
0.5
1.0
3.5
PrI
4 Feb.
2010
09:41:28
1.0
1.0
0.0
0.0
0.0
2.0
PsI
8 Mar.
2010
23:47:28
1.0
1.0
0.0
0.5
1.0
3.5
PrI
25 Apr.
2010
02:10:42
1.0
1.0
1.0
1.0
1.0
5.0
ACI
8 Aug.
2010
01:12:38
1.0
1.0
0.0
0.5
1.0
3.5
PrI
9 Oct.
2010
07:42:28
1.0
1.0
0.0
0.5
1.0
3.5
PrI
26 Oct.
2010
06:56:29
1.0
1.0
0.0
0.5
1.0
3.5
PrI
21 Dec.
2010
13:53:18
1.0
1.0
0.5
0.5
1.0
4.0
ACI
17 Feb.
2011
18:25:34
0.0
0.0
0.0
0.0
0.0
0.0
T
1 Mar.
2011
03:30:13
1.0
1.0
0.0
0.5
1.0
3.5
PrI
12 Mar.
2011
15:22:00
1.0
1.0
0.0
0.5
1.0
3.5
PrI
13 Mar.
2011
20:16:21
1.0
1.0
0.0
0.5
1.0
3.5
PrI
290
Ref Frohlich et al. (2011) Frohlich et al. (2011) Frohlich et al. (2011) Gan & Frohlich (2013) Frohlich & Brunt (2013) Frohlich et al. (2012) Gan & Frohlich (2013) Gan & Frohlich (2013) Gan & Frohlich (2013) Frohlich & Brunt (2013) Gan & Frohlich (2013) Gan & Frohlich (2013) Gan & Frohlich (2013)
Location Dallas-Fort Worth Dallas-Fort Worth Dallas-Fort Worth
County
Snyder
Scurry
Borger
Oldham
Falls City?
Karnes
Alice
Jim Wells
Snyder
Scurry
Snyder
Scurry
Snyder
Scurry
Fashing
Bee
Marathon
Brewster
Snyder
Scurry
Snyder
Scurry
Snyder
Kent
Tarrant Tarrant Tarrant
Date
Year
Time
QT
QS
QD
QF
QP
Sum
Type
14 Mar.
2011
00:19:49
1.0
1.0
0.0
0.5
1.0
3.5
PrI
19 Mar.
2011
23:24:01
1.0
1.0
0.0
0.5
1.0
3.5
PrI
28 Mar.
2011
09:12:12
1.0
1.0
0.0
0.5
1.0
3.5
PrI
2 Apr.
2011
22:05:14
1.0
1.0
0.0
0.5
1.0
3.5
PrI
2 May
2011
19:07:15
1.0
1.0
0.0
0.5
1.0
3.5
PrI
17 Jul.
2011
06:58:01
1.0
1.0
0.0
0.5
1.0
3.5
PrI
11 Sept.
2011
12:27:44
1.0
1.0
0.0
0.5
1.0
3.5
PrI
12 Sept.
2011
14:18:34
1.0
1.0
0.0
0.5
1.0
3.5
PrI
20 Oct.
2011
12:24:42
1.0
1.0
0.5
0.5
1.0
4.0
ACI
12 Nov.
2011
10:34:54
1.0
1.0
0.5
0.5
1.0
4.0
ACI
24 Nov.
2011
23:15:49
1.0
1.0
0.0
0.5
1.0
3.5
PrI
9 Dec.
2011
18:47:32
1.0
1.0
0.0
0.5
1.0
3.5
PrI
291
Ref Gan & Frohlich (2013) Gan & Frohlich (2013) Gan & Frohlich (2013) Gan & Frohlich (2013) Gan & Frohlich (2013) Frohlich (2012) Gan & Frohlich (2013) Gan & Frohlich (2013) Frohlich & Brunt (2013) Frohlich & Brunt (2013) Gan & Frohlich (2013) Gan & Frohlich (2013)
Location
County
Snyder
Kent
Snyder
Kent
Snyder
Scurry
Snyder
Kent
Snyder
Kent
Venus
Johnson
Snyder
Scurry
Snyder
Scurry
Fashing
Atascosa
Fashing
Atascosa
Snyder
Scurry
Snyder
Scurry
Date
Year
Time
QT
QS
QD
QF
QP
Sum
Type
17 Dec.
2011
14:46:58
1.0
1.0
0.0
0.5
1.0
3.5
PrI
18 Jan
2012
22:30:54
1.0
1.0
1.0
0.0
1.0
4.0
ACI
24 Jan.
2012
18:21:03
0.0
0.0
0.0
0.0
0.0
0.0
T
4 Feb.
2012
12:48:09
1.0
1.0
0.5
0.5
1.0
4.0
ACI
10 May
2012
15:15:39
1.0
1.0
1.0
1.0
1.0
5.0
ACI
17 May
2012
08:12:01
1.0
1.0
1.0
1.0
1.0
5.0
ACI
15 Jun.
2012
07:02:32
1.0
1.0
1.0
0.0
1.0
4.0
ACI
24 Jun.
2012
08:55:59
1.0
1.0
0.5
0.5
1.0
4.0
ACI
24 Jun.
2012
17:46:43
1.0
1.0
1.0
0.0
1.0
4.0
ACI
12 Aug. 30 Sept. 30 Sept. 7 Nov. 23 Jan.
2012 2012 2012 2012 2013
00:36:04 04:04:59 04:09:03 17:38:00 04:16:19
1.0 0.5 0.5 1.0 0.5
1.0 0.5 0.5 1.0 0.5
0.0 1.0 1.0 0.0 1.0
0.0 1.0 1.0 0.0 1.0
0.0 0.0 0.0 0.0 0.0
2.0 3.0 3.0 2.0 3.0
PsI PrI PrI PsI PrI
25 Jan.
2013
07:01:20
1.0
1.0
1.0
1.0
1.0
5.0
ACI
6 May
2013
23:11:59
1.0
1.0
0.0
0.5
1.0
3.5
PrI
14 May
2013
00:05:40
0.0
0.0
0.0
0.0
0.0
0.0
T
2 Sept.
2013
21:52:37
1.0
1.0
1.0
1.0
1.0
5.0
ACI
2 Sept.
2013
23:51:15
1.0
1.0
1.0
1.0
1.0
5.0
ACI
292
Ref Gan & Frohlich (2013) Justinic et al. (2013) Frohlich & Brunt (2013) Frohlich et al. (2014) Frohlich et al. (2014) Justinic et al. (2013) Pennington et al. (1986) Justinic et al. (2013)
Frohlich et al. (2014) Gan & Frohlich (2013) Frohlich et al. (2014) Frohlich et al. (2014)
Location
County
Snyder
Scurry
Cleburne
Johnson
Alpine
Brewster
Fashing
Atascosa
Timpson
Shelby
Timpson
Shelby
Cleburne
Johnson
Pleasanton
McMullen
Cleburne
Johnson
Amarillo Irving Irving Hebronville Irving
Potter Dallas Dallas Jim Hogg Dallas
Timpson
Shelby
Snyder
Kent
Van Horn
Culberson
Timpson
Shelby
Timpson
Shelby
Date
Year
Time
QT
QS
QD
QF
QP
Sum
Type
9 Nov.
2013
19:54:31
1.0
1.0
1.0
1.0
1.0
5.0
ACI
12 Nov.
2013
17:36:03
0.0
0.0
0.0
0.0
0.0
0.0
T
20 Nov.
2013
00:40:35
1.0
1.0
1.0
1.0
1.0
5.0
ACI
25 Nov.
2013
07:43:03
1.0
1.0
1.0
1.0
1.0
5.0
ACI
26 Nov.
2013
14:24:03
1.0
1.0
1.0
1.0
1.0
5.0
ACI
28 Nov.
2013
07:58:34
1.0
1.0
1.0
1.0
1.0
5.0
ACI
29 Nov.
2013
06:14:10
1.0
1.0
1.0
1.0
1.0
5.0
ACI
8 Dec.
2013
06:10:01
1.0
1.0
1.0
1.0
1.0
5.0
ACI
9 Dec.
2013
09:23:14
1.0
1.0
1.0
1.0
1.0
5.0
ACI
22 Dec.
2013
17:31:55
1.0
1.0
1.0
1.0
1.0
5.0
ACI
23 Dec.
2013
13:11:34
1.0
1.0
1.0
1.0
1.0
5.0
ACI
6 Jan.
2014
08:41:20
0.0
0.0
0.0
0.0
0.0
0.0
T
13 Jan.
2014
17:40:21
1.0
1.0
1.0
1.0
1.0
5.0
ACI
28 Jan.
2014
17:43:44
1.0
1.0
0.0
0.5
1.0
3.5
PrI
14 May
2014
15:52:17
1.0
1.0
0.0
0.5
1.0
3.5
PrI
10 Sept.
2014
17:53:24
1.0
1.0
0.5
0.5
1.0
4.0
ACI
293
Ref Hornbach et al. (2015) Hornbach et al. (2015) Hornbach et al. (2015) Hornbach et al. (2015) Hornbach et al. (2015) Hornbach et al. (2015) Hornbach et al. (2015) Hornbach et al. (2015) Hornbach et al. (2015) Hornbach et al. (2015) Hornbach et al. (2015) Gan & Frohlich (2013) Gan & Frohlich (2013) Pennington et al. (1986)
Location
County
Azle
Parker
Hudspeth
Hudspeth
Azle
Wise
Reno
Parker
Reno
Parker
Mineral Wells
Parker
Azle
Denton
Azle
Parker
Mineral Wells
Parker
Reno
Parker
Reno
Parker
Boise
Oldham
Reno
Parker
Snyder
Scurry
Snyder
Scurry
Jourdanton
Atascosa
Date
Year
Time
QT
QS
QD
QF
QP
Sum
Type
14 Sept.
2014
09:19:00
1.0
1.0
0.0
0.5
1.0
3.5
PrI
3 Oct.
2014
04:52:33
0.5
0.5
0.0
0.0
0.5
1.5
PsI
23 Nov.
2014
03:15:47
0.5
0.5
1.0
1.0
0.0
3.0
PrI
30 Nov.
2014
05:52:24
1.0
1.0
0.0
0.0
1.0
3.0
PrI
3 Dec.
2014
13:33:39
1.0
1.0
0.0
0.0
0.0
2.0
PsI
31 Dec.
2014
18:31:40
1.0
1.0
0.0
0.5
1.0
3.5
PrI
6 Jan.
2015
21:10:31
0.5
0.5
1.0
1.0
0.0
3.0
PrI
6 Jan.
2015
21:55:19
1.0
1.0
0.0
0.5
1.0
3.5
PrI
7 Jan. 7 Jan. 20 Jan.
2015 2015 2015
00:52:09 06:59:03 20:25:49
0.5 0.5 0.5
0.5 0.5 0.5
1.0 1.0 1.0
1.0 1.0 1.0
0.0 0.0 0.0
3.0 3.0 3.0
PrI PrI PrI
31 Jan.
2015
02:17:02
1.0
1.0
0.5
0.5
1.0
4.0
ACI
2 Feb. 19 Feb. 27 Feb. 2 Apr.
2015 2015 2015 2015
00:39:27 20:31:20 12:18:21 22:36:21
0.0 1.0 0.5 0.5
0.0 1.0 0.5 0.5
0.0 0.0 1.0 1.0
0.0 0.0 1.0 1.0
0.0 0.0 0.0 0.0
0.0 2.0 3.0 3.0
T PsI PrI PrI
4 Apr.
2015
00:16:33
1.0
1.0
0.0
0.0
0.5
2.5
PrI
17 Apr.
2015
22:15:14
1.0
0.5
0.0
0.0
0.5
2.5
PsI
3 May
2015
15:11:15
0.5
0.5
1.0
1.0
0.0
3.0
PrI
7 May
2015
22:58:07
1.0
1.0
0.0
0.5
1.0
3.5
PrI
17 May
2015
22:15:13
1.0
0.5
0.0
0.0
0.5
2.0
PsI
294
Ref Gan & Frohlich (2013) Walter et al. (2016) Frohlich (2012) Gan & Frohlich (2013) Gan & Frohlich (2013)
Frohlich & Brunt (2013)
Doser et al. (1992) Doser et al. (1992) Frohlich (2012) Doser et al. (1992)
Location
County
Snyder
Scurry
Center
Shelby
Irving
Dallas
Mansfield
Johnson
Follett
Lipscomb
Snyder
Scurry
Irving
Dallas
Snyder
Scurry
Irving Irving Irving
Dallas Dallas Dallas
Fashing
Atascosa
Amarillo Hallettsville Irving Irving
Potter Lavaca Dallas Dallas Reeves
Pecos
Pecos
Irving
Dallas
Venus
Johnson
Pecos
Pecos
Date 18 May
Year 2015
Time 18:14:29
QT 0.5
QS 0.5
QD 1.0
QF 1.0
QP 0.0
Sum 3.0
Type PrI
4 Aug.
2015
15:06:32
1.0
0.5
0.0
0.0
0.5
2.0
PsI
12 Aug.
2015
20:49:22
1.0
0.5
0.0
0.0
0.5
2.0
PsI
7 Nov.
2015
05:18:20
1.0
0.5
0.0
0.0
0.5
2.0
PsI
10 Nov.
2015
21:43:04
1.0
0.5
0.0
0.0
0.5
2.0
PsI
14 Dec. 17 Dec
2015 2015
12:35:03 22:29:56
1.0 1.0
0.5 1.0
0.0 0.0
0.0 0.0
0.0 0.0
1.5 2.0
PsI PsI
295
Ref Doser et al. (1992) Doser et al. (1992) Doser et al. (1992) Doser et al. (1992)
Location Irving
County Dallas Reeves
Fort Stockton
Pecos
Monahans
Reeves
Monahans
Ward
Nixon Haslet
Wilson Tarrant
Appendix B. Information on the Selected Ground Motions Table B.1: Information on selected ground motion recordings Date
Time
11/6/2011 11/6/2011 11/6/2011 11/6/2011 11/6/2011 11/6/2011 9/3/2016 11/6/2011 11/6/2011 11/6/2011 9/3/2016 9/3/2016 11/8/2011 9/3/2016 2/13/2016 11/6/2011 11/6/2011 2/13/2016 9/21/2013 10/2/2014 1/7/2016 1/7/2016 11/6/2011 11/7/2016 11/8/2011 11/19/2015 11/7/2016 11/7/2016 11/30/2015 11/5/2011 11/5/2011 11/6/2011 11/30/2015
3:53:10 3:53:10 3:53:10 3:53:10 3:53:10 3:53:10 12:02:44 3:53:10 3:53:10 3:53:10 12:02:44 12:02:44 2:46:57 12:02:44 17:07:06 3:53:10 3:53:10 17:07:06 12:16:12 18:01:24 4:27:27 4:27:27 3:53:10 1:44:24 2:46:57 7:42:12 1:44:24 1:44:24 9:49:12 7:12:45 7:12:45 3:53:10 9:49:12
Event Event Magnitude Latitude Longitude 35.5501 -96.7579 5.7 35.5501 -96.7579 5.7 35.5501 -96.7579 5.7 35.5501 -96.7579 5.7 35.5501 -96.7579 5.7 35.5501 -96.7579 5.7 36.4298 -96.9317 5.8 35.5501 -96.7579 5.7 35.5501 -96.7579 5.7 35.5501 -96.7579 5.7 36.4298 -96.9317 5.8 36.4298 -96.9317 5.8 35.5275 -96.7918 5.0 36.4298 -96.9317 5.8 36.4905 -98.7056 5.1 35.5501 -96.7579 5.7 35.5501 -96.7579 5.7 36.4905 -98.7056 5.1 27.8013 -105.6794 5.4 37.2447 -97.9553 4.5 36.4955 -98.7254 4.7 36.4955 -98.7254 4.7 35.5501 -96.7579 5.7 35.9837 -96.7982 5.0 35.5275 -96.7918 5.0 36.6602 -98.4594 4.7 35.9837 -96.7982 5.0 35.9837 -96.7982 5.0 36.7509 -98.0561 4.5 35.5525 -96.7387 5.0 35.5525 -96.7387 5.0 35.5501 -96.7579 5.7 36.7509 -98.0561 4.5
Depth
Network
7.5 7.5 7.5 7.5 7.5 7.5 5.4 7.5 7.5 7.5 5.4 5.4 2.7 5.4 8 7.5 7.5 8 10 5 4.1 4.1 7.5 5 2.7 5.9 5 5 5.6 6.2 6.2 7.5 5.6
TA TA TA TA TA TA US TA TA US N4 OK TA US GS TA TA GS IM GS GS GS TA GS TA OK GS GS GS OK TA TA OK
296
Station Station Latitude Longitude S37A 37.7597 -94.8279 Z36A 33.2702 -96.4344 R36A 38.3237 -95.5040 Y35A 33.9059 -97.0374 X38A 34.6692 -94.8288 ABTX 32.6238 -99.6431 CBKS 38.8140 -99.7374 X37A 34.5892 -95.3713 W38A 35.0704 -94.5184 WMOK 34.7379 -98.7807 R32B 38.4225 -98.7111 LOOK 33.9924 -97.1800 W37B 35.1390 -95.4316 KSU1 39.1009 -96.6094 OK029 35.7966 -97.4549 Y36A 33.8996 -96.2848 Y38A 33.9278 -94.7311 OK031 35.9531 -96.8391 TX32 29.3338 -103.6670 KAN13 37.0129 -97.4778 KAN08 37.2267 -97.9709 KAN10 37.1235 -98.0951 Y37A 33.9789 -95.6210 OK032 36.8038 -98.2104 U35A 36.3709 -96.7318 QUOK 36.1714 -96.7080 OK029 35.7966 -97.4549 KS21 37.2865 -97.6630 KAN12 37.2974 -97.9980 OKCFA 35.4153 -97.4518 W37B 35.1390 -95.4316 T35A 36.9161 -96.5121 DEOK 35.8427 -96.4983 Station
VS 30 (m/s) 1620 520 636 812 1202 975 439 1073 1120 1663 666 764 1321 697 630 781 826 509 1002 353 1055 946 532 500 969 503 630 374 524 660 1321 849 906
Hypocentral PGA (g) Distance (km) 300.1 0.0025 255.4 0.0025 328.0 0.0027 184.8 0.0029 201.1 0.0029 420.1 0.0029 362.4 0.0030 165.5 0.0042 210.2 0.0042 205.0 0.0047 271.7 0.0051 272.0 0.0052 130.8 0.0053 298.4 0.0053 136.5 0.0054 188.7 0.0054 258.6 0.0054 178.0 0.0055 260.3 0.0058 49.8 0.0062 105.5 0.0063 89.7 0.0064 203.4 0.0064 155.9 0.0065 94.0 0.0066 166.0 0.0066 62.9 0.0066 164.2 0.0067 61.2 0.0068 66.6 0.0069 127.3 0.0070 153.7 0.0071 172.4 0.0071
Date
Time
11/30/2015 11/7/2016 2/13/2016 11/7/2016 11/7/2016 2/13/2016 2/13/2016 11/19/2015 11/7/2016 7/20/2015 10/13/2010 2/13/2016 11/20/2015 1/7/2016 6/16/2014 2/13/2016 2/13/2016 11/30/2015 11/7/2016 11/30/2015 10/10/2014 11/7/2016 11/30/2015 11/30/2015 11/30/2015 10/13/2010 11/7/2016 2/13/2016 7/20/2015 11/7/2016 10/10/2015 6/18/2014 10/20/2011
9:49:12 1:44:24 17:07:06 1:44:24 1:44:24 17:07:06 17:07:06 7:42:12 1:44:24 20:19:03 14:06:30 17:07:06 22:40:40 4:27:27 10:47:35 17:07:06 17:07:06 9:49:12 1:44:24 9:49:12 13:51:21 1:44:24 9:49:12 9:49:12 9:49:12 14:06:30 1:44:24 17:07:06 20:19:03 1:44:24 9:20:43 10:53:02 12:24:41
Event Event Magnitude Latitude Longitude 36.7509 -98.0561 4.5 35.9837 -96.7982 5.0 36.4905 -98.7056 5.1 35.9837 -96.7982 5.0 35.9837 -96.7982 5.0 36.4905 -98.7056 5.1 36.4905 -98.7056 5.1 36.6602 -98.4594 4.7 35.9837 -96.7982 5.0 36.842 -98.2593 4.4 35.2196 -97.3262 4.3 36.4905 -98.7056 5.1 36.9483 -97.8276 4.1 36.4955 -98.7254 4.7 35.5935 -97.3969 4.3 36.4905 -98.7056 5.1 36.4905 -98.7056 5.1 36.7509 -98.0561 4.5 35.9837 -96.7982 5.0 36.7509 -98.0561 4.5 35.9466 -96.7594 4.3 35.9837 -96.7982 5.0 36.7509 -98.0561 4.5 36.7509 -98.0561 4.5 36.7509 -98.0561 4.5 35.2196 -97.3262 4.3 35.9837 -96.7982 5.0 36.4905 -98.7056 5.1 36.842 -98.2593 4.4 35.9837 -96.7982 5.0 36.7187 -97.9311 4.4 35.5956 -97.3924 4.1 28.8481 -98.1485 4.8
Depth
Network
Station
5.6 5 8 5 5 8 8 5.9 5 4.1 4.8 8 5 4.1 5 8 8 5.6 5 5.6 5 5 5.6 5.6 5.6 4.8 5 8 4.1 5 5.6 5 14.2
GS GS GS NQ GS OK GS OK GS GS TA OK GS OK GS GS GS GS OK GS OK GS GS GS GS TA OK GS GS GS GS OK TA
KAN11 KAN05 OK025 KAN02 KAN06 QUOK KS21 CCOK KAN17 KAN10 Z34A CCOK KAN06 CROK OK028 OK030 KAN12 KAN01 CHOK OK031 QUOK KAN14 KAN13 KAN08 KAN06 W35A RLOK KAN17 KAN08 KS20 KAN10 BCOK 735A
297
Station Station Latitude Longitude 37.2060 -97.9133 37.1080 -97.8715 35.5811 -97.3379 37.1977 -97.8787 37.2480 -97.8586 36.1714 -96.7080 37.2865 -97.6630 35.3568 -97.6561 37.0441 -97.7648 37.1235 -98.0951 33.3712 -97.9158 35.3568 -97.6561 37.2480 -97.8586 36.5047 -97.9834 35.5611 -97.0614 35.9278 -96.7838 37.2974 -97.9980 37.1535 -97.7592 35.5611 -97.0613 35.9531 -96.8391 36.1714 -96.7080 36.9568 -97.9630 37.0129 -97.4778 37.2267 -97.9709 37.2480 -97.8586 35.1527 -96.8745 36.1676 -95.0268 37.0441 -97.7648 37.2267 -97.9709 37.2297 -97.5543 37.1235 -98.0951 35.6567 -97.6093 28.8553 -97.8081
VS 30 (m/s) 995 765 502 1118 1008 503 374 664 183 946 740 664 1008 493 461 448 524 825 525 509 503 701 353 1055 1008 521 1534 183 1055 299 946 796 430
Hypocentral PGA (g) Distance (km) 52.5 0.0072 157.6 0.0072 159.4 0.0073 166.0 0.0073 169.5 0.0074 182.6 0.0074 128.4 0.0077 162.0 0.0078 146.2 0.0078 34.8 0.0080 212.6 0.0080 157.7 0.0080 33.8 0.0083 66.5 0.0083 31.0 0.0084 183.6 0.0085 109.9 0.0086 52.3 0.0087 52.9 0.0087 140.6 0.0088 25.9 0.0089 150.3 0.0090 59.4 0.0090 53.7 0.0090 58.3 0.0091 42.0 0.0091 160.6 0.0091 104.3 0.0092 50.0 0.0094 154.2 0.0095 47.6 0.0095 21.3 0.0095 36.1 0.0096
Date
Time
4/27/2015 11/7/2016 11/30/2015 7/27/2015 2/13/2016 11/19/2015 11/7/2015 11/8/2011 2/13/2016 12/29/2015 7/27/2015 10/10/2015 2/13/2016 11/7/2016 11/7/2016 11/30/2015 11/19/2015 10/10/2015 11/7/2015 7/20/2015 4/16/2013 11/19/2015 11/19/2015 11/7/2016 1/7/2016 11/5/2011 6/16/2014 4/16/2013 11/6/2011 11/20/2015 11/30/2015 10/10/2015 11/7/2016 11/7/2015
22:22:17 1:44:24 9:49:12 18:12:15 17:07:06 7:42:12 11:11:53 2:46:57 17:07:06 11:39:19 18:12:15 9:20:43 17:07:06 1:44:24 1:44:24 9:49:12 7:42:12 9:20:43 11:11:53 20:19:03 6:56:29 7:42:12 7:42:12 1:44:24 4:27:27 7:12:45 10:47:35 6:56:29 3:53:10 22:40:40 9:49:12 9:20:43 1:44:24 11:11:53
Event Event Magnitude Latitude Longitude 35.918 -97.3256 4.1 35.9837 -96.7982 5.0 36.7509 -98.0561 4.5 35.9889 -97.5717 4.3 36.4905 -98.7056 5.1 36.6602 -98.4594 4.7 36.9528 -97.8552 4.1 35.5275 -96.7918 5.0 36.4905 -98.7056 5.1 35.6654 -97.4054 4.3 35.9889 -97.5717 4.3 36.7187 -97.9311 4.4 36.4905 -98.7056 5.1 35.9837 -96.7982 5.0 35.9837 -96.7982 5.0 36.7509 -98.0561 4.5 36.6602 -98.4594 4.7 36.7187 -97.9311 4.4 36.9528 -97.8552 4.1 36.842 -98.2593 4.4 35.685 -97.066 4.4 36.6602 -98.4594 4.7 36.6602 -98.4594 4.7 35.9837 -96.7982 5.0 36.4955 -98.7254 4.7 35.5525 -96.7387 5.0 35.5935 -97.3969 4.3 35.685 -97.066 4.4 35.5501 -96.7579 5.7 36.9483 -97.8276 4.1 36.7509 -98.0561 4.5 36.7187 -97.9311 4.4 35.9837 -96.7982 5.0 36.9528 -97.8552 4.1
Depth
Network
Station
5.3 5 5.6 5 8 5.9 5 2.7 8 6.5 5 5.6 8 5 5 5.6 5.9 5.6 5 4.1 5 5.9 5.9 5 4.1 6.2 5 5 7.5 5 5.6 5.6 5 5
GS GS GS GS GS GS GS TA GS OK GS GS GS GS NQ GS GS GS GS OK OK GS GS GS OK TA OK OK OK GS GS OK OK GS
OK029 KAN13 KAN10 OK029 KAN10 KAN16 KAN06 W35A KAN06 BCOK OK031 KAN09 KAN14 KAN01 KAN15 KAN05 KAN01 KAN06 KAN13 CROK FNO KAN12 KAN11 OK025 U32A V35A BCOK BCOK X34A KAN05 KAN17 QUOK BCOK KAN01
298
Station Station Latitude Longitude 35.7966 -97.4549 37.0129 -97.4778 37.1235 -98.0951 35.7966 -97.4549 37.1235 -98.0951 37.2256 -98.0647 37.2480 -97.8586 35.1527 -96.8745 37.2480 -97.8586 35.6567 -97.6093 35.9531 -96.8391 37.1361 -97.6183 36.9568 -97.9630 37.1535 -97.7592 37.2998 -97.5727 37.1080 -97.8715 37.1535 -97.7592 37.2480 -97.8586 37.0129 -97.4778 36.5047 -97.9834 35.2574 -97.4012 37.2974 -97.9980 37.2060 -97.9133 35.5811 -97.3379 36.3795 -99.0014 35.7626 -96.8378 35.6567 -97.6093 35.6567 -97.6093 34.6010 -97.8326 37.1080 -97.8715 37.0441 -97.7648 36.1714 -96.7080 35.6567 -97.6093 37.1535 -97.7592
VS 30 (m/s) 630 353 946 630 946 971 1008 521 1008 796 509 396 701 825 1051 765 825 1008 353 493 578 524 995 502 700 598 796 796 818 765 183 503 796 825
Hypocentral PGA (g) Distance (km) 18.6 0.0097 129.7 0.0100 42.0 0.0101 24.4 0.0101 89.3 0.0101 72.2 0.0103 33.2 0.0104 42.4 0.0104 113.3 0.0104 19.6 0.0104 66.2 0.0109 54.4 0.0110 84.5 0.0110 155.9 0.0112 161.9 0.0112 43.3 0.0113 83.2 0.0114 59.5 0.0114 34.5 0.0116 45.0 0.0116 56.6 0.0117 82.1 0.0117 77.9 0.0117 66.3 0.0119 28.2 0.0119 25.8 0.0120 21.0 0.0122 49.4 0.0124 144.1 0.0124 18.9 0.0125 42.0 0.0125 125.3 0.0127 81.8 0.0128 24.4 0.0129
Date
Time
2/13/2016 11/19/2015 11/12/2014 11/7/2016 11/6/2011 9/3/2016 11/30/2015 11/7/2015 11/19/2015 11/7/2016 6/5/2015 9/3/2016 11/7/2016 11/7/2015 10/2/2014 10/10/2015 4/16/2013 2/13/2016 11/19/2015 11/20/2015 11/19/2015 11/19/2015 11/30/2015 1/1/2016 4/7/2014 10/2/2014 11/30/2015 11/19/2015 11/19/2015 8/19/2014 11/19/2015 11/8/2011 2/13/2016
17:07:06 7:42:12 21:40:00 1:44:24 3:53:10 12:02:44 9:49:12 11:11:53 7:42:12 1:44:24 23:12:41 12:02:44 1:44:24 11:11:53 18:01:24 9:20:43 10:16:53 17:07:06 7:42:12 22:40:40 7:42:12 7:42:12 9:49:12 11:39:39 16:03:03 18:01:24 9:49:12 7:42:12 7:42:12 12:41:35 7:42:12 2:46:57 17:07:06
Event Event Magnitude Latitude Longitude 36.4905 -98.7056 5.1 36.6602 -98.4594 4.7 37.2713 -97.6206 4.9 35.9837 -96.7982 5.0 35.5501 -96.7579 5.7 36.4298 -96.9317 5.8 36.7509 -98.0561 4.5 36.9528 -97.8552 4.1 36.6602 -98.4594 4.7 35.9837 -96.7982 5.0 37.2648 -97.9213 4.2 36.4298 -96.9317 5.8 35.9837 -96.7982 5.0 36.9528 -97.8552 4.1 37.2447 -97.9553 4.5 36.7187 -97.9311 4.4 35.687 -97.109 4.2 36.4905 -98.7056 5.1 36.6602 -98.4594 4.7 36.9483 -97.8276 4.1 36.6602 -98.4594 4.7 36.6602 -98.4594 4.7 36.7509 -98.0561 4.5 35.6688 -97.4065 4.2 35.8913 -97.2752 4.2 37.2447 -97.9553 4.5 36.7509 -98.0561 4.5 36.6602 -98.4594 4.7 36.6602 -98.4594 4.7 35.7727 -97.4677 4.1 36.6602 -98.4594 4.7 35.5275 -96.7918 5.0 36.4905 -98.7056 5.1
Depth
Network
8 5.9 4 5 7.5 5.4 5.6 5 5.9 5 2.4 5.4 5 5 5 5.6 5 8 5.9 5 5.9 5.9 5.6 5.8 5.1 5 5.6 5.9 5.9 4.5 5.9 2.7 8
OK OK GS OK TA OK GS GS GS GS GS OK GS GS GS GS OK GS GS GS GS GS OK OK GS GS OK GS GS OK GS OK OK
299
Station Station Latitude Longitude CROK 36.5047 -97.9834 CROK 36.5047 -97.9834 KAN14 36.9568 -97.9630 DEOK 35.8427 -96.4983 W35A 35.1527 -96.8745 X34A 34.6010 -97.8326 KAN09 37.1361 -97.6183 KAN09 37.1361 -97.6183 KS21 37.2865 -97.6630 KAN09 37.1361 -97.6183 KAN10 37.1235 -98.0951 U32A 36.3795 -99.0014 KAN12 37.2974 -97.9980 KAN05 37.1080 -97.8715 KAN14 36.9568 -97.9630 KAN14 36.9568 -97.9630 BCOK 35.6567 -97.6093 OK032 36.8038 -98.2104 KAN06 37.2480 -97.8586 KAN09 37.1361 -97.6183 KAN09 37.1361 -97.6183 KAN05 37.1080 -97.8715 QUOK 36.1714 -96.7080 CHOK 35.5611 -97.0613 OK029 35.7966 -97.4549 KAN09 37.1361 -97.6183 CROK 36.5047 -97.9834 KAN17 37.0441 -97.7648 KAN10 37.1235 -98.0951 BCOK 35.6567 -97.6093 KAN14 36.9568 -97.9630 OKCFA 35.4153 -97.4518 U32A 36.3795 -99.0014 Station
VS 30 (m/s) 493 493 701 906 521 818 396 396 374 396 946 700 524 765 701 701 796 500 1008 396 396 765 503 525 630 396 493 183 946 796 701 660 700
Hypocentral PGA (g) Distance (km) 65.1 0.0129 46.3 0.0129 46.5 0.0130 31.6 0.0131 46.1 0.0132 219.2 0.0132 58.1 0.0136 29.7 0.0139 99.4 0.0139 147.7 0.0141 22.1 0.0143 185.4 0.0145 181.2 0.0147 18.0 0.0148 32.4 0.0150 27.2 0.0155 45.6 0.0158 56.8 0.0159 84.6 0.0160 28.4 0.0161 91.8 0.0163 72.4 0.0166 136.8 0.0169 33.9 0.0172 20.0 0.0178 32.6 0.0178 28.7 0.0182 75.3 0.0185 61.1 0.0196 18.7 0.0201 55.5 0.0202 61.1 0.0204 30.3 0.0219
Date
Time
1/7/2016 1/7/2016 11/30/2015 11/12/2014 2/13/2016 9/3/2016 11/7/2016 11/20/2015 9/3/2016 9/3/2016 5/17/2012 9/3/2016 9/3/2016 9/3/2016 11/12/2014 9/25/2015 9/3/2016 9/3/2016 9/3/2016 9/3/2016 11/8/2011 9/3/2016 6/5/2015 11/12/2014 9/3/2016 11/7/2016 9/3/2016 11/20/2015 9/3/2016 9/3/2016 9/3/2016 10/2/2014 9/3/2016
4:27:27 4:27:57 9:49:12 21:40:00 17:07:06 12:02:44 1:44:24 22:40:40 12:02:44 12:02:44 8:12:00 12:02:44 12:02:44 12:02:44 21:40:00 1:16:37 12:02:44 12:02:44 12:02:44 12:02:44 2:46:57 12:02:44 23:12:41 21:40:00 12:02:44 1:44:24 12:02:44 22:40:40 12:02:44 12:02:44 12:02:44 18:01:24 12:02:44
Event Event Magnitude Latitude Longitude 36.4955 -98.7254 4.7 36.4955 -98.7254 4.7 36.7509 -98.0561 4.5 37.2713 -97.6206 4.9 36.4905 -98.7056 5.1 36.4298 -96.9317 5.8 35.9837 -96.7982 5.0 36.9483 -97.8276 4.1 36.4298 -96.9317 5.8 36.4298 -96.9317 5.8 31.926 -94.369 4.4 36.4298 -96.9317 5.8 36.4298 -96.9317 5.8 36.4298 -96.9317 5.8 37.2713 -97.6206 4.9 35.987 -96.7872 4.0 36.4298 -96.9317 5.8 36.4298 -96.9317 5.8 36.4298 -96.9317 5.8 36.4298 -96.9317 5.8 35.5275 -96.7918 5.0 36.4298 -96.9317 5.8 37.2648 -97.9213 4.2 37.2713 -97.6206 4.9 36.4298 -96.9317 5.8 35.9837 -96.7982 5.0 36.4298 -96.9317 5.8 36.9483 -97.8276 4.1 36.4298 -96.9317 5.8 36.4298 -96.9317 5.8 36.4298 -96.9317 5.8 37.2447 -97.9553 4.5 36.4298 -96.9317 5.8
Depth
Network
Station
4.1 4.1 5.6 4 8 5.4 5 5 5.4 5.4 5 5.4 5.4 5.4 4 2.9 5.4 5.4 5.4 5.4 2.7 5.4 2.4 4 5.4 5 5.4 5 5.4 5.4 5.4 5 5.4
GS GS GS GS GS GS OK GS GS GS US OK GS GS GS GS OK GS GS NQ TA GS GS GS GS GS GS GS GS OK OK GS GS
OK035 OK035 KAN14 KAN08 OK035 OK040 QUOK KAN14 KAN17 OK029 NATX CROK KAN16 KAN01 KAN06 OK030 NOKA OK031 KAN06 OK915 V35A KAN13 KAN06 KAN05 KS20 OK033 OK038 KAN17 KAN10 CHOK RLOK KAN10 KAN05
300
Station Station Latitude Longitude 36.7082 -98.7097 36.7082 -98.7097 36.9568 -97.9630 37.2267 -97.9709 36.7082 -98.7097 36.4829 -98.6741 36.1714 -96.7080 36.9568 -97.9630 37.0441 -97.7648 35.7966 -97.4549 31.7600 -94.6600 36.5047 -97.9834 37.2256 -98.0647 37.1535 -97.7592 37.2480 -97.8586 35.9278 -96.7838 36.6347 -98.9319 35.9531 -96.8391 37.2480 -97.8586 35.9536 -96.7726 35.7626 -96.8378 37.0129 -97.4778 37.2480 -97.8586 37.1080 -97.8715 37.2297 -97.5543 36.0444 -96.9382 36.4782 -98.7422 37.0441 -97.7648 37.1235 -98.0951 35.5611 -97.0613 36.1676 -95.0268 37.1235 -98.0951 37.1080 -97.8715
VS 30 (m/s) 123 123 701 1055 123 330 503 701 183 630 401 493 971 825 1008 448 612 509 1008 860 598 353 1008 765 299 362 254 183 946 525 1534 946 765
Hypocentral PGA (g) Distance (km) 24.0 0.0224 24.0 0.0224 25.0 0.0246 31.7 0.0268 25.5 0.0299 156.0 0.0309 22.9 0.0310 13.1 0.0316 101.0 0.0316 84.8 0.0322 33.5 0.0325 94.6 0.0325 134.3 0.0326 109.2 0.0330 21.6 0.0339 7.2 0.0344 180.2 0.0352 53.9 0.0355 122.9 0.0360 55.1 0.0366 26.6 0.0368 81.3 0.0375 6.3 0.0381 29.0 0.0386 104.9 0.0405 15.1 0.0405 162.1 0.0408 13.0 0.0411 129.3 0.0415 97.4 0.0418 173.3 0.0419 19.0 0.0433 112.8 0.0440
Date
Time
9/3/2016 6/5/2015 9/3/2016 11/7/2015 11/6/2011 9/3/2016 9/3/2016 12/29/2015 9/3/2016 6/5/2015 9/3/2016 10/2/2014 9/3/2016 9/3/2016 6/20/2015 9/3/2016 9/3/2016 9/3/2016 1/1/2016 11/7/2015 9/25/2015 10/2/2014 10/2/2014 11/19/2015 11/12/2014 11/12/2014 11/23/2015 10/10/2015 8/19/2014 6/5/2015 11/7/2016 11/7/2016 11/7/2016 11/7/2016
12:02:44 23:12:41 12:02:44 11:11:53 3:53:10 12:02:44 12:02:44 11:39:19 12:02:44 23:12:41 12:02:44 18:01:24 12:02:44 12:02:44 5:10:54 12:02:44 12:02:44 12:02:44 11:39:39 11:11:53 1:16:37 18:01:24 18:01:24 7:42:12 21:40:00 21:40:00 21:17:46 22:03:05 12:41:35 23:12:41 1:44:24 1:44:24 1:44:24 1:44:24
Event Event Magnitude Latitude Longitude 5.8 36.4298 -96.9317 4.2 37.2648 -97.9213 5.8 36.4298 -96.9317 4.1 36.9528 -97.8552 35.5501 -96.7579 5.7 36.4298 -96.9317 5.8 5.8 36.4298 -96.9317 35.6654 -97.4054 4.3 36.4298 -96.9317 5.8 37.2648 -97.9213 4.2 36.4298 -96.9317 5.8 37.2447 -97.9553 4.5 5.8 36.4298 -96.9317 5.8 36.4298 -96.9317 4.0 35.7392 -97.3865 36.4298 -96.9317 5.8 36.4298 -96.9317 5.8 36.4298 -96.9317 5.8 4.2 35.6688 -97.4065 36.9528 -97.8552 4.1 35.987 -96.7872 4.0 4.5 37.2447 -97.9553 37.2447 -97.9553 4.5 4.7 36.6602 -98.4594 4.9 37.2713 -97.6206 4.9 37.2713 -97.6206 36.8382 -98.2762 4.4 35.986 -96.8032 4.3 4.1 35.7727 -97.4677 37.2648 -97.9213 4.2 35.9837 -96.7982 5.0 35.9837 -96.7982 5.0 35.9837 -96.7982 5.0 35.9837 -96.7982 5.0
Depth
Network
Station
5.4 2.4 5.4 5 7.5 5.4 5.4 6.5 5.4 2.4 5.4 5 5.4 5.4 3 5.4 5.4 5.4 5.8 5 2.9 5 5 5.9 4 4 5 3.3 4.5 2.4 5 5 5 5
GS GS GS GS TA OK OK GS GS GS GS GS GS GS GS NQ NQ GS GS GS GS GS GS GS GS GS GS GS GS GS GS GS NQ NQ
OK025 KAN12 KAN08 KAN17 V35A CCOK QUOK OK025 KAN09 KAN16 KAN14 KAN05 OK005 OK030 OK029 OK914 OK916 OK032 OK025 KAN14 OK031 KAN12 KAN06 OK032 KAN09 KAN01 OK032 OK030 OK029 KAN11 OK031 OK034 OK915 OK914
301
Station Station Latitude Longitude 35.5811 -97.3379 37.2974 -97.9980 37.2267 -97.9709 37.0441 -97.7648 35.7626 -96.8378 35.3568 -97.6561 36.1714 -96.7080 35.5811 -97.3379 37.1361 -97.6183 37.2256 -98.0647 36.9568 -97.9630 37.1080 -97.8715 35.6549 -97.1911 35.9278 -96.7838 35.7966 -97.4549 35.9708 -96.8048 36.8073 -97.7477 36.8038 -98.2104 35.5811 -97.3379 36.9568 -97.9630 35.9531 -96.8391 37.2974 -97.9980 37.2480 -97.8586 36.8038 -98.2104 37.1361 -97.6183 37.1535 -97.7592 36.8038 -98.2104 35.9278 -96.7838 35.7966 -97.4549 37.2060 -97.9133 35.9531 -96.8391 36.0102 -96.7132 35.9536 -96.7726 35.9708 -96.8048
VS 30 (m/s) 502 524 1055 183 598 664 503 502 396 971 701 765 591 448 630 672 524 500 502 701 509 524 1008 500 396 825 500 448 630 995 509 718 860 672
Hypocentral PGA (g) Distance (km) 101.3 0.0444 8.1 0.0445 128.2 0.0446 13.9 0.0448 25.8 0.0450 136.1 0.0452 35.4 0.0453 12.9 0.0457 99.7 0.0463 13.6 0.0465 109.2 0.0472 17.6 0.0501 89.4 0.0555 57.6 0.0568 9.4 0.0590 52.6 0.0595 84.2 0.0596 121.6 0.0598 12.9 0.0604 10.8 0.0676 6.7 0.0695 8.6 0.0730 9.9 0.0743 28.0 0.0927 15.6 0.0940 18.4 0.0974 8.6 0.1157 7.5 0.1329 5.4 0.1413 7.0 0.1700 7.1 0.2085 9.6 0.2731 6.4 0.3278 5.2 0.5947
Appendix C. As-Built Drawings Table C.1: As-built drawing inventory
NBI Structure # Year Built # of Spans Max Span Length (ft) Deck width (ft) 1092004518125 1970 3 80 42 21200013405027 1993 3 80 45 61869914991318 1983 4 83 40 MSPC 161780032603016 1964 2 80 50 180710017204204 2003 3 80 40 41070003005030 1939 3 40 45 90500018401019 1950 3 40 45 MSSTEEL 102120024506026 1939 4 48 60 141500015004027 1942 4 40 50 30390135001006 1964 3 75 25 41800009003052 1969 4 75 28 121020050201008 1952 3 75 82 1813300049501150 1964 4 86 25 230470103902014 1959 3 90 25 161290112201002 1949 3 90 25 MCSTEEL 120200017902050 1958 3 240 46 120200017902098 2007 3 240 40 151310007205174 1971 34 150 42 180570035304135 1975 17 150 44 180570009214192 1971 4 115 26 180570044202067 1965 3 115 48 32430221502001 1956 4 30 25 52190078904002 1970 4 30 28 102340049502017 1963 3 30 25 MSRC 30390082403007 1966 3 40 42 141440033403048 1986 4 40 36 10920051001007 1955 3 25 25 130760033408021 1947 2 25 25 1963 4 25 25 MSRC-Slab 112030263701002 15083001706216 1968 3 25 42 111740181001004 1956 4 25 43 240720212105065 1961 3 30 42 240550000303112 1970 3 30 42 1955 3 30 46 MCRC-Slab 230420007805034 210660032703047 1985 4 25 40 142460203802006 1956 3 40 25
302
Appendix D. Girder and Column Spacing and Number The number of girders and columns as well as their spacings are important parameters in developing representative bridge models. Table D.1 through D.6 present the number of girders and columns as well as the corresponding girder and column spacings for the relevant bridge classes. It should be noted that the reinforced concrete slab type bridges (i.e., MSRC-Slab, and MCRCSlab), due to the slab type superstructure, do not have girders and are not listed in this section. Moreover, single span prestressed concrete girder (SSPC) bridges does not have columns, so the information related to columns are not listed for that specific bridge class. Table D.1: Number and spacing of girder and column for MCSTEEL bridges
Bridge Sample 1 2 3 4 5 6 7 8
Column Number Spacing 5 16 3 9 3 10.5 4 14.5 3 15.5 4 11 3 15 3 12.5
Girder Number Spacing 11 7.00 5 5.67 5 6.67 9 6.00 6 7.33 7 6.33 5 9.00 6 6.00
Table D.2: Number and spacing of girder and column for MSSTEEL bridges
Bridge Sample 1 2 3 4 5 6 7 8
Column Number Spacing 5 11 3 9.5 4 11.5 4 11.5 4 12 4 12 4 10 3 12.5
303
Girder Number Spacing 8 6.67 4 7.33 7 6.33 6 7.33 6 7.67 6 7.67 5 8.33 5 7.00
Table D.3: Number and spacing of girder and column for MSPC bridges
Bridge Sample 1 2 3 4 5 6 7 8
Column Number Spacing 4 12 3 15.5 3 15 3 13 5 15.5 4 15.5 5 13 4 11.5
Girder Number Spacing 6 8.00 6 7.33 7 6.00 5 8.00 11 6.67 8 7.33 10 6.33 7 6.67
Table D.4: Number and spacing of girder and column for MSRC bridges
Bridge Sample 1 2 3 4 5 6 7 8
Column Number Spacing 4 12 3 8 3 11 3 14.5 3 9 3 16 3 7.5 4 11.5
Girder Number Spacing 15 3.00 9 3.00 11 3.00 13 3.00 10 3.00 14 3.00 8 3.00 15 3.00
Table D.5: Number and spacing of girder for SSPC bridges
Bridge Sample 1 2 3 4 5 6 7 8
Girder Number Spacing 7 6.33 11 5.67 10 8.67 6 6.33 8 6.00 7 6.00 7 6.67 8 6.00
304
Table D.6: Number and spacing of column for reinforced concrete slab bridges
Bridge Sample 1 2 3 4 5 6 7 8
MCRC-Slab Number Spacing 5 12.5 4 12.5 4 14 4 12 3 14 4 12 4 14 4 12.5
305
MSRC-Slab Number Spacing 3 9.5 4 12.5 4 12.5 3 11.5 3 10.5 3 10.5 3 10.5 4 14
Appendix E. Parameter Samples The parameter samples for each geometric representative bridge sample used in this study are presented in this appendix. The parameter abbreviations and the units for the values in each of these tables can be found in Section 6.4.7. The parameter samples for the MSPC bridge class are presented in Section 6.7.3 of this report. Table E.1: MCSTEEL modeling parameters for geometric sample 1 Parameter Conc Str Reinf Str Steel Fix-Long Steel Fix-Trans Steel Fix COF-Long Steel Fix COF-Trans Steel Rocker COFLong Steel Rocker COFTrans Abt-Pas Stf Pile Stf Fnd-Rot Stf Fnd-Tran-Stf Mass Damp Ratio Large Gap Load Dir
1 4528 60568 537.3 25.5 0.221 0.313 0.046
2 5820 45085 523.0 27.3 0.186 0.341 0.038
3 4225 57684 437.1 27.0 0.233 0.358 0.037
Modeling Sample 4 5 4333 3847 53239 49924 442.4 477.4 22.5 30.3 0.241 0.200 0.408 0.349 0.036 0.045
0.084
0.096
0.085
0.119
0.110
0.110
0.104
0.085
36.0 53.0 508 200 137 0.041 5.26 273
48.9 32.2 759 317 114 0.047 4.11 323
42.2 56.8 1343 378 120 0.045 2.26 148
31.9 53.8 1077 361 132 0.034 1.16 237
26.0 24.0 984 293 112 0.054 3.43 95
20.8 54.6 841 445 126 0.066 5.09 87
45.6 54.6 653 232 134 0.053 3.63 210
30.8 52.7 1282 147 123 0.025 1.63 45
306
6 3172 56127 402.5 26.8 0.202 0.423 0.038
7 4849 53439 414.3 20.9 0.227 0.304 0.042
8 5213 66973 391.5 22.7 0.214 0.394 0.036
Table E.2: MCSTEEL modeling parameters for geometric sample 2 Parameter Conc Str Reinf Str Steel Fix-Long Steel Fix-Trans Steel Fix COF-Long Steel Fix COF-Trans Steel Rocker COFLong Steel Rocker COFTrans Abt-Pas Stf Pile Stf Fnd-Rot Stf Fnd-Tran-Stf Mass Damp Ratio Large Gap Load Dir
Modeling Sample 4 5 4086 2701 64328 53743 477.2 458.9 21.9 31.1 0.192 0.171 0.321 0.324 0.043 0.032
1 3547 52335 550.0 24.9 0.235 0.346 0.041
2 5490 58206 417.0 24.3 0.240 0.411 0.036
3 5063 45535 526.1 26.6 0.204 0.405 0.038
0.086
0.110
0.083
0.111
48.1 41.1 836 191 112 0.043 3.37 207
31.2 33.1 1193 368 130 0.056 1.50 140
20.0 38.4 1124 328 134 0.026 2.87 103
20.2 42.4 538 142 127 0.052 1.78 34
6 5362 57475 483.6 28.1 0.230 0.380 0.043
7 4544 54803 541.4 22.9 0.215 0.346 0.041
8 4281 51441 550.5 25.2 0.214 0.373 0.043
0.093
0.091
0.084
0.120
24.2 27.5 671 392 121 0.059 4.82 326
42.1 56.2 1410 442 138 0.040 5.44 77
37.4 45.2 974 221 125 0.032 4.38 303
34.1 33.1 811 262 115 0.049 1.23 270
Table E.3: MCSTEEL modeling parameters for geometric sample 3 Parameter Conc Str Reinf Str Steel Fix-Long Steel Fix-Trans Steel Fix COF-Long Steel Fix COF-Trans Steel Rocker COFLong Steel Rocker COFTrans Abt-Pas Stf Pile Stf Fnd-Rot Stf Fnd-Tran-Stf Mass Damp Ratio Large Gap Load Dir
Modeling Sample 4 5 3605 2787 55665 54468 385.8 373.9 22.5 25.0 0.223 0.240 0.396 0.402 0.044 0.035
1 6085 58724 473.4 25.0 0.186 0.301 0.047
2 4950 42885 544.4 29.2 0.240 0.375 0.036
3 4385 50579 480.5 22.3 0.192 0.428 0.048
0.107
0.092
0.083
0.117
39.0 46.3 1281 234 122 0.047 4.11 65
21.9 23.8 1170 430 113 0.041 4.94 101
44.2 48.6 891 371 119 0.075 2.84 142
49.2 44.1 1338 214 127 0.056 5.36 217
307
6 4646 63982 420.6 22.5 0.181 0.408 0.041
7 5302 57947 400.0 29.1 0.217 0.389 0.045
8 3951 52657 372.6 30.9 0.226 0.345 0.042
0.100
0.105
0.088
0.101
34.6 33.3 728 404 117 0.035 1.60 274
31.0 48.4 497 269 134 0.026 3.54 40
24.4 34.2 978 321 131 0.038 1.04 326
35.9 51.3 652 148 116 0.052 2.17 237
Table E.4: MCSTEEL modeling parameters for geometric sample 4 Parameter Conc Str Reinf Str Steel Fix-Long Steel Fix-Trans Steel Fix COF-Long Steel Fix COF-Trans Steel Rocker COFLong Steel Rocker COFTrans Abt-Pas Stf Pile Stf Fnd-Rot Stf Fnd-Tran-Stf Mass Damp Ratio Large Gap Load Dir
Modeling Sample 4 5 4550 4827 59076 62232 381.7 434.4 24.9 21.2 0.187 0.219 0.388 0.322 0.033 0.040
1 4173 55544 397.5 23.4 0.243 0.376 0.038
2 5719 51683 436.7 26.0 0.194 0.410 0.036
3 2789 57408 473.9 23.4 0.196 0.300 0.047
0.106
0.106
0.105
0.110
29.3 51.1 1341 320 134 0.029 4.92 109
39.1 20.6 630 282 113 0.056 1.80 318
46.3 47.3 1101 399 127 0.034 5.46 276
21.6 35.5 738 215 130 0.044 0.99 82
6 5175 50159 493.3 21.3 0.236 0.373 0.033
7 4268 54172 525.2 20.3 0.197 0.428 0.047
8 3628 45434 515.7 26.2 0.246 0.434 0.041
0.111
0.099
0.087
0.096
27.1 32.4 963 242 122 0.051 3.59 172
35.3 21.1 529 156 115 0.039 3.69 214
44.0 54.6 927 337 120 0.048 4.29 236
31.7 21.4 1254 445 138 0.063 2.35 36
Table E.5: MCSTEEL modeling parameters for geometric sample 5 Parameter Conc Str Reinf Str Steel Fix-Long Steel Fix-Trans Steel Fix COF-Long Steel Fix COF-Trans Steel Rocker COFLong Steel Rocker COFTrans Abt-Pas Stf Pile Stf Fnd-Rot Stf Fnd-Tran-Stf Mass Damp Ratio Large Gap Load Dir
1 4494 49105 399.4 25.7 0.231 0.405 0.047
2 4551 51031 408.2 23.9 0.195 0.391 0.032
3 3865 54780 542.2 25.3 0.199 0.316 0.043
Modeling Sample 4 5 5397 5014 56438 55141 470.3 401.8 23.5 22.9 0.220 0.239 0.297 0.442 0.036 0.038
6 2998 58696 499.8 23.3 0.244 0.383 0.037
7 6142 53035 471.8 30.5 0.227 0.396 0.033
8 4144 63777 523.6 25.9 0.247 0.332 0.047
0.095
0.115
0.096
0.090
0.103
0.085
0.081
0.090
21.2 43.5 889 167 116 0.053 2.74 244
46.1 31.4 666 436 129 0.022 1.09 118
34.3 50.7 1361 308 137 0.033 5.65 35
42.3 56.2 1220 238 123 0.063 4.77 279
24.2 46.3 713 400 119 0.039 3.36 218
46.9 59.6 1052 184 134 0.056 3.14 158
30.8 55.0 1087 338 114 0.043 2.18 89
37.2 26.0 520 273 126 0.049 4.15 352
308
Table E.6: MCSTEEL modeling parameters for geometric sample 6 Parameter Conc Str Reinf Str Steel Fix-Long Steel Fix-Trans Steel Fix COF-Long Steel Fix COF-Trans Steel Rocker COFLong Steel Rocker COFTrans Abt-Pas Stf Pile Stf Fnd-Rot Stf Fnd-Tran-Stf Mass Damp Ratio Large Gap Load Dir
1 4527 54110 419.6 25.8 0.213 0.323 0.047
2 4916 63060 418.4 30.7 0.239 0.428 0.046
3 4293 43998 424.8 22.6 0.235 0.359 0.044
Modeling Sample 4 5 3490 6065 52908 54963 516.5 519.3 30.5 24.6 0.174 0.210 0.406 0.299 0.035 0.037
6 4039 58129 510.7 23.6 0.233 0.324 0.047
7 3881 50949 556.8 28.3 0.182 0.397 0.046
8 5201 58663 533.1 22.6 0.244 0.372 0.041
0.087
0.088
0.106
0.109
0.118
0.102
0.091
0.095
21.2 20.2 950 229 117 0.049 3.23 65
38.5 51.9 824 421 125 0.062 5.10 307
31.1 37.8 695 209 111 0.014 3.78 241
26.4 38.5 589 356 121 0.059 1.22 92
34.7 44.1 1391 319 130 0.047 1.37 201
42.9 41.4 943 402 138 0.041 1.92 338
46.8 37.6 1223 265 135 0.034 5.53 144
41.0 35.1 1120 142 126 0.042 2.30 41
Table E.7: MCSTEEL modeling parameters for geometric sample 7 Parameter Conc Str Reinf Str Steel Fix-Long Steel Fix-Trans Steel Fix COF-Long Steel Fix COF-Trans Steel Rocker COFLong Steel Rocker COFTrans Abt-Pas Stf Pile Stf Fnd-Rot Stf Fnd-Tran-Stf Mass Damp Ratio Large Gap Load Dir
1 4698 63370 527.9 29.3 0.249 0.359 0.041
2 5747 52091 486.2 29.9 0.209 0.305 0.039
3 3306 56488 512.4 29.6 0.171 0.409 0.037
Modeling Sample 4 5 4222 5254 49499 42456 545.3 429.5 24.9 26.7 0.249 0.169 0.443 0.302 0.042 0.033
6 4277 53414 455.4 24.8 0.232 0.371 0.047
7 3837 58448 386.2 25.5 0.168 0.399 0.041
8 5058 55088 387.4 25.5 0.219 0.406 0.034
0.096
0.099
0.114
0.108
0.087
0.119
0.089
0.096
30.4 44.4 781 148 113 0.037 2.15 329
36.3 32.5 604 419 123 0.047 4.16 131
21.6 26.5 1033 300 136 0.024 3.32 6
41.4 57.3 1073 282 117 0.042 5.41 228
47.7 46.5 1311 384 118 0.057 2.44 311
24.8 34.2 1252 213 134 0.034 2.60 142
45.2 58.2 871 351 127 0.064 4.56 49
33.5 23.1 523 231 132 0.051 0.83 224
309
Table E.8: MCSTEEL modeling parameters for geometric sample 8 Parameter Conc Str Reinf Str Steel Fix-Long Steel Fix-Trans Steel Fix COF-Long Steel Fix COF-Trans Steel Rocker COFLong Steel Rocker COFTrans Abt-Pas Stf Pile Stf Fnd-Rot Stf Fnd-Tran-Stf Mass Damp Ratio Large Gap Load Dir
1 3239 49767 419.0 29.0 0.215 0.311 0.034
2 5196 47536 459.7 26.2 0.172 0.322 0.041
3 4455 58693 511.8 22.2 0.229 0.374 0.040
Modeling Sample 4 5 3733 5699 61042 51875 395.8 469.9 22.1 22.9 0.219 0.245 0.315 0.415 0.044 0.044
6 4225 54584 387.3 25.7 0.202 0.304 0.038
7 4924 57794 454.0 26.5 0.215 0.414 0.035
8 4530 56106 446.0 27.1 0.246 0.334 0.035
0.112
0.085
0.111
0.111
0.116
0.098
0.094
0.117
31.0 39.8 751 447 117 0.057 5.46 314
33.7 58.5 1111 372 131 0.047 4.25 5
43.2 20.7 1024 172 119 0.070 3.55 234
41.1 59.6 591 253 133 0.045 2.62 120
35.1 31.4 1402 285 124 0.053 3.00 150
25.2 31.5 858 182 128 0.020 1.85 77
22.5 24.8 1280 394 138 0.040 4.63 318
46.5 20.8 539 327 113 0.035 2.80 212
Table E.9: MSSTEEL modeling parameters for geometric sample 1 Parameter Conc Str Reinf Str Steel Fix-Long Steel Fix-Trans Steel Fix COF-Long Steel Fix COF-Trans Steel Rocker COF-Long Steel Rocker COF-Trans Abt-Pas Stf Pile Stf Fnd-Rot Stf Fnd-Tran-Stf Mass Damp Ratio Small Gap Large Gap Load Dir
1 4528 60568 462 29 0.251 0.415 0.038 0.080 40.4 20.9 508 200 135 0.050 1.05 1.56 94
2 5820 45085 491 31 0.225 0.360 0.032 0.081 23.0 67.6 759 317 135 0.020 0.72 1.26 313
3 4225 57684 487 25 0.244 0.346 0.040 0.110 34.8 27.0 1343 378 123 0.057 1.01 1.59 145
310
Modeling Sample 4 5 4333 3847 53239 49924 414 540 28 23 0.208 0.188 0.436 0.395 0.042 0.042 0.103 0.118 20.9 44.2 48.0 57.4 1077 984 361 293 112 126 0.050 0.050 1.24 1.14 1.60 1.92 325 281
6 3172 56127 484 25 0.208 0.395 0.040 0.106 49.4 44.5 841 445 115 0.052 0.73 1.31 207
7 4849 53439 388 28 0.237 0.352 0.043 0.105 35.6 38.3 653 232 129 0.048 0.79 1.28 234
8 5213 66973 416 31 0.206 0.382 0.046 0.106 49.2 70.0 1282 147 118 0.056 0.79 1.13 247
Table E.10: MSSTEEL modeling parameters for geometric sample 2 Parameter Conc Str Reinf Str Steel Fix-Long Steel Fix-Trans Steel Fix COF-Long Steel Fix COF-Trans Steel Rocker COF-Long Steel Rocker COF-Trans Abt-Pas Stf Pile Stf Fnd-Rot Stf Fnd-Tran-Stf Mass Damp Ratio Small Gap Large Gap Load Dir
1 3547 52335 453 30 0.171 0.305 0.041 0.098 31.9 63.3 836 191 139 0.036 1.06 1.43 288
2 5490 58206 442 31 0.179 0.298 0.039 0.087 27.9 33.8 1193 368 118 0.033 0.88 1.53 209
3 5063 45535 481 30 0.243 0.437 0.043 0.090 43.4 25.8 1124 328 113 0.037 1.18 1.20 27
Modeling Sample 4 5 4086 2701 64328 53743 403 554 29 20 0.244 0.242 0.358 0.322 0.039 0.044 0.107 0.088 42.3 37.3 33.0 55.0 538 671 142 392 120 120 0.057 0.033 1.01 0.90 1.11 1.51 340 140
6 5362 57475 504 24 0.173 0.324 0.039 0.111 41.4 44.2 1410 442 118 0.058 1.11 1.69 22
7 4544 54803 420 29 0.229 0.324 0.037 0.103 22.9 48.5 974 221 139 0.053 0.90 1.16 263
8 4281 51441 457 24 0.204 0.333 0.038 0.099 39.5 69.4 811 262 117 0.044 1.22 1.83 66
7 5302 57947 521 23 0.181 0.359 0.043 0.102 44.5 71.6 978 321 117 0.046 0.89 1.00 233
8 3951 52657 551 27 0.237 0.339 0.044 0.106 44.0 29.5 652 148 130 0.056 0.75 1.80 133
Table E.11: MSSTEEL modeling parameters for geometric sample 3 Parameter Conc Str Reinf Str Steel Fix-Long Steel Fix-Trans Steel Fix COF-Long Steel Fix COF-Trans Steel Rocker COF-Long Steel Rocker COF-Trans Abt-Pas Stf Pile Stf Fnd-Rot Stf Fnd-Tran-Stf Mass Damp Ratio Small Gap Large Gap Load Dir
1 6085 58724 455 21 0.242 0.355 0.034 0.097 31.0 43.5 1281 234 132 0.064 0.83 1.27 155
2 4950 42885 523 22 0.229 0.442 0.037 0.109 30.1 26.3 1170 430 128 0.053 1.18 1.95 198
3 4385 50579 410 29 0.196 0.432 0.043 0.117 41.5 63.6 891 371 128 0.068 1.19 1.64 86
311
Modeling Sample 4 5 3605 2787 55665 54468 414 453 28 21 0.219 0.170 0.441 0.315 0.045 0.039 0.102 0.108 35.0 25.5 60.9 50.5 1338 728 214 404 126 113 0.049 0.054 1.03 1.20 1.52 1.97 177 87
6 4646 63982 413 29 0.225 0.351 0.046 0.094 35.0 35.7 497 269 123 0.043 1.14 1.09 85
Table E.12: MSSTEEL modeling parameters for geometric sample 4 Parameter Conc Str Reinf Str Steel Fix-Long Steel Fix-Trans Steel Fix COF-Long Steel Fix COF-Trans Steel Rocker COF-Long Steel Rocker COF-Trans Abt-Pas Stf Pile Stf Fnd-Rot Stf Fnd-Tran-Stf Mass Damp Ratio Small Gap Large Gap Load Dir
1 4173 55544 429 30 0.245 0.374 0.047 0.098 49.6 67.5 1341 320 120 0.045 1.01 1.75 328
2 5719 51683 471 31 0.177 0.321 0.035 0.099 40.4 59.8 630 282 111 0.044 0.91 1.27 52
3 2789 57408 428 31 0.227 0.304 0.042 0.091 47.1 45.8 1101 399 124 0.032 0.81 1.80 44
Modeling Sample 4 5 4550 4827 59076 62232 453 392 24 29 0.220 0.209 0.341 0.444 0.043 0.033 0.097 0.089 34.4 27.2 25.3 35.8 738 963 215 242 130 128 0.040 0.037 1.06 0.92 1.84 1.20 176 145
6 5175 50159 394 29 0.172 0.364 0.040 0.106 34.1 49.2 529 156 126 0.049 0.96 1.40 127
7 4268 54172 377 28 0.223 0.367 0.043 0.115 44.5 71.2 927 337 130 0.067 1.24 1.28 162
8 3628 45434 473 23 0.175 0.387 0.043 0.102 33.6 29.9 1254 445 135 0.047 0.98 1.92 225
Table E.13: MSSTEEL modeling parameters for geometric sample 5 Parameter Conc Str Reinf Str Steel Fix-Long Steel Fix-Trans Steel Fix COF-Long Steel Fix COF-Trans Steel Rocker COF-Long Steel Rocker COF-Trans Abt-Pas Stf Pile Stf Fnd-Rot Stf Fnd-Tran-Stf Mass Damp Ratio Small Gap Large Gap Load Dir
1 4494 49105 466 27 0.235 0.358 0.046 0.111 21.1 68.3 889 167 128 0.065 1.29 1.90 65
2 4551 51031 437 31 0.223 0.312 0.035 0.086 24.1 63.8 666 436 123 0.031 0.75 1.25 307
3 3865 54780 459 27 0.185 0.405 0.033 0.111 46.7 33.3 1361 308 131 0.047 0.77 1.50 66
312
Modeling Sample 4 5 5397 5014 56438 55141 430 420 27 28 0.240 0.182 0.400 0.321 0.047 0.036 0.106 0.085 47.1 46.6 58.7 53.2 1220 713 238 400 122 133 0.055 0.037 1.16 1.20 1.92 1.11 122 35
6 2998 58696 427 22 0.174 0.441 0.047 0.097 21.8 45.9 1052 184 124 0.042 0.93 1.30 296
7 6142 53035 544 27 0.212 0.314 0.033 0.091 41.7 26.5 1087 338 119 0.037 0.85 1.55 197
8 4144 63777 469 29 0.179 0.335 0.032 0.106 33.0 34.4 520 273 120 0.049 0.72 1.14 281
Table E.14: MSSTEEL modeling parameters for geometric sample 6 Parameter Conc Str Reinf Str Steel Fix-Long Steel Fix-Trans Steel Fix COF-Long Steel Fix COF-Trans Steel Rocker COF-Long Steel Rocker COF-Trans Abt-Pas Stf Pile Stf Fnd-Rot Stf Fnd-Tran-Stf Mass Damp Ratio Small Gap Large Gap Load Dir
1 4527 54110 467 21 0.176 0.393 0.045 0.093 46.6 31.4 950 229 113 0.040 0.99 1.73 95
2 4916 63060 546 25 0.210 0.351 0.039 0.094 41.6 24.9 824 421 119 0.037 1.01 1.93 224
3 4293 43998 415 20 0.171 0.336 0.033 0.088 30.0 68.9 695 209 131 0.026 1.19 1.65 86
Modeling Sample 4 5 3490 6065 52908 54963 543 448 22 24 0.236 0.250 0.395 0.301 0.041 0.034 0.106 0.104 38.3 20.9 52.9 46.6 589 1391 356 319 135 123 0.055 0.047 1.21 0.81 1.50 1.30 324 48
6 4039 58129 431 26 0.212 0.319 0.042 0.114 40.5 57.7 943 402 136 0.048 1.29 1.31 6
7 3881 50949 507 22 0.250 0.383 0.036 0.093 24.5 61.9 1223 265 130 0.036 0.89 1.87 107
8 5201 58663 415 23 0.183 0.418 0.042 0.102 44.8 37.9 1120 142 133 0.046 1.15 1.50 29
Table E.15: MSSTEEL modeling parameters for geometric sample 7 Parameter Conc Str Reinf Str Steel Fix-Long Steel Fix-Trans Steel Fix COF-Long Steel Fix COF-Trans Steel Rocker COF-Long Steel Rocker COF-Trans Abt-Pas Stf Pile Stf Fnd-Rot Stf Fnd-Tran-Stf Mass Damp Ratio Small Gap Large Gap Load Dir
1 4698 63370 524 23 0.190 0.389 0.036 0.111 47.4 67.1 781 148 137 0.052 1.12 1.41 52
2 5747 52091 534 29 0.233 0.325 0.034 0.104 23.2 22.1 604 419 115 0.048 0.92 1.07 126
3 3306 56488 529 30 0.231 0.359 0.037 0.091 41.0 53.5 1033 300 129 0.036 1.08 1.80 150
313
Modeling Sample 4 5 4222 5254 49499 42456 452 482 28 31 0.216 0.228 0.376 0.379 0.037 0.036 0.107 0.098 38.5 34.7 68.5 55.2 1073 1311 282 384 132 113 0.047 0.041 0.93 0.78 1.28 1.40 133 339
6 4277 53414 451 25 0.176 0.423 0.047 0.113 21.3 30.2 1252 213 126 0.050 0.94 1.11 15
7 3837 58448 463 21 0.223 0.329 0.036 0.085 39.8 42.8 871 351 131 0.023 0.95 1.04 268
8 5058 55088 463 26 0.201 0.441 0.038 0.109 22.5 33.9 523 231 130 0.050 1.12 1.40 335
Table E.16: MSSTEEL modeling parameters for geometric sample 8 Parameter Conc Str Reinf Str Steel Fix-Long Steel Fix-Trans Steel Fix COF-Long Steel Fix COF-Trans Steel Rocker COF-Long Steel Rocker COF-Trans Abt-Pas Stf Pile Stf Fnd-Rot Stf Fnd-Tran-Stf Mass Damp Ratio Small Gap Large Gap Load Dir
1 3239 49767 519 26 0.196 0.339 0.042 0.099 43.9 51.1 751 447 136 0.044 0.95 1.94 49
2 5196 47536 474 22 0.228 0.368 0.042 0.088 39.6 68.2 1111 372 115 0.033 1.14 1.30 185
3 4455 58693 408 31 0.210 0.377 0.040 0.084 25.9 30.4 1024 172 111 0.038 0.71 1.23 18
Modeling Sample 4 5 3733 5699 61042 51875 406 420 20 20 0.183 0.210 0.399 0.427 0.034 0.039 0.105 0.098 45.8 25.0 37.2 21.6 591 1402 253 285 139 118 0.052 0.043 0.75 1.23 1.65 1.42 40 344
6 4225 54584 466 27 0.237 0.391 0.036 0.090 22.1 44.8 858 182 138 0.037 0.96 1.59 61
7 4924 57794 479 26 0.235 0.353 0.043 0.118 35.6 58.1 1280 394 112 0.056 1.12 1.90 68
8 4530 56106 488 28 0.238 0.404 0.047 0.101 24.0 67.2 539 327 110 0.046 0.83 1.17 279
Table E.17: MSRC modeling parameters for geometric sample 1 Parameter Conc Str Reinf Str COF MF Dowel Str Abt-Pas Stf Pile Stf Mass Damp Ratio Small Gap Load Dir
1 5580 63265 0.96 6.30 21.2 23.5 130 0.033 1.62 203
2 3958 56497 1.07 6.89 44.8 42.1 135 0.063 1.98 70
3 5032 53575 0.88 6.42 37.4 35.7 117 0.029 1.05 160
Modeling Sample 4 5 5103 4598 54845 47029 1.13 0.98 6.74 7.48 23.8 31.1 55.0 62.0 138 121 0.040 0.047 0.80 0.32 346 22
314
6 3470 60568 1.00 7.77 46.7 31.5 125 0.058 0.71 112
7 3830 51862 1.07 7.32 31.6 70.2 110 0.042 1.34 278
8 4354 49629 0.92 7.04 39.5 53.0 125 0.052 0.12 234
Table E.18: MSRC modeling parameters for geometric sample 2 Parameter Conc Str Reinf Str COF MF Dowel Str Abt-Pas Stf Pile Stf Mass Damp Ratio Small Gap Load Dir
1 4723 48304 1.15 7.81 47.1 33.0 130 0.053 0.73 111
2 5908 60077 0.89 6.38 23.1 53.4 137 0.071 0.84 13
3 5131 55571 0.88 6.71 39.3 42.8 115 0.046 1.83 66
Modeling Sample 4 5 3991 4484 50954 51681 1.01 0.96 7.17 7.56 23.8 44.3 57.8 25.6 118 113 0.030 0.043 1.32 0.28 180 170
6 3785 60952 1.08 7.06 27.9 64.7 122 0.056 1.50 265
7 3172 54703 1.04 5.81 36.5 39.6 135 0.032 1.06 310
8 4941 56799 1.00 6.94 34.4 74.6 128 0.039 0.10 357
Table E.19: MSRC modeling parameters for geometric sample 3 Parameter Conc Str Reinf Str COF MF Dowel Str Abt-Pas Stf Pile Stf Mass Damp Ratio Small Gap Load Dir
1 4620 61825 0.93 7.62 21.7 39.5 137 0.043 1.83 10
2 3070 57218 0.92 6.97 45.1 28.5 125 0.038 0.88 130
3 4220 50552 1.10 7.13 49.4 55.3 115 0.036 0.45 257
Modeling Sample 4 5 4335 3799 48025 56154 1.07 0.87 6.49 6.64 36.4 27.5 52.0 42.8 128 121 0.049 0.058 1.48 1.54 169 291
6 5453 52469 1.00 7.30 41.9 66.1 111 0.068 0.71 356
7 5813 53481 1.17 8.17 26.5 23.2 135 0.046 0.21 72
8 5010 58431 1.01 6.34 33.5 69.3 130 0.026 1.08 220
Table E.20: MSRC modeling parameters for geometric sample 4 Parameter Conc Str Reinf Str COF MF Dowel Str Abt-Pas Stf Pile Stf Mass Damp Ratio Small Gap Load Dir
1 3989 58601 1.12 7.65 42.2 33.4 125 0.032 0.88 75
2 5160 55434 0.83 7.32 31.3 72.6 132 0.051 0.16 228
3 3457 54113 1.10 6.89 25.1 35.6 121 0.047 1.55 354
Modeling Sample 4 5 3736 4681 52846 46407 1.01 0.99 6.47 6.33 22.9 29.7 21.4 64.4 127 136 0.038 0.060 1.05 1.83 192 106
315
6 5765 51170 1.06 6.78 49.5 42.8 110 0.044 1.47 278
7 4393 67862 0.91 7.10 37.7 48.2 117 0.054 0.49 27
8 4941 56748 0.95 8.38 45.3 60.9 140 0.022 0.61 146
Table E.21: MSRC modeling parameters for geometric sample 5 Parameter Conc Str Reinf Str COF MF Dowel Str Abt-Pas Stf Pile Stf Mass Damp Ratio Small Gap Load Dir
1 2413 58882 1.01 6.21 23.9 34.4 119 0.058 1.34 326
2 4620 52927 1.08 7.57 43.4 48.1 112 0.047 0.61 131
3 4848 62009 1.04 6.85 31.2 57.2 117 0.050 1.64 195
Modeling Sample 4 5 4061 4493 49260 50820 0.79 0.99 6.65 6.53 39.9 47.4 45.2 62.3 123 136 0.043 0.041 1.93 1.12 247 82
6 5275 56921 0.92 7.10 21.3 23.8 130 0.034 0.81 273
7 5690 53356 0.94 7.90 36.7 68.8 127 0.067 0.31 153
8 3738 55072 1.16 7.30 34.2 33.5 140 0.027 0.11 25
Table E.22: MSRC modeling parameters for geometric sample 6 Parameter Conc Str Reinf Str COF MF Dowel Str Abt-Pas Stf Pile Stf Mass Damp Ratio Small Gap Load Dir
1 4032 47417 0.96 6.23 41.7 24.6 126 0.039 0.96 279
2 5282 56887 0.99 7.14 36.7 55.7 130 0.054 1.05 84
3 3666 58767 1.11 7.31 28.4 47.5 117 0.033 1.34 23
Modeling Sample 4 5 6073 4497 52203 61690 1.04 0.91 7.65 6.39 26.2 48.3 27.0 67.3 123 138 0.044 0.049 0.32 0.05 123 253
6 4625 54214 1.22 7.41 43.9 45.9 110 0.061 0.73 195
7 3361 55427 1.03 6.78 20.3 40.5 133 0.026 1.76 172
8 4786 51382 0.86 6.88 34.4 70.8 118 0.046 1.63 347
Table E.23: MSRC modeling parameters for geometric sample 7 Parameter Conc Str Reinf Str COF MF Dowel Str Abt-Pas Stf Pile Stf Mass Damp Ratio Small Gap Load Dir
1 3961 55734 1.04 6.32 48.1 24.9 119 0.034 0.71 274
2 3713 57021 0.85 7.52 41.8 53.1 124 0.041 1.29 135
3 4611 65656 0.90 7.33 29.6 34.3 131 0.041 1.55 106
Modeling Sample 4 5 4812 5460 60106 51421 0.99 1.21 7.72 7.02 26.9 32.2 60.8 43.5 126 113 0.052 0.069 1.93 0.19 265 88
316
6 5539 48480 1.10 6.59 37.4 63.7 139 0.030 0.42 332
7 4391 52000 0.95 6.83 20.2 29.3 134 0.057 0.79 19
8 3503 54427 1.01 6.76 46.2 69.1 116 0.048 1.04 182
Table E.24: MSRC modeling parameters for geometric sample 8 Parameter Conc Str Reinf Str COF MF Dowel Str Abt-Pas Stf Pile Stf Mass Damp Ratio Small Gap Load Dir
1 4694 54033 0.76 6.93 24.6 61.2 129 0.050 1.13 121
2 3018 56942 1.03 7.02 29.4 33.7 139 0.034 1.38 5
3 3958 51790 1.25 5.84 22.2 40.0 128 0.045 1.88 259
Modeling Sample 4 5 3568 4299 59186 51066 1.10 0.96 6.76 7.22 47.7 35.5 52.6 68.0 111 115 0.039 0.027 0.44 0.23 76 342
6 5354 60762 0.99 7.41 32.5 72.1 136 0.064 0.73 283
7 4859 56297 0.92 6.38 40.5 45.2 118 0.044 0.78 219
8 6313 48469 1.04 7.70 45.1 23.2 123 0.054 1.69 141
Table E.25: SSPC modeling parameters for geometric sample 1 Parameter Conc Str Reinf Str Elasto Shear Mod Elasto MF Dowel Str Dowel Gap Abt-Pas Stf Pile Stf Mass Damp Ratio Large Gap Load Dir
1 3894 59779 187
2 3937 55321 258
3 4334 51054 237
Modeling Sample 4 5 5401 3278 57668 48356 145 105
6 4531 51937 148
7 4904 62575 288
8 5767 53885 208
1.12 19.64 0.180 42.5 58.1 115 0.060 4.11 278
0.85 22.76 1.936 49.2 21.5 112 0.044 3.12 30
1.16 19.98 1.150 20.7 28.1 124 0.045 0.83 69
1.02 18.19 2.427 26.1 43.2 129 0.017 5.30 105
1.00 21.46 0.934 30.8 48.3 133 0.038 1.68 219
1.06 20.75 2.336 39.6 66.4 120 0.053 0.05 269
0.94 18.38 0.537 37.0 74.5 137 0.059 2.39 174
0.92 19.19 1.505 33.3 38.1 128 0.036 4.91 333
Table E.26: SSPC modeling parameters for geometric sample 2 Parameter Conc Str Reinf Str Elasto Shear Mod Elasto MF Dowel Str Dowel Gap Abt-Pas Stf Pile Stf Mass Damp Ratio Large Gap Load Dir
1 4560 52046 142
2 4055 54624 117
3 4351 55522 183
Modeling Sample 4 5 3347 4901 49848 61229 157 257
6 3526 48284 292
7 5819 57636 239
8 5184 60290 215
1.00 22.88 1.248 26.9 52.7 137 0.045 5.68 315
1.12 19.79 1.901 38.0 70.5 116 0.033 3.88 183
0.87 21.21 0.171 21.1 24.4 129 0.041 0.29 290
0.92 21.03 1.406 42.7 64.8 125 0.027 2.10 139
1.03 18.45 2.290 46.7 45.2 124 0.050 0.76 235
1.13 17.48 0.490 30.4 38.8 136 0.066 2.89 19
0.96 19.16 0.864 39.9 28.5 118 0.054 4.61 126
317
1.04 20.42 2.679 32.6 58.5 112 0.037 3.14 61
Table E.27: SSPC modeling parameters for geometric sample 3 Parameter Conc Str Reinf Str Elasto Shear Mod Elasto MF Dowel Str Dowel Gap Abt-Pas Stf Pile Stf Mass Damp Ratio Large Gap Load Dir
1 3752 52450 111
2 4483 46517 141
3 5015 57945 160
Modeling Sample 4 5 4678 5542 61079 55508 232 202
6 4217 54775 174
7 3309 60179 297
8 5200 51105 257
0.90 21.23 0.511 29.4 65.5 138 0.055 1.64 13
0.97 18.19 2.464 47.3 28.5 123 0.039 3.49 300
0.86 17.83 1.064 35.9 41.2 134 0.066 0.38 254
1.02 18.91 2.158 45.2 49.6 119 0.041 1.41 198
1.05 19.49 0.929 27.3 39.8 128 0.031 4.86 168
1.11 20.21 1.825 33.4 70.6 111 0.049 2.73 92
0.96 22.71 0.041 21.1 24.2 130 0.051 5.35 57
1.15 20.82 1.587 41.8 54.6 115 0.027 4.07 319
Table E.28: SSPC modeling parameters for geometric sample 4 Parameter Conc Str Reinf Str Elasto Shear Mod Elasto MF Dowel Str Dowel Gap Abt-Pas Stf Pile Stf Mass Damp Ratio Large Gap Load Dir
1 5413 63053 232
2 4295 52270 250
3 3084 55486 293
Modeling Sample 4 5 3786 5565 50589 54348 133 200
6 4760 56559 194
7 5042 58299 101
8 3944 45967 170
1.09 20.13 1.714 22.0 26.6 128 0.053 4.60 111
1.25 21.25 0.902 48.7 68.6 113 0.056 1.27 233
0.95 18.41 2.349 45.0 47.2 137 0.028 1.94 156
0.84 20.82 1.189 38.4 37.4 130 0.046 5.39 78
0.93 19.66 2.049 26.6 50.7 114 0.043 0.43 307
0.99 23.51 0.367 33.2 54.4 134 0.070 2.93 29
1.03 19.14 2.416 28.6 61.9 120 0.040 3.25 216
318
1.03 17.61 0.309 41.0 31.1 123 0.032 4.22 344
Table E.29: SSPC modeling parameters for geometric sample 5 Parameter Conc Str Reinf Str Elasto Shear Mod Elasto MF Dowel Str Dowel Gap Abt-Pas Stf Pile Stf Mass Damp Ratio Large Gap Load Dir
1 4146 47748 251
2 3825 52731 138
3 5338 75355 105
Modeling Sample 4 5 5065 4252 55429 54521 277 160
6 5662 51234 207
7 4706 57870 237
8 3198 59266 195
1.13 21.51 2.119 22.9 42.1 121 0.044 1.24 321
0.98 19.67 2.749 33.8 64.4 127 0.048 0.59 15
0.82 19.06 1.842 44.9 60.6 134 0.020 5.80 212
1.10 18.30 0.755 37.9 68.9 137 0.041 3.68 240
1.01 20.11 1.697 28.5 23.7 117 0.051 2.76 140
0.94 21.88 0.253 27.5 31.5 114 0.055 4.05 95
0.92 20.99 1.340 48.7 35.4 125 0.065 2.13 300
1.06 17.86 0.603 40.0 52.6 130 0.035 5.14 61
Table E.30: SSPC modeling parameters for geometric sample 6 Parameter Conc Str Reinf Str Elasto Shear Mod Elasto MF Dowel Str Dowel Gap Abt-Pas Stf Pile Stf Mass Damp Ratio Large Gap Load Dir
1 3475 56827 279
2 5266 61464 232
3 3825 54872 188
Modeling Sample 4 5 4659 4937 60530 51947 154 264
6 3969 47938 120
7 5648 54358 132
8 4496 51513 216
0.93 17.95 1.891 21.5 67.7 123 0.024 2.34 89
0.97 21.42 0.707 49.7 56.6 136 0.042 3.82 247
1.09 22.74 2.650 30.5 36.9 139 0.034 5.04 103
0.87 18.50 0.558 24.6 23.3 132 0.052 0.65 284
1.04 19.88 0.012 35.6 48.5 126 0.046 2.01 193
0.98 20.03 1.226 45.7 41.8 119 0.037 1.10 3
1.02 20.54 1.690 32.4 33.6 114 0.083 3.13 360
319
1.21 19.01 2.367 41.2 73.2 112 0.054 6.00 140
Table E.31: SSPC modeling parameters for geometric sample 7 Parameter Conc Str Reinf Str Elasto Shear Mod Elasto MF Dowel Str Dowel Gap Abt-Pas Stf Pile Stf Mass Damp Ratio Large Gap Load Dir
1 5752 46900 151
2 4419 70603 276
3 4841 54438 186
Modeling Sample 4 5 3023 4516 58345 56746 132 198
6 5260 52398 111
7 3739 51470 269
8 3995 56032 227
1.08 19.43 2.000 21.3 51.0 115 0.034 0.16 338
1.00 20.86 0.665 45.4 57.7 132 0.040 5.37 170
0.92 20.16 2.196 31.3 34.9 111 0.057 3.23 233
0.96 19.50 1.478 49.7 44.7 121 0.030 5.19 292
1.16 21.96 2.717 35.1 20.3 133 0.042 2.90 119
0.82 18.07 0.138 29.4 65.8 126 0.064 4.07 53
1.02 18.33 1.096 25.2 32.8 124 0.050 1.07 219
1.06 21.81 0.993 41.0 72.2 138 0.048 1.65 40
Table E.32: SSPC modeling parameters for geometric sample 8 Parameter Conc Str Reinf Str Elasto Shear Mod Elasto MF Dowel Str Dowel Gap Abt-Pas Stf Pile Stf Mass Damp Ratio Large Gap Load Dir
1 4635 67937 222
2 3916 56886 132
3 4122 52075 235
Modeling Sample 4 5 4405 5348 55018 53940 284 259
6 4988 45614 161
7 2925 60526 194
8 6313 50057 102
1.08 18.93 1.622 23.1 64.3 123 0.010 1.18 216
0.90 21.22 0.942 46.7 28.6 120 0.067 5.94 347
1.26 19.65 0.156 33.0 44.0 129 0.037 2.17 167
0.87 19.95 1.189 35.1 60.4 126 0.053 0.02 296
1.00 20.47 1.764 42.7 34.3 136 0.045 4.89 93
0.97 22.29 2.136 40.2 22.8 110 0.054 2.52 7
1.05 18.65 0.354 28.3 71.3 138 0.044 4.34 257
0.94 16.97 2.479 26.4 52.5 115 0.037 3.32 68
Table E.33: MCRC-slab modeling parameters for geometric sample 1 Parameter Conc Str Reinf Str COF MF Dowel Str Abt-Pas Stf Pile Stf Mass Damp Ratio Small Gap Load Dir
1 5533 52786 1.01 6.80 23.5 44.5 112 0.045 0.48 308
2 4871 50560 0.97 7.30 44.8 35.4 137 0.032 1.45 192
3 3382 54011 1.04 7.06 31.2 68.1 133 0.057 1.10 122
Modeling Sample 4 5 3846 4353 55556 44698 1.00 1.29 6.83 7.63 47.8 32.9 52.6 20.8 119 129 0.053 0.047 0.93 1.81 165 90
320
6 4663 56812 1.11 7.69 42.5 33.4 125 0.024 1.67 245
7 5158 61025 0.92 6.32 36.5 65.8 123 0.038 0.06 340
8 4116 58578 0.89 6.41 26.1 56.2 116 0.062 0.69 38
Table E.34: MCRC-slab modeling parameters for geometric sample 2 Parameter Conc Str Reinf Str COF MF Dowel Str Abt-Pas Stf Pile Stf Mass Damp Ratio Small Gap Load Dir
1 5444 56470 1.03 6.63 44.6 39.6 132 0.049 0.53 103
2 2633 50435 1.00 7.43 39.3 71.4 135 0.045 1.79 285
3 3568 62754 0.94 6.88 32.5 33.7 122 0.034 1.53 219
Modeling Sample 4 5 5600 4093 52909 54856 0.91 1.07 6.98 5.94 36.9 29.9 24.0 66.6 111 120 0.067 0.019 1.48 0.82 36 49
6 4829 59628 0.88 7.17 24.9 56.7 140 0.037 0.46 140
7 4533 47971 1.21 7.80 49.6 50.9 127 0.046 0.04 253
8 4320 53515 1.10 6.53 23.6 43.4 117 0.055 1.07 349
Table E.35: MCRC-slab modeling parameters for geometric sample 3 Parameter Conc Str Reinf Str COF MF Dowel Str Abt-Pas Stf Pile Stf Mass Damp Ratio Small Gap Load Dir
1 5493 61067 1.10 6.96 47.3 71.9 121 0.051 1.51 282
2 5223 50070 0.93 7.61 40.7 20.2 111 0.036 0.01 62
3 4780 55086 0.84 7.16 35.6 37.4 120 0.070 1.49 11
Modeling Sample 4 5 3913 4450 54111 60443 0.94 1.02 6.17 6.80 45.9 23.7 44.1 33.6 140 134 0.040 0.028 0.68 0.98 347 171
6 3179 53010 1.13 6.60 26.2 53.1 116 0.057 1.04 106
7 4596 57683 1.03 8.26 29.4 62.0 127 0.049 1.90 183
8 4132 49239 0.99 7.00 34.2 58.6 129 0.043 0.35 234
Table E.36: MCRC-slab modeling parameters for geometric sample 4 Parameter Conc Str Reinf Str COF MF Dowel Str Abt-Pas Stf Pile Stf Mass Damp Ratio Small Gap Load Dir
1 4581 59270 1.07 7.62 49.9 53.3 120 0.055 0.85 14
2 2751 47888 1.18 7.03 34.6 55.9 129 0.060 0.64 299
3 3674 52311 0.96 8.11 46.1 23.3 121 0.041 1.49 345
Modeling Sample 4 5 5178 4800 56391 54252 0.86 0.99 6.91 7.30 30.6 39.4 44.6 39.9 114 133 0.019 0.042 1.15 1.61 105 199
321
6 4343 51107 1.09 6.65 21.7 29.4 112 0.051 0.23 169
7 4136 62313 1.01 5.38 38.1 74.1 137 0.047 0.45 73
8 5480 55173 0.91 6.46 24.0 64.1 129 0.033 1.81 261
Table E.37: MCRC-slab modeling parameters for geometric sample 5 Parameter Conc Str Reinf Str COF MF Dowel Str Abt-Pas Stf Pile Stf Mass Damp Ratio Small Gap Load Dir
1 4567 52463 0.90 7.98 43.1 63.3 136 0.037 0.16 276
2 2484 59204 1.04 6.50 26.6 43.5 118 0.022 1.13 85
3 3736 51536 0.94 7.02 28.4 68.9 131 0.038 1.39 140
Modeling Sample 4 5 4356 4034 46420 53627 1.21 0.88 7.63 6.03 22.7 33.7 34.0 21.0 110 138 0.048 0.062 0.44 0.96 342 32
6 5548 55424 1.09 7.22 41.3 52.2 117 0.053 1.93 191
7 5390 57453 1.00 6.72 38.5 56.7 124 0.042 1.66 258
8 4857 62835 1.02 6.88 49.7 27.5 128 0.057 0.69 111
Table E.38: MCRC-slab modeling parameters for geometric sample 6 Parameter Conc Str Reinf Str COF MF Dowel Str Abt-Pas Stf Pile Stf Mass Damp Ratio Small Gap Load Dir
1 3608 57201 1.12 6.66 22.2 57.5 129 0.052 1.99 244
2 2451 50981 0.89 7.21 47.5 32.6 114 0.059 0.15 23
3 4718 47986 0.99 6.90 31.1 68.8 112 0.042 1.03 324
Modeling Sample 4 5 4359 4149 52783 58849 0.91 1.00 6.35 6.59 36.0 38.8 64.2 21.1 120 129 0.032 0.049 0.65 0.81 70 313
6 4943 60937 0.95 7.01 33.6 47.7 134 0.068 0.31 136
7 6099 54339 1.09 7.45 44.3 35.1 138 0.037 1.69 191
8 5312 55592 1.04 8.62 24.6 43.7 124 0.030 1.27 109
Table E.39: MCRC-slab modeling parameters for geometric sample 7 Parameter Conc Str Reinf Str COF MF Dowel Str Abt-Pas Stf Pile Stf Mass Damp Ratio Small Gap Load Dir
1 4317 50702 0.89 7.24 34.2 22.7 139 0.030 1.28 70
2 5024 45183 1.03 6.79 38.1 48.0 123 0.056 1.22 157
3 3781 61666 1.07 7.62 39.0 54.9 131 0.044 1.79 259
Modeling Sample 4 5 3151 4620 53886 53095 0.99 1.18 7.13 7.67 42.9 22.3 61.3 45.7 114 121 0.049 0.051 1.54 0.39 25 219
322
6 5606 56321 0.92 6.84 27.0 34.1 127 0.040 0.72 111
7 4011 58000 1.11 6.45 30.7 74.2 136 0.033 0.23 297
8 5105 59390 0.95 5.63 50.0 27.8 113 0.077 0.96 358
Table E.40: MCRC-slab modeling parameters for geometric sample 8 Parameter Conc Str Reinf Str COF MF Dowel Str Abt-Pas Stf Pile Stf Mass Damp Ratio Small Gap Load Dir
1 4437 46036 0.84 7.64 25.1 22.0 133 0.054 0.70 274
2 3831 62741 0.97 6.22 33.0 38.1 121 0.039 0.91 195
3 4190 57933 0.93 6.76 40.6 30.0 132 0.030 0.20 115
Modeling Sample 4 5 6211 3297 49775 54470 1.03 0.94 7.07 7.18 36.1 29.8 51.9 41.0 124 117 0.032 0.052 1.75 1.95 7 72
6 4775 59815 1.14 8.06 21.4 65.1 112 0.046 1.39 249
7 5121 55885 1.07 6.87 48.8 60.5 125 0.065 0.33 340
8 4571 51816 1.11 6.61 45.9 69.1 138 0.043 1.13 165
Table E.41: MSRC-slab modeling parameters for geometric sample 1 Parameter Conc Str Reinf Str COF MF Dowel Str Abt-Pas Stf Pile Stf Mass Damp Ratio Small Gap Load Dir
1 4528 60568 0.98 7.20 36.0 20.9 137 0.041 0.49 273
2 5820 45085 1.02 7.86 48.9 67.6 114 0.047 1.58 323
3 4225 57684 1.18 7.09 42.2 27.0 120 0.045 1.85 148
Modeling Sample 4 5 4333 3847 53239 49924 0.93 1.05 6.86 6.33 31.9 26.0 48.0 57.4 132 112 0.034 0.054 1.20 0.15 237 95
6 3172 56127 0.97 6.80 20.8 44.5 126 0.066 0.59 87
7 4849 53439 0.86 7.46 45.6 38.3 134 0.053 0.86 210
8 5213 66973 1.10 6.46 30.8 70.0 123 0.025 1.47 45
Table E.42: MSRC-slab modeling parameters for geometric sample 2 Parameter Conc Str Reinf Str COF MF Dowel Str Abt-Pas Stf Pile Stf Mass Damp Ratio Small Gap Load Dir
1 3547 52335 1.03 6.62 48.1 63.3 112 0.043 1.28 207
2 5490 58206 0.93 7.74 31.2 33.8 130 0.056 0.82 140
3 5063 45535 0.87 7.39 43.7 25.8 134 0.026 0.58 103
Modeling Sample 4 5 4086 2701 64328 53743 1.01 1.27 6.34 6.86 20.2 24.2 33.0 55.0 127 121 0.052 0.059 1.21 1.61 34 326
323
6 5362 57475 0.98 7.10 42.1 44.2 138 0.040 0.26 77
7 4544 54803 1.10 7.23 37.4 48.5 125 0.032 1.85 303
8 4281 51441 0.94 6.40 34.1 69.4 115 0.049 0.05 270
Table E.43: MSRC-slab modeling parameters for geometric sample 3 Parameter Conc Str Reinf Str COF MF Dowel Str Abt-Pas Stf Pile Stf Mass Damp Ratio Small Gap Load Dir
1 6085 58724 0.94 6.15 39.0 43.5 122 0.047 1.29 65
2 4950 42885 1.05 6.42 21.9 26.3 113 0.041 1.60 101
3 4385 50579 1.01 7.03 44.2 63.6 119 0.075 1.10 142
Modeling Sample 4 5 3605 2787 55665 54468 0.99 1.07 7.63 6.95 49.2 34.6 60.9 50.5 127 137 0.056 0.035 0.52 1.86 217 274
6 4646 63982 0.87 7.31 31.0 35.7 134 0.026 0.50 40
7 5302 57947 0.93 8.10 24.4 71.6 131 0.038 0.05 326
8 3951 52657 1.14 6.77 35.9 29.5 116 0.052 0.85 237
Table E.44: MSRC-slab modeling parameters for geometric sample 4 Parameter Conc Str Reinf Str COF MF Dowel Str Abt-Pas Stf Pile Stf Mass Damp Ratio Small Gap Load Dir
1 4173 55544 1.03 7.61 29.3 67.5 134 0.029 1.62 109
2 5719 51683 1.04 8.01 39.1 59.8 113 0.056 1.16 318
3 2789 57408 0.94 6.35 46.3 45.8 127 0.034 1.88 276
Modeling Sample 4 5 4550 4827 59076 62232 0.92 1.23 6.70 7.02 21.6 27.1 25.3 35.8 130 122 0.044 0.051 0.66 0.06 82 172
6 5175 50159 0.82 6.95 35.3 49.2 115 0.039 1.40 214
7 4268 54172 0.99 6.52 44.0 71.2 120 0.048 0.82 236
8 3628 45434 1.11 7.34 31.7 29.9 138 0.063 0.38 36
Table E.45: MSRC-slab modeling parameters for geometric sample 5 Parameter Conc Str Reinf Str COF MF Dowel Str Abt-Pas Stf Pile Stf Mass Damp Ratio Small Gap Load Dir
1 4494 49105 0.92 6.47 21.2 68.3 116 0.053 1.96 244
2 4551 51031 1.13 6.20 46.1 63.8 129 0.022 1.24 118
3 3865 54780 0.96 7.41 34.3 33.3 137 0.033 1.56 35
Modeling Sample 4 5 5397 5014 56438 55141 1.08 0.79 8.25 6.62 42.3 24.2 58.7 53.2 123 119 0.063 0.039 1.30 0.43 279 218
324
6 2998 58696 1.01 7.01 46.9 45.9 134 0.056 0.22 158
7 6142 53035 1.06 6.92 30.8 26.5 114 0.043 0.91 89
8 4144 63777 0.99 7.23 37.2 34.4 126 0.049 0.54 352
Table E.46: MSRC-slab modeling parameters for geometric sample 6 Parameter Conc Str Reinf Str COF MF Dowel Str Abt-Pas Stf Pile Stf Mass Damp Ratio Small Gap Load Dir
1 4527 54110 1.03 6.70 21.2 31.4 117 0.049 1.28 65
2 4916 63060 1.13 6.85 38.5 24.9 125 0.062 0.38 307
3 4293 43998 1.12 7.63 31.1 68.9 111 0.014 1.05 241
Modeling Sample 4 5 3490 6065 52908 54963 1.02 0.94 7.89 7.11 26.4 34.7 52.9 46.6 121 130 0.059 0.047 0.67 1.61 92 201
6 4039 58129 0.92 6.25 42.9 57.7 138 0.041 0.90 338
7 3881 50949 0.99 7.24 46.8 61.9 135 0.034 0.03 144
8 5201 58663 0.78 6.44 41.0 37.9 126 0.042 1.83 41
Table E.47: MSRC-slab modeling parameters for geometric sample 7 Parameter Conc Str Reinf Str COF MF Dowel Str Abt-Pas Stf Pile Stf Mass Damp Ratio Small Gap Load Dir
1 4698 63370 0.93 7.63 30.4 67.1 113 0.037 1.21 329
2 5747 52091 0.94 7.31 36.3 22.1 123 0.047 1.74 131
3 3306 56488 0.79 6.40 21.6 53.5 136 0.024 0.01 6
Modeling Sample 4 5 4222 5254 49499 42456 1.12 1.01 6.19 6.98 41.4 47.7 68.5 55.2 117 118 0.042 0.057 0.83 1.78 228 311
6 4277 53414 1.04 7.07 24.8 30.2 134 0.034 1.27 142
7 3837 58448 0.99 6.65 45.2 42.8 127 0.064 0.33 49
8 5058 55088 1.13 7.70 33.5 33.9 132 0.051 0.52 224
Table E.48: MSRC-slab modeling parameters for geometric sample 8 Parameter Conc Str Reinf Str COF MF Dowel Str Abt-Pas Stf Pile Stf Mass Damp Ratio Small Gap Load Dir
1 3239 49767 1.26 7.13 31.0 51.1 117 0.057 1.72 314
2 5196 47536 0.87 7.16 33.7 68.2 131 0.047 1.33 5
3 4455 58693 1.00 6.20 43.2 30.4 119 0.070 0.12 234
Modeling Sample 4 5 3733 5699 61042 51875 0.96 0.93 6.70 7.56 41.1 35.1 37.2 21.6 133 124 0.045 0.053 1.86 1.05 120 150
325
6 4225 54584 1.04 6.82 25.2 44.8 128 0.020 0.30 77
7 4924 57794 1.03 8.34 22.5 58.1 138 0.040 0.87 318
8 4530 56106 1.09 6.42 46.5 67.2 113 0.035 0.68 212
Appendix F. Correlation of Seismic Demands for Bridge Classes Here, the correlation of the seismic demands in the natural logarithm space is shown for the bridge classes considered in this study (Table F.1 through F.7). Table F.1: Correlation of the seismic demands for MCSTEEL bridges ln(Rot) ln(fx_L) ln(fx_T) ln(ex_L) ln(ex_T) ln(abut_P) ln(abut_A) ln(abut_T)
ln(Rot)
ln(fx_L)
1.00 0.58 0.62 0.93 0.54 0.63 0.53 0.50
0.58 1.00 0.54 0.71 0.39 0.28 0.24 0.18
ln(fx_T) ln(ex_L) ln(ex_T) ln(abut_P) ln(abut_A) ln(abut_T)
0.62 0.54 1.00 0.60 0.72 0.43 0.49 0.62
0.93 0.71 0.60 1.00 0.48 0.62 0.55 0.47
0.54 0.39 0.72 0.48 1.00 0.19 0.01 0.15
0.63 0.28 0.43 0.62 0.19 1.00 0.70 0.62
0.53 0.24 0.49 0.55 0.01 0.70 1.00 0.90
0.50 0.18 0.62 0.47 0.15 0.62 0.90 1.00
Table F.2: Correlation of the seismic demands for MSSTEEL bridges ln(Rot) ln(fx_L) ln(fx_T) ln(ex_L) ln(ex_T) ln(abut_P) ln(abut_A) ln(abut_T)
ln(Rot)
ln(fx_L)
1.00 0.78 0.65 0.91 0.62 0.62 0.36 0.56
0.78 1.00 0.72 0.83 0.58 0.73 0.62 0.50
ln(fx_T) ln(ex_L) ln(ex_T) ln(abut_P) ln(abut_A) ln(abut_T)
0.65 0.72 1.00 0.69 0.90 0.40 0.31 0.65
0.91 0.83 0.69 1.00 0.64 0.56 0.37 0.53
0.62 0.58 0.90 0.64 1.00 0.19 0.06 0.67
0.62 0.73 0.40 0.56 0.19 1.00 0.85 0.35
0.36 0.62 0.31 0.37 0.06 0.85 1.00 0.34
0.56 0.50 0.65 0.53 0.67 0.35 0.34 1.00
Table F.3: Correlation of the seismic demands for MSPC bridges ln(Rot) ln(fx_L) ln(fx_T) ln(ex_L) ln(ex_T) ln(abut_P) ln(abut_A) ln(abut_T)
ln(Rot)
ln(fx_L)
1.00 0.78 0.79 0.82 0.82 0.67 0.52 0.57
0.78 1.00 0.83 0.92 0.79 0.81 0.65 0.50
ln(fx_T) ln(ex_L) ln(ex_T) ln(abut_P) ln(abut_A) ln(abut_T)
0.79 0.83 1.00 0.81 0.94 0.71 0.48 0.49
0.82 0.92 0.81 1.00 0.83 0.72 0.59 0.60
326
0.82 0.79 0.94 0.83 1.00 0.64 0.43 0.59
0.67 0.81 0.71 0.72 0.64 1.00 0.76 0.44
0.52 0.65 0.48 0.59 0.43 0.76 1.00 0.61
0.57 0.50 0.49 0.60 0.59 0.44 0.61 1.00
Table F.4: Correlation of the seismic demands for MSRC bridges ln(Rot) ln(fx_L) ln(fx_T) ln(ex_L) ln(ex_T) ln(abut_P) ln(abut_A) ln(abut_T)
ln(Rot)
ln(fx_L)
1.00 0.78 0.78 0.78 0.78 0.68 0.36 0.54
0.78 1.00 0.82 0.86 0.73 0.74 0.48 0.60
ln(fx_T) ln(ex_L) ln(ex_T) ln(abut_P) ln(abut_A) ln(abut_T)
0.78 0.82 1.00 0.73 0.79 0.81 0.44 0.58
0.78 0.86 0.73 1.00 0.75 0.70 0.50 0.59
0.78 0.73 0.79 0.75 1.00 0.57 0.27 0.54
0.68 0.74 0.81 0.70 0.57 1.00 0.62 0.63
0.36 0.48 0.44 0.50 0.27 0.62 1.00 0.85
0.54 0.60 0.58 0.59 0.54 0.63 0.85 1.00
Table F.5: Correlation of the seismic demands for SSPC bridges ln(fx_L) ln(fx_T) ln(ex_L) ln(ex_T) ln(abut_P) ln(abut_A) ln(abut_T)
ln(fx_L)
ln(fx_T)
ln(ex_L)
ln(ex_T)
ln(abut_P)
ln(abut_A)
ln(abut_T)
1.00 0.78 0.99 0.78 0.81 0.29 0.37
0.78 1.00 0.75 1.00 0.73 0.21 0.46
0.99 0.75 1.00 0.75 0.75 0.31 0.38
0.78 1.00 0.75 1.00 0.73 0.21 0.46
0.81 0.73 0.75 0.73 1.00 0.36 0.38
0.29 0.21 0.31 0.21 0.36 1.00 0.76
0.37 0.46 0.38 0.46 0.38 0.76 1.00
Table F.6: Correlation of the seismic demands for MCRC-slab bridges ln(Rot) ln(fx_L) ln(fx_T) ln(ex_L) ln(ex_T) ln(abut_P) ln(abut_A) ln(abut_T)
ln(Rot)
ln(fx_L)
1.00 0.52 0.64 0.54 0.65 0.43 0.25 0.25
0.52 1.00 0.69 0.74 0.63 0.39 0.15 0.10
ln(fx_T) ln(ex_L) ln(ex_T) ln(abut_P) ln(abut_A) ln(abut_T)
0.64 0.69 1.00 0.77 0.85 0.37 0.21 0.25
0.54 0.74 0.77 1.00 0.85 0.38 0.30 0.25
327
0.65 0.63 0.85 0.85 1.00 0.35 0.21 0.24
0.43 0.39 0.37 0.38 0.35 1.00 0.45 0.40
0.25 0.15 0.21 0.30 0.21 0.45 1.00 0.95
0.25 0.10 0.25 0.25 0.24 0.40 0.95 1.00
Table F.7: Correlation of the seismic demands for MSRC-slab bridges ln(Rot) ln(fx_L) ln(fx_T) ln(ex_L) ln(ex_T) ln(abut_P) ln(abut_A) ln(abut_T)
ln(Rot)
ln(fx_L)
1.00 0.70 0.82 0.83 0.84 0.58 0.34 0.42
0.70 1.00 0.82 0.80 0.69 0.73 0.57 0.60
ln(fx_T) ln(ex_L) ln(ex_T) ln(abut_P) ln(abut_A) ln(abut_T)
0.82 0.82 1.00 0.71 0.75 0.77 0.50 0.56
0.83 0.80 0.71 1.00 0.80 0.53 0.37 0.41
328
0.84 0.69 0.75 0.80 1.00 0.47 0.25 0.42
0.58 0.73 0.77 0.53 0.47 1.00 0.63 0.56
0.34 0.57 0.50 0.37 0.25 0.63 1.00 0.91
0.42 0.60 0.56 0.41 0.42 0.56 0.91 1.00