Hindawi Publishing Corporation Advances in Civil Engineering Volume 2015, Article ID 537405, 10 pages http://dx.doi.org/10.1155/2015/537405
Research Article Seismic Vulnerability Assessment of Deficient RC Structures with Bar Pullout and Joint Shear Degradation Arslan Mushtaq, Shaukat Ali Khan, Hamza Farooq Gabriel, and Sajjad Haider NUST Institute of Civil Engineering, School of Civil & Environmental Engineering, National University of Sciences & Technology, Islamabad, Pakistan Correspondence should be addressed to Arslan Mushtaq;
[email protected] Received 14 August 2014; Revised 15 December 2014; Accepted 22 December 2014 Academic Editor: Polat G¨ulkan Copyright © 2015 Arslan Mushtaq et al. This is an open access article distributed under the Creative Commons Attribution License, which permits unrestricted use, distribution, and reproduction in any medium, provided the original work is properly cited. Pakistan is an underdeveloped country, still striving for improvement in construction practices. Most of the private construction is carried out as nonengineered which caused loss of approximately 85,000 lives in Kashmir (2005) earthquake. However, after the Kashmir (2005) earthquake, the government and engineering community emphasized on implementation of seismic codes. Although the current construction practices are considered as better than previous construction work the vulnerability of these structures is yet to be determined. It aims at the vulnerability assessment of recent RC construction in Pakistan that still needs to be assessed. Research work starts with calibration of panel zone element (PERFORM 3D) depicting joint shear degradation, while comparing the analytical results with experimental work, found in the literature. The frame work is then used for vulnerability assessment of RC structures typical of current construction practices in Pakistan while using advanced capacity spectrum method, developed by Kyriakides for which three cases have been considered, being constructed more frequently by public sector, in different seismic zones, based on design usually followed by builders in the region. Finally, the conclusion is drawn with suggestion of further improvement of seismic behavior of the structures.
1. Introduction Earthquakes are one of the major sources of structural damage since evolution of human society. Major earthquakes in last decade like Bhuj (2001) in India, Bam (2003) in Iran, Sumatra which caused Tsunami (2004), Kashmir (2005) in Pakistan, Haiti (2010), China (2010), Indonesia (2010), Chile earthquake and Tsunami (2010), and ChristchurchNew Zealand (2011) have jolted the human life safety and economy of the states severely. In a developing country like Pakistan, most of the construction prior to Kashmir (2005) earthquake has been carried out without considering seismic design parameters in detail and that was the basic reason that caused a loss of about 85000 human lives after earthquake in Kashmir (2005). During the design phase of structures, especially buildings, old practices are involved with designing of only beams, columns, slabs, and footings while considering that the induced energy during large deformations is absorbed in carefully detailed plastic hinges, usually located in connecting beams, whereas joints are considered as elastic elements since
they exhibit poor energy dissipation mechanism due to bond and shear properties. On the contrary, while performing the seismic tests in labs or observing the failures of the structures after an earthquake, joint shear failure is one of the major causes of structural damage (Lafave et al. 2004). When a structure is encountered by an earthquake, the joint region is subjected to moment reversals due to its connecting beams and columns. On similar lines, another important parameter known as bar pullout is the most prominent mode of failure especially for corner joints where beam steel undergoes a considerable axial stress when frame is subjected to lateral forces due to earthquake. From the literature review, it is found that engineers have established that where joints undergo significant inelastic shear deformations on one side, reinforcing steel is also subjected to axial stress causing damage to the concrete bond of the steel, when ductile moment resisting frame structures are subjected to seismic forces. Hence, by neglecting joint shear and bar pullout during analysis and design of the structures, a misinterpretation of the structural performance and miscalculation of ductility demands of the connecting
2
Advances in Civil Engineering Table 1: Concrete properties.
Specimen 1 (MPa) Except upper column 29.9 Upper column 35.8
2 (MPa) 36.2 40.7
3 (MPa) 47.4 45.4
4 (MPa) 31.2 31.5
frame elements may arise. Therefore, for more realistic storey drift results, inelastic shear behavior of the joints and bar pullout must be catered for. This research is in continuation of seismic vulnerability assessment framework, developed by Kyriakides (2012) and Ahmed [1] at University of Sheffield. Both Kyriakides and Ahmed considered shear as elastic-perfectly plastic in their researches. Therefore, there was a need to see how shear with negative stiffness and strength degradation will behave. The purpose of current research is to evaluate the current construction by using FEM model with degradation due to joint shear and bar pullout while considering the actual buildings, being constructed in Pakistan; therefore, authors have organized the research in two parts where the first part deals with the calibration of beam column joint subassembly by using panel zone for joint shear model in PERFORM 3D and finally, in second part, to further extend the scope of research, typical three-, five-, and eight-storey residential buildings in Pakistan currently under construction have been considered for seismic vulnerability assessment.
2. Part I The first part of this research work covers development of analytical joint shear model compared with experimental work of Lafave et al. (2004), by modeling and analyzing the joint subassembly in PERFORM 3D. However, a glimpse on the literature review is provided while proceeding towards the description of analytical assessment. 2.1. Literature Review. While having a look over literature for joint behavior against seismic excitation, researchers have put their effort for approximation of nonlinear behavior of joints while structures are subjected to lateral force, particularly, earthquake excitation. The following research review has been produced for having a quick overview of earlier research. Giberson [2] proposed a model in which two nonlinear springs were attached with a linear elastic simple beam element. This model was implicitly exhibiting the improved overall drift response of the structure but lacks the local response. Krawinkler and Mohasseb [3] are considered as pioneers for introducing panel zone behavior by developing a macroelement model for representing panel zone behavior in steel moment resisting frames. The model consisted of two scissor type components connected by a rotational spring for representing joint shear stress versus strain behavior. Later on, Krawinkler [4] developed a more accurate panel zone model with rigid boundaries, having trilinear shear stress strain behavior. Alath and Kunnath [5] developed RC connection panel element with similar concept as that mentioned above. Panel moment was calculated while considering the pure shear behavior of joint core but joint shear
properties were empirically calculated. Bidah and Ghobarah (1999) proposed a modified model of Alath and Kunnath, by introducing two rotational springs, one for joint shear deformation and the other for bond slip behavior of beam reinforcing bar. Yousaf and Ghobarah (2001) developed a more refined model, having four rigid links connected with hinges and two nonlinear axial springs for panel diagonal connection. This model exhibited improved computation for joint shear and bar pullout on joint face but lacks for more accurate computation of RC hysteretic properties. Lowes and Altontash [6] proposed a more realistic joint shear model for older nonductile frames without joint shear reinforcement, having four interface shear springs and eight bar slip springs. 2.2. Analytical Modeling of Joint Shear Panel in PERFORM 3D. Lafave et al. (2004) tested four beam column subassemblies with difference in reinforcement details of beams and columns. Testing of subassemblies was done by applying lateral loading at top, by using hydraulic actuator and consequently, results compiled accordingly for joint shear stress versus strain. In this research, analytical model has been developed for specimen SL1. The brief pictorial description of specimen SL1 has been presented as in Figure 1 along with joint shear panel zone of the analytical tool. PERFORM 3D has been used as an analytical tool and results are compared against published experimental work of Lafave et al. (2004). The subassembly has been modeled in 2D, with beams and columns as elastic elements and joint zone as an inelastic connection element zone as shown in Figure 2. The support conditions of the subassembly are hinge at the base and roller supports at left and right ends (Lafave et al. 2004). Material properties are mentioned in Tables 1 and 2 for quick review. For inelastic joint element, connection panel zone element has been used. The input parameters for defining the connection element are moment through connection and shear strain. As defined earlier, the joint zone is subjected to high moment reversals causing moment through connection with the result of shear failure; hence the horizontal shear force, acting over the joint, is multiplied by the distance between top and bottom bars of the beam to give moment through connection [8]. In order to define the shear stresses at different levels of ductility, a trilinear relationship has been chosen to represent the hysteretic behavior of the joint. From the literature review, Stevens et al. [7], after testing joint subassembly, developed the backbone curve against joint shear stress and strain. Later on, Kim and Lafave [9] developed a critically assessed RC joint shear stress strain analytical model using Bayesian parameter estimation method while testing 341 different joint subassemblies and considering the most influencing parameters for joint behavior. The authors developed a set of equations at different levels of ductility, suitable for most of the beam column connections. Figure 3 has been provided for the joint subassembly SL1 of Lafave et al. (2004), after using set of equations at points A, B, C, and D of Kim and Lafave [9]. After defining the modeling parameters in PERFORM 3D, static cyclic (pushover) analysis has been carried out and,
Advances in Civil Engineering
3 Table 2: Steel properties.
Bar size 𝑓𝑦 (MPa) 𝜖𝑦 𝜖sh 𝑓𝑢 (MPa)
Number 3 (9.5 mm) 448 0.0022 0.008 703
Number 5 (15.9 mm) 506 0.0027 0.017 662
Number 6 (19.1 mm) 539 0.0026 0.016 690
Column hoop 466 0.0045 N.A 715
Moment and shear from column Rotational spring
Joint shear link
330
2127
1029
406
1511
Loading direction
Moment and shear from beam
Component depth
2172
Rigid link Detail of joint shear link
Figure 1: Salient of joint subassembly SL1 (all units are in mm).
406
330
4#5
8#6
2#5
457
280 (a)
(b)
Figure 2: (a) Column cross section and (b) beam cross section (all units are in mm).
consequently, the results are used for development of capacity curves, to be compared with published experimental results of Lafave et al. (2004).
7 B
Shear stress (MPa)
6
C D
5
2.3. Results. After performing analysis, backbone curves against joint shear stress versus strain and storey shear versus drift are obtained. In Figure 4, comparison of backbone capacity curves, obtained in this research, versus experimental and analytical work of Lafave et al. (2004) is shown, showing convergence of results.
4 3 2
A
1 0 0
0.005
0.01
0.015
Shear strain
Figure 3: Joint shear stress strain curve after Stevens et al. [7].
3. Part II In this part, the authors have considered actual three-, five-, and eight-storey typical current Pakistani buildings (under
Advances in Civil Engineering 100
900
90
800
80
700
Joint shear force (KN)
Storey shear (KN)
4
70 60 50 40 30 20
600 500 400 300 200 100
10 0
0 0
2
4
6
8
0
0.01
Storey drift (%)
0.02
0.03
0.04
0.05
0.06
Joint shear deformation (rad)
FEM model (Lafave et al. 2004) Experimental (Lafave et al. 2004) FEM model (this study)
FEM model (Lafave et al. 2004) Experimental (Lafavet et al. 2004) FEM model (this study)
Figure 4: Comparison of results.
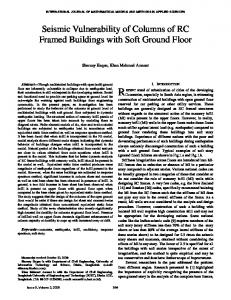
Figure 5: Damage of earthquake in Pakistan.
construction) as a case study. As mentioned earlier, Pakistan has encountered numerous earthquakes, among which the most recent is at Awaran Quetta (2013) and Kashmir (2005), which has caused significant human life and structural damage as shown in Figure 5. Keeping in view the seismic intensity and frequency, Pakistan has been subdivided into seismic zones, as elaborated in Figure 6. 3.1. Construction Trends. Most of the construction in Pakistan, especially, in private sector, is without consultation of structural engineers. While carrying out this research, authors found that although seismic code has been developed in Pakistan, still, construction is being carried out without considering the proper seismic design. Figures 7 and 8 show some pictorial views of the structures, under construction in seismic zone 4, located in Muzafarabad (region effected by Kashmir earthquake 2005). From Figure 7(a), the first-floor column steel has been erected while compromising sufficient confinement/shear reinforcement. Similarly, from Figure 7(b), poor reinforcement detailing and discontinuity of shear reinforcement through joint core are the major construction flaws that are
500 km 1
2A
2B
3
4 B
Figure 6: Seismic zones of Pakistan [10].
critical when subjected to earthquake effects. In general, poor detailing and construction is a prominent feature of cases as shown in Figure 7. On one side, the construction is carried out with numerous flaws, whereas, on the other side, most of
Advances in Civil Engineering
5
Rings spacing Deficient shear reinforcement in core
(a)
(b)
Figure 7: Construction trends in Pakistan.
(a) Faisal Mosque, Islamabad
(c) Residential Towers, Karachi
(b) The Centaurus, Islamabad
(d) WAPDA House, Lahore
Figure 8: Modern construction in Pakistan.
the developed areas, like Islamabad, Rawalpindi, Karachi, and Lahore, have the high rise buildings, critically designed and executed as per engineering standards (Figure 8). From preceding paragraph, diversity of construction trends in Pakistan can easily be understood. Based on variable construction trends, Shehzada et al. [11] studied the vulnerability of unreinforced brick masonry, confined brick masonry, and reinforced concrete structures in Abbottabad and proposed retrofitting techniques for collapse prevention of the structures. On similar lines, while having a look over construction after Kashmir earthquake (2005), seismic vulnerability assessment of a four-storey official building in Muzafarabad and academic building in Karachi has been carried out by Khan and Rodgers [12, 13], with outcome of recommendation for better performance of the structures. From Naeem et al. [14], failure of stone masonry, block
masonry, and reinforced concrete structures caused severe damage to human life due to Kashmir earthquake (2005). Keeping in view the previous studies and general construction trend, authors have selected three cases for seismic vulnerability assessment, which are currently under construction in different areas of Pakistan. Among these, 3-storey and 8-storey buildings are the residential apartments and 5storey building is a commercial building. These buildings are selected as they are typically constructed throughout Pakistan in various seismic zones in public sector, under supervised construction as being considered suitable engineered structures but without due consideration given to seismic designs. 3.2. Modeling, Analysis, and Results. As discussed in preceding lines, cases under consideration consist of 3-, 5-, and 8-storey RC frame structures, being constructed more
6
Advances in Civil Engineering Table 3: Parameters for mean bond stress-slip model proposed by CEB-FIP Model Code [15].
Parameter 𝑆1 𝑆2 𝑆3 𝛼 𝜏max 𝜏𝑓
Unconfined concrete Good bond conditions All other bond conditions 0.6 mm 0.6 mm 0.6 mm 0.6 mm 1.0 mm 2.5 mm 0.4 0.4 2.0√𝑓ck 1.0√𝑓ck 0.15 𝜏max 0.15 𝜏max
Confined concrete Good bond conditions All other bond conditions 1.0 mm 1.0 mm 3.0 mm 3.0 mm Clear Rib Spaces Clear Rib Spaces 0.4 0.4 2.5√𝑓ck 1.25√𝑓ck 0.40 𝜏max 0.40 𝜏max
100 80
𝜏max
70 DI (%)
Bond stress, 𝜏
90
𝜏 = 𝜏max (S/S1 )𝛼
60 50 40 30
𝜏f
20 S1
S2
S3 Slip, S
10 0 0
0.1
0.2
0.3
0.4
0.5
0.6
PGA
Figure 9: Characteristic bond stress versus slip curve [15]. This research Kyriakides (2007)
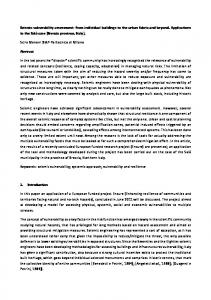
frequently by public sector, in different seismic zones, based on design usually followed by builders in the region. Test data from concerned construction sites were collected by Usman (2014), having mean strength of concrete as 25 MPa and of steel as 423 MPa; therefore, concrete strength of 21 MPa and steel strength of 415 MPa have been considered in this research. In order to have a better approximation of the results, bar pullout (CEB FIP Code) and joint shear degradation [7] have also been incorporated. Since a deliberate discussion on joint shear degradation has been carried out in part I, hence, only a brief discussion on bar pullout is presented here. Bar pullout is defined as a failure in which steel reinforcing bar slips out of concrete cover, due to deterioration of bond resistance, when a structure is subjected to forces reversals. Researchers like Pantazapoulou et al. (2002), Stanton et al. (2007), Ahmed [1], and Kyriakides (2014) have studied the bar pullout experimentally and analytically. On the similar lines Eligehausen et al. (1983), Lehman and Moehle (2000), Lowes et al. (2004), and Lettow (2006) have also made a considerable effort to develop an analytical model for bar pullout mechanism. This research has been primarily focused while considering joint shear degradation since earlier researches by Khan [12, 13] at NUST have already been carried out while considering bar pullout only as a hysteretic parameter against cyclic loading. Figure 9 shows the characteristic curve of bond stress versus slip as defined under CEB FIP Model Code (see also Table 3). The bar stress-slip properties are defined in PERFORM 3D by using compound cross section properties to the beams and columns in the slip prone zone of the connection.
Figure 10: Comparison of vulnerability curve for low rise deficient buildings.
In order to apply the concept of joint shear degradation and bar pullout models more confidently for analysis of real case structures, authors have analyzed a seismically deficient RC structure (low rise 2-storey and single bay building) and vulnerability for the same was compared, as shown in Figure 10, to the analytical results of Kyriakides [16, 17]. After performing the comparison, the research is further preceded by vulnerability assessment of real case structures, that is, 3, 5, and 8 storeys, and static cyclic analysis has been performed while defining maximum storey drift, after defining material properties and modeling of each structure. Subsequent to performing analysis, hysteresis loop against storey shear versus top node drift for each of the structures is obtained and backbone capacity curve is drawn, which is further used for development of seismic vulnerability curve by using Kyriakides (2012) method. Figure 11 is showing the bay widths and storey heights for each of the frames, which are further used for FEM molding and analysis. After performing analysis, following backbone capacity curves against storey shear versus top node drift are obtained in Figure 12, which are further used for drawing seismic vulnerability curves. The curves are also containing the state of damage, observed from simulation of the structural models. The results of this damage are further illustrated in Figure 13 against limits states for more clarity to the readers.
Advances in Civil Engineering
7 3 at 3658
3429
3 at 3200
Steel with pullout properties
Column
3429
Rotational spring
Beam
Steel with general properties
Column
Rigid link
Beam
(a) Three-storey frame
4929
5054
5892
4267
5892
5054
5690
5 at 3048
8 at 3200
4 at 3734
(b) Five-storey frame
(c) Eight-storey frame
Figure 11: Elevation of three-, five-, and eight-storey buildings (all units are in mm).
Seismic vulnerability assessment of the selected cases has been carried out by using Kyriakides (2012) method. Kyriakides (2012) carried out the seismic vulnerability assessment of deficient buildings in Cyprus, while using capacity spectrum method (CSM) as a basic framework. The researcher, however, found a disadvantage of the procedure specially when dealing with degrading structures. According to Kyriakides [16], “In the context of CSM, the transformed capacity envelope is required to be idealized into an elasticperfectly plastic form. This is necessary so as to enable the establishment of the ductility levels at each displacement. This form is universally accepted and even the latest variation of CSM, included in FEMA 440 [18], assumes an elasto-plastic (E-P) approximation. However, this assumption means that the energy of the elasto-plastic (E-P) system is not necessarily equal to the energy of the capacity envelope at all displacements. This may cause inaccuracies in degrading structures.” Based on the deficiency, Kyriakides (2012) proposed a modification for complex degrading behavior in substandard construction by approximating the shape of capacity curve by a number of different elastic-perfectly plastic systems with zero postyield stiffness, known as advanced capacity spectrum method. Figure 13 is showing the vulnerability
curves for each of the three cases, with limits states of FEMA 273 [19]. From vulnerability curves, the comments are summarized as follows. (1) From limits states, drawn for Figure 13(a), brittle structural behavior has been observed since the structure immediately goes to collapse once damage control state exceeds. The respective behavior of the structure is showing that it cannot behave seismically satisfactorily especially at higher PGAs. (2) For five storeys (Figure 13(b)), structure is representing better behavior since it is not going through abrupt failure with increase in PGA. However, once immediate occupancy limit state is reached, the rest of the limit states are reached in very short sequence; hence, structure although will give warning but failure may occur in a short interval of time. (3) For eight storeys (Figure 13(c)), collapse in the structure occurred at PGA of 0.75. Structure has a ductile behavior and before collapse occurs, structure has represented a considerable warning by moving
8
Advances in Civil Engineering 50
90
45
80 70
35
Joint shear failure
Storey shear (KN)
Storey force (KN)
40 30 25 20
Initiation of yield to some members
15
Bar pullout
60
Joint shear failure
40 Initiation of yield to some members
30 20
10 Cracking
5
10
0
Bar pullout
50
Cracking
0 0
0.05
0.1
0.15
0.2
0.25
0
0.05 0.1 Top node drift (m)
Top node drift (m) (a) Three-storey frame
0.15
(b) Five-storey frame
80 70
Base shear (KN)
Bar pullout
Joint shear failure
60 50 40
Initiation of yield to some members
30 20
Cracking 10 0 0
0.05
0.1
0.15 0.2 0.25 Top node drift (m)
0.3
0.35
(c) Eight-storey frame
Figure 12: Pushover backbone curves.
through immediate occupancy to damage control limit state. Apart from having drawn vulnerability for the structures, the discussion is further extended while comparing the GESI curve for seismically deficient structures with the three cases, as shown in Figure 14.
storeys, show abrupt failure after having reached at maximum PGA. This structural behavior indicates that the structures are showing brittle failure modes beyond 60% Damage Index; hence, further improvements in the designs are required to ascertain the ductile behavior of the structures till collapse, for structural and life safety. However, a better, safer response for eight storeys has been observed.
4. Conclusion From this research, the following conclusions are made. (i) The joint shear degradation is one of the important structural modeling parameters. From comparison of vulnerability curve of Kyriakides et al. [17] and this research for low rise deficient RC structures, more brittle behavior is observed when joint shear is incorporated as well with bar pullout model. Therefore, it is concluded that shear degradation enhances the brittle structural behavior. (ii) While having look over vulnerability curves, it is concluded that structures, especially three and five
(iii) From comparison of vulnerability curves with GESI curve, it is observed that structures are exhibiting 100% damage, well before the safer damage PGA as recommended by GESI curve. Although GESI curves are developed for seismically deficient structures they may overestimate collapse prevention in such structures. (iv) Seismic codes have been adopted in Pakistan since 2007; however, these codes are not fully understood and implemented as deviation from code is still observed in construction industry.
9
100
90
90
80
80 Damage index (%)
100
70 60 50 40 30
70 60 50 40 30
20
20
10
10 0
0 0.2
0.4
0.6
0
0.8
0.2
0.4 PGA (g)
PGA (g) Immediate occupancy Damage control Life safety
Immediate occupancy Damage control Life safety
(a) Three-storey frame
Damage index (%)
0
(b) Five-storey frame
100 90 80 70 60 50 40 30 20 10 0 0
0.2
0.4 PGA (g)
Immediate occupancy Damage control Life safety
0.6
0.8
Limited safety Collapse prevention
(c) Eight-storey frame
Figure 13: Vulnerability curves.
100 90 80 Damage index (%)
Damage index (%)
Advances in Civil Engineering
70 60 50 40 30 20 10 0 0
0.2
0.4
0.6
0.8
1
1.2
PGA (g) GESI curve
Five storeys
Three storeys
Eight storeys
Figure 14: Comparison of vulnerabilities.
1.4
0.6
0.8
Limited safety Collapse prevention
10
Conflict of Interests The authors declare that there is no conflict of interests regarding the publication of this paper.
References [1] S. Ahmed, Seismic vulnerability of non-ductile reinforced concrete structures in developing countries [Ph.D. thesis], Earthquake Engineering Group, Department of Civil & Structural Engineering, University of Sheffield, 2011. [2] M. F. Giberson, “Two nonlinear beams with definitions of ductility,” Journal of the Structural Division, vol. 95, supplement 2, pp. 137–157, 1969. [3] H. Krawinkler and S. Mohasseb, “Effects of panel zone deformations on seismic response,” Journal of Constructional Steel Research, vol. 8, pp. 233–250, 1987. [4] H. Krawinkler, “State of the art report on systems performance of steel moment frames subjected to earthquake ground shaking,” Tech. Rep. FEMA-355C, Federal Emergency Management Agency, Washington, DC, USA, 2001. [5] S. Alath and S. Kunnath, “Modeling inelastic shear deformation in RC beam-column joints,” in Proceedings of the 10th Conference on Engineering Mechanics, pp. 822–825, University of Colorado at Boulder, Boulder, Colo, USA, 1995. [6] L. Lowes, N. Mitra, and A. Altontash, A Beam-Column Joint Model for Simulating the Earthquake Response of Reinforced Concrete Frames, Pacific Earthquake Engineering Research Centre, University of California, Berkeley, Calif, USA, 2003. [7] N. J. Stevens, S. M. Uzumeri, and M. P. Collins, “Reinforced concrete subjected to reversed cyclic shear—experiments and constitutive model,” ACI Structural Journal, vol. 88, no. 2, pp. 135–146, 1991. [8] B. B. Canbolat, “Structural applications of a reinforced concrete beam-column-slab connection model for earthquake loading,” in Proceedings of the 14th World Conference on Earthquake Engineering, Beijing, China, 2008. [9] J. Kim and M. J. Lafave, “Joint shear behavior prediction for RC beam-column connections,” International Journal of Concrete Structures and Materials, vol. 5, no. 1, pp. 57–64, 2011. [10] Building Codes of Pakistan (BCP), Seismic Provisions, Government of Islamic Republic of Pakistan, Ministry of Housing and Works, Islamabad, Pakistan, 2007. [11] K. Shehzada, B. Gencturk, A. N. Khan, A. Naseer, M. Javed, and M. Fahad, “Vulnerability assessment of typical buildings in Pakistan,” International Journal of Earth Sciences and Engineering, vol. 4, no. 6, pp. 208–211, 2011. [12] Rashid Khan and J. Rodgers, Four Storey Office Building in Muzafarabad. A Case Study of Seismic Assessment and Retrofit Design, GeoHazards International and NED University of Engineering & Technology, Karachi, Pakistan, 2012. [13] Rashid Khan and J. Rodgers, Four Storey Academic Building. A Case Study of Seismic Assessment, NED University of Engineering & Technology, 2012, http://earthquake.usgs.gov/ earthquakes/eqarchives/. [14] A. Naeem, Q. Ali, M. Javed et al., “First report on the Kashmir earthquake of October 8, 2005,” Tech. Rep., Department of Civil Engineering, University of Engineering & Technology, Peshawar, Pakistan, 2005. [15] CEB-FIP Model Code 1990, “Bond stress strain relationship,” in Comite Euro-International du Beton, Chapter 3, 1991, First Published in 1993 by Thomas Telford.
Advances in Civil Engineering [16] N. Kyriakides, Vulnerability of RC buildings and risk assessment for Cyprus [Ph.D. thesis], Department of Civil & Structural Engineering, Center for Cement and Concrete, University of Sheffield, Sheffield, UK, 2007. [17] N. Kyriakides, K. Pilakoutas, and K. Chrysostomou, “Vulnerability of RC buildings and risk assessment for Cyprus,” in Proceedings of the 3rd International Fib Congress Incorporating the PCI Annual Convention and Bridge Conference, Washington, DC, USA, 2010. [18] FEMA 440, “Improvement of nonlinear static seismic analysis procedures,” Project Report ATC-55, Applied Technology Council, Redwood City, Calif, USA, 2005. [19] T. Rossetto and A. Elnashai, “Derivation of vulnerability functions for European-type RC structures based on observational data,” Engineering Structures, vol. 25, no. 10, pp. 1241–1263, 2003.
International Journal of
Rotating Machinery
Engineering Journal of
Hindawi Publishing Corporation http://www.hindawi.com
Volume 2014
The Scientific World Journal Hindawi Publishing Corporation http://www.hindawi.com
Volume 2014
International Journal of
Distributed Sensor Networks
Journal of
Sensors Hindawi Publishing Corporation http://www.hindawi.com
Volume 2014
Hindawi Publishing Corporation http://www.hindawi.com
Volume 2014
Hindawi Publishing Corporation http://www.hindawi.com
Volume 2014
Journal of
Control Science and Engineering
Advances in
Civil Engineering Hindawi Publishing Corporation http://www.hindawi.com
Hindawi Publishing Corporation http://www.hindawi.com
Volume 2014
Volume 2014
Submit your manuscripts at http://www.hindawi.com Journal of
Journal of
Electrical and Computer Engineering
Robotics Hindawi Publishing Corporation http://www.hindawi.com
Hindawi Publishing Corporation http://www.hindawi.com
Volume 2014
Volume 2014
VLSI Design Advances in OptoElectronics
International Journal of
Navigation and Observation Hindawi Publishing Corporation http://www.hindawi.com
Volume 2014
Hindawi Publishing Corporation http://www.hindawi.com
Hindawi Publishing Corporation http://www.hindawi.com
Chemical Engineering Hindawi Publishing Corporation http://www.hindawi.com
Volume 2014
Volume 2014
Active and Passive Electronic Components
Antennas and Propagation Hindawi Publishing Corporation http://www.hindawi.com
Aerospace Engineering
Hindawi Publishing Corporation http://www.hindawi.com
Volume 2014
Hindawi Publishing Corporation http://www.hindawi.com
Volume 2014
Volume 2014
International Journal of
International Journal of
International Journal of
Modelling & Simulation in Engineering
Volume 2014
Hindawi Publishing Corporation http://www.hindawi.com
Volume 2014
Shock and Vibration Hindawi Publishing Corporation http://www.hindawi.com
Volume 2014
Advances in
Acoustics and Vibration Hindawi Publishing Corporation http://www.hindawi.com
Volume 2014