Towards the East it is bounded by the Aravalli system comprising of older proterozoic rocks of Aravalli and .... with higher velocity in the range of 7.2--7.4 km/s.
Seismically constrained two-dimensional crustal thermal structure of the Cambay basin S T H I A G A R A J A N , D V R A M A N A and S N R A I National Geophysical Research Institute, Hyderabad 500 007, India. e-mail: postmast@csngri:ren:nic:in The temperature field within the crust is closely related to tectonic history as well as many other geological processes inside the earth. Therefore, knowledge of the crustal thermal structure of a region is of great importance for its tectonophysical studies. This work deals with the two-dimensional thermal modelling to delineate the crustal thermal structure along a 230 km long Deep Seismic Sounding (DSS) profile in the north Cambay basin. In this work P-wave velocities obtained from the DSS studies have been converted into heat generation values for the computation of temperature distribution. The model result reveals the Curie isotherm at a depth of � 22 km and Moho temperature at around 900� C.
1. Introduction The Cambay basin which is one of the major onshore oil bearing sedimentary basins of India is situated at its western margin in the Gujarat state approximately 0 0 between 21� N and 24� 30 N latitudes and 71� 30 E and 0 � 73 45 E longitudes. The basin runs in the form of a graben in approximately NNW-SSE direction up to 0 21� 45 N latitude and thereafter it turns in NNESSW direction towards the Gulf of Cambay. The basin is joined to the ENE-WSW trending Kutch rift basin in the north. The ENE-WSW trending Narmada rift basin lies in its south. West of the Cambay basin is the Saurashtra Peninsula covered by Deccan traps of late Cretaceous age (Merh 1995). Towards the East it is bounded by the Aravalli system comprising of older proterozoic rocks of Aravalli and Delhi supergroups. The Aravalli trend (NE-SW) continues further southwest underneath the Cambay basin and Saurashtra peninsula, whereas the Delhi trend (NE-SW) swings approximately to E-W direction under the Kutch basin (Mishra et al 1998). The Cambay basin developed sequentially from north to south during India’s northward drifting after the breakup of the Gondwana land. Development of the three major rift basins of western margin, namely Kutch, Cambay and Narmada rift basins seems to be
related to the evolution of the western margin of India in three stages. These stages are: *
*
*
separation of Africa from India during early Jurassic (Besse and Courtillot 1988) separation of Medagascar from India caused by Marion hot spot during the Middle Cretaceous (Morgan 1981), and break up of the Seychelles from India caused by Reunion hot spot during late Cretaceous which gave rise to the Deccan flood basalts (McKenzie and Slater 1971).
The Kutch rifting took place during early Jurassic, followed by the Cambay rifting in early Cretaceous and Narmada rifting in late Cretaceous. The Cambay basin is filled by Quaternary and Tertiary sediments mainly consisting of sandstone, siltstone, claystone and shales and is bounded by step faults on its western and eastern margins (Biswas 1982, 1987). Heat flow measurements carried out in the northern part of the Cambay basin indicate high heat flow values (75--93 mW/m2) with an average value of 83 mW/m2 as compared to the normal heat flow value of approximately 46 mW/m2 for stable continental areas. This makes the region interesting from tectonic as well as geothermic point of view and has attracted the attention of many workers (Verma et al 1968;
Keywords. Cambay basin; P-wave velocity; heat flow; heat generation; 2-D modelling; crustal thermal structure; Moho depth; Curie isotherm. Proc. Indian Acad. Sci. (Earth Planet. Sci.), 110, No. 1, March 2001, pp. 1--8 # Printed in India
1
2
S. Thiagarajan et al
Gupta 1981; Negi et al 1987). Only one-dimensional analytical modelling approach based on uniform or exponentially decreasing heat generation value has been used to delineate the crustal thermal structure of the Cambay basin. However, this approach has a major disadvantage of ignoring the effect of lateral variation in the heat production and thermal conductivity due to inhomogeneity in the crustal structure on temperature distribution. This problem has been overcome by numerically solving the two dimensional heat conduction equation to determine the temperature distribution (Safanda 1985; Furlong and Chapman 1987; Safanda et al 1992). For twodimensional thermal modelling knowledge of crustal structure and velocity depth distribution is very essential in order to convert the P-wave velocity, Vp , into heat generation, A, using the following experimental relationship between these two parameters for Phanerozoic rocks as suggested by Rybach and Butenbarth (1984): ln A ¼ 13:7 ÿ 2:17Vp :
ð1Þ
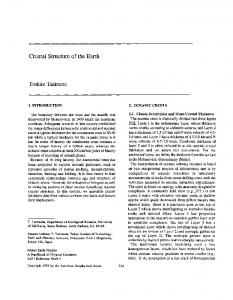
The value of A obtained by this procedure needs to be corrected for in situ pressure-temperature conditions by using the procedure suggested by Cermak (1989). A deep seismic sounding (DSS) study was carried out in the north Cambay basin from Dharimanna to Degam to delineate the crustal structure and velocity depth distribution (Kaila et al 1990). The Moho depth obtained from the DSS study is required for fixing the lower boundary of the model. In this case, the crustal structure up to Moho depth is clearly delineated between the Tharad and Degam portion of the DSS profile. Therefore, the present work deals with the estimation of temperature distribution along the DSS profile between Tharad and Degam only. Location of the profile is shown in figure 1.
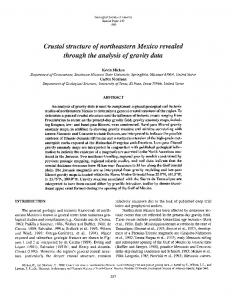
Volcanics of the Deccan traps form the basement (velocity 4.3--4.5 km/s) of Tertiary sediments and are faulted at several places by transverse faults. The depth to the basement varies from a minimum of 2 km at the Diyodar ridge to a maximum of 7.7 km in the Gandhinagar basin. Thickness of the upper crust is about 10 km in this region. The velocity up to the basement varies between 2.1 and 4.5 km/s and in the upper crust, it varies between 5.9 and 6.3 km/s. The upper crust is underlain by a low velocity zone of about 2 km thickness in which the velocity is about 5.5 km/s. This zone may have the presence of fluid released by metamorphic reaction at the lower crustal level. The lower crust of about 18--20 km thickness is composed of two sub layers. In the upper layer the velocity varies between 6.6 and 6.9 km/s up to 22--24 km depth and the lower layer is characterized with higher velocity in the range of 7.2--7.4 km/s. However, this high velocity is not found in the lower crust beneath the adjoining Deccan Trap covered areas of Saurashtra in its West, Narmada lineament in its East and Koyna region in its South (Kaila et al 1980, 1989; Krishna et al 1989). The presence of a high velocity lower crustal layer in the rift basin and its absence in the adjoining region indicates igneous accretion resulting from large-scale extrusion of volcanic lava due to mantle upwelling and rifting (White and McKenzie 1989). Moho depth varies between 31 and 33 km with velocity of 8.1 km/s (Kaila et al 1990). The crust is relatively thin within the Cambay basin as compared to thicker crust (35--42 km) in the adjoining region of Saurashtra and across the Narmada lineament (Kaila et al 1980, 1989). The high heat flow values within the basin is attributed to the presence of thin crust and mantle upwarping.
3. Mathematical modelling 2. Crustal structure and P-wave velocity-depth distribution The DSS study reveals a number of transverse faults tending ENE-WSW and E-W, which have dissected the basin into several blocks. Tectonic activity along these faults has led to development of ridges, swells and depressions, which serve as favourable structures for hydrocarbon accumulation. The basin between Tharad and Degam consists of three sub basins. These are: *
*
*
the South Sanchor basin between Tharad ridge and Diyodar ridge, the Patan basin between Diyodar ridge and Unhawa ridge, and the Gandhinagar basin from Unhawa ridge to the rest part of DSS profile.
The crustal structure and the Vp -depth distribution for this segment of DSS profile is shown in figure 2.
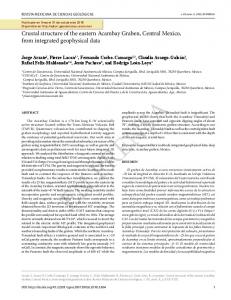
A schematic diagram of the model area representing a vertical cross section of crustal layers is shown in figure 3. Temperature field within the model is described by the following two-dimensional steady state heat conduction equation � � � � @ @T @ @T K þ K ¼ ÿAðX; ZÞ ð2Þ @X @X @Z @Z subject to boundary conditions given by at Z ¼ 0 ð3Þ T ¼ T0 @T ¼0 at X ¼ 0 and X ¼ L ð4Þ @X @T at Z ¼ D ð5Þ ¼ QD K @Z where T ðX; Z Þ is the variable temperature, T0 is the surface temperature (which is taken as zero for simplicity), K ðX; Z Þ is thermal conductivity; AðX; Z Þ is heat production, L and D are the length and depth
Thermal structure of Cambay basin
3
Figure 1. Location of DSS profile from Tharad to Degam in the north Cambay basin.
of the model under consideration, respectively. QD is the heat flow at the base of the model, and X and Z are the orthogonal coordinates in horizontal and vertical directions, respectively. In order to solve this boundary value problem for the calculation of temperature distribution one should know the values of all the controlling parameters such as K ðX; Z Þ, AðX; Z Þ, L, D, QD etc. appearing in equations (1) to (4). The radiogenic heat generation
AðX; Z Þ is considered as the only heat source within the crust. The values of AðX; Z Þ below 12 km depth up to Moho is obtained by converting the Vp values into AðX; Z Þ value using the relationship between these two parameters given by equation (1). These values of AðX; Z Þ obtained by this procedure are further corrected for in situ pressure and temperature conditions by using the procedure suggested by Cermak (1989). These values of AðX; Z Þ which range
4
S. Thiagarajan et al
Figure 2. Crustal layers with Vp -velocities distribution (modified after Kaila et al (1991)).
between 0.482 and 0.024 mW/m3 were then assigned within the model area in accordance with the distribution of corresponding Vp values obtained from the DSS studies. However, this conversion relationship between Vp and AðX; Z Þ is not applicable in the upper crustal layer because the tectonic structure of this part of the crust is highly complicated due to the presence of micro cracks which facilitate the redistribution of radioactive elements by groundwater movement. This may have considerably altered the original distribution of radioactive content of rocks (Cermak 1989). The geological formations above the basement mainly consist of shale, silt, slate and sandstone. Therefore, the weighted mean of the AðX; Z Þ values of these rocks which is 2.0 mW/m3 is assigned up to the basement (Pandey 1981). The average value of AðX; Z Þ for the crustal layer between basement and 12 km depth is taken as 1.6 mW/m3 (Gupta 1981). Since the heat production in the upper mantle is very
small, a value of AðX; Z Þ equal to 0.01 mW/m3 is assigned in the region below the Moho up to the model depth D, which is taken as 35 km (Safanda et al 1992). Distribution of heat production values, A, are shown in figure 4. Practically the heat flow value at the base of the model QD is taken as the Moho heat flow value because the contribution of heat production from the region lying between the Moho and model depth is very small. Thermal conductivity value is different for different rocks because of their different compositions. Three different average values of K for different layers have been considered. These are: 2.7 W/mK for upper crust up to a depth of 12 km, 2.1 W/mK for the lower crust up to Moho and 2.5 Wm/K below the Moho (Gupta 1981). The Moho heat flow, QD is also an important parameter required for the calculation of the temperature field. In order to compute QD and subsequently the temperature distribution the boundary
Thermal structure of Cambay basin
Figure 3. Schematic representation of the model with boundary conditions.
Figure 4. Distribution of heat production values (mW/m3)
5
6
S. Thiagarajan et al
Figure 5. Calculated isotherm (in � C) (continuous line) along with the crustal layer (dotted line).
value problem represented by equations (2)--(5) is solved by using a finite element based numerical program called NISA. For this purpose the entire region of the model is divided into a network of four nodes quadrilateral elements with 10 km length in Xdirection. The width of these elements in Z-direction is 200 m up to 5 km and 1 km below it. A smaller grid size up to 5km depth is considered for detailed investigation of temperature variation within the sedimentary layer. The numerical values of K and AðX; Z Þ are assigned to each element. The value of QD is estimated by making a judicious selection of its value using trial and error method for which the computed value of surface heat flow matches well with the observed average value of surface heat flow i.e. 83 mW/m2. The value of QD obtained by this procedure is 58 mW/m2. The corresponding temperature distribution for this value of QD is the desired temperature distribution within the model.
4. Numerical results and concluding remarks Based on calculated temperature distributions isotherms are plotted in figure 5 at intervals of 100� C, which represent 2-D crustal thermal structure of the region along the DSS profile from Tharad to Degam under consideration. The result shows that the Curie isotherm, which is the isotherm of approximately 550� C, lies approximately at 22 km depth. This is �4 km more than that estimated by Negi et al (1987). In general the Moho temperature is found to be �900� C with a maximum of 920� C at Tharad and a minimum of 860� C at Degam. The Moho heat flow value is found to be 58 mW/m2, which is 9 mW/m2 less than that estimated by Negi et al (1987). This is because they have estimated the value of QD simply by subtracting the contribution of heat production from upper crust up to 10 km depth
Thermal structure of Cambay basin
7
Figure 6. Calculated surface heat flow along the profile.
considering uniform heat production value equal to 1.6 mW/m2 from the observed surface heat flow value which is 83 mW/m2. They have ignored the contribution of heat generation from the crustal layer below 10 km depth. Surface heat flow value calculated along the profile is found to vary between 82.5 and 84 mW/m2 and is plotted in figure 6. Maximum decrease in the surface heat flow value is noticed at two places near Diyodar and between Patan and Mehsana. These two places are characterized with the thin sedimentary layer because of the presence of Diyodar and Unhawa ridges.
Only one observed surface heat flow value equal to 80 mW/m2 is available along the profile near to the Mehsana. This value is found in close agreement with the calculated value equal to 82.5 mW/m2. This result also supports the validity of the present model. Figure 7 shows the temperature-depth distribution at Mehsana. In general the temperature gradient for the northern Cambay basin is found to be 30� C/km. Crustal deformation plays an important role in controlling many tectonic processes and the role of temperature is significant in crustal deformation because rocks lose their strength with the increase in temperature and behave differently in response to applied forces. Therefore, the knowledge of crustal thermal structure can be used for geodynamic studies. The temperature field is associated with the maturation of hydrocarbon. Therefore, a knowledge of temperature-depth distribution can provide vital clues in the reappraisal of the hydrocarbon deposits in the basin.
Acknowledgements Authors are grateful to Dr. A Manglik for his valuable suggestions and Dr. Harsh K Gupta, Director, N.G.R.I. for granting permission to publish this work. Thanks are also due to Mr. Jaya Rama Rao for the preparation of the location map.
References
Figure 7. Temperature-depth distribution at Mehsana.
Besse J and Courtillot V 1988 Paleogeographic maps of the continents bordering the Indian Ocean since the Early Jurassic; J. Geophys. Res. 93 11791--11808
8
S. Thiagarajan et al
Biswas S K 1982 Rift basins in western margins of India and their hydrocarbon prospects with special reference to Kutch basin; Am. Assoc. Petrol. Geol. 66 1497--1513 Biswas S K 1987 Regional tectonic framework, structure and evolution of western margins of India; Tectonophysics 135 305--327 Cermak V 1989 Crustal heat production and mantle heat flow in central and eastern Europe; Tectonophysics 159 195--215 Furlong K P and Chapman D S 1987 Crustal heterogeneities and thermal structure of the continental crust; Geophys. Res. Lett 14 314--317 Gupta M L 1981 Surface heat flow and igneous intrusion in the Cambay basin, India; J. Volcano and Geotherm. Res. 10 279--292 Kaila K L, Tewari H C and Sarma P L N 1980 Crustal structure from deep seismic sounding studies along Navibandar-Amreli profile in Saurashtra; Mem. Geol. Soc. India 3 218--232 Kaila K L, Rao I B P, Koteswara Rao P, Madhava Rao N, Krishna V G and Sridhar A R 1989 DSS studies over Deccan Traps along the Thuadara-Dendhwa-Sindad profile across Narmada-Son lineament, India, in Properties and Processes of the Earth’s Lower Crust, (eds) R F Mereu, St. Mueller, and D M Fountain, (Washington, DC, AGU Monogr. 51, IUGG 6), pp. 127--141 Kaila K L, Tewari H C, Krishna V G, Dixit M M, Sarkar D and Reddy M S 1990 Deep seismic sounding studies in the north Cambay and Sanchor basin, India; Geophys J. Int. 103 621--637 McKenzie D P and Slater J G 1971 The evolution of the Indian Ocean since the Late Cretaceous; Geophys. J. R. Astr. Soc. 25 437--528 Merh S S 1995 Geology of Gujarat; Bangalore, India: Geological Society of India
Mishra D C, Gupta S B and Tiwari V M 1998 A geotransect from Dharimanna to Billimora across the Cambay and Narmada-Tapti rift basins, India; International Geology Review 10 1007--1020 Morgan W J 1981 Hotspot tracks and the opening of the Atlantic and Indian Oceans; In: The Sea, Vol 7, The Oceanic Lithosphere (ed) C Emiliani, (New York: John Wiley) pp. 443--487 Negi J G, Agrawal P K and Pandey O P 1987 Large variation of curie depth and lithospheric thickness beneath the Indian subcontinent and a case for magnetothermometry; Geophys. J. R. Astr. Soc. 88 763--775 Pandey O P 1981 Terrestrial heat flow in New Zealand. Ph.D, Thesis, Victoria Univ. Wellington, New Zealand Rybach L and Buntebarth G 1984 The variation of heat generation, density and seismic velocity with rock type in the continental lithosphere. In: Terrestrial heat flow studies and the structure of the lithosphere, (eds) V Cermak, L Rybach and D S Chapman, Tectonophysics 103 335-344 Safanda J 1985 Calculation of temperature distribution in two-dimensional geothermal profile; Studia Geoph. et Geod 29 191--207 Safanda J, Kashubin S and Cermak V 1992 Temperature modelling along the Taratashisky profile crossing the Ural mountains; Studia Geoph et Geod. 36 349--357 Verma R K, Gupta M L, Hamza V M, Venkateshwar Rao G and Rao R U M 1968 Heat flow and crustal structure near Cambay, Gujarat, India; Bull. Natl. Geophys. Res. Inst. 6(6) 153--166 White R S and McKenzie D P 1989 Magmatism at rift zones: The generation of volcanic continental margins and flood basalts; J. Geophys. Res. 94 7685--7729
MS received 15 December 2000; revised 27 February 2001