SELECTED ADDITIVES DID NOT IMPROVE FLOWABILITY OF DDGS IN COMMERCIAL SYSTEMS L. J. Johnston, J. Goihl, G. C. Shurson ABSTRACT. An experiment was conducted at a commercial, dry‐grind ethanol plant to determine if selected additives would improve flowability of dried distillers grains with solubles (DDGS). Main treatment effects were moisture content of DDGS (9 vs. 12% w.b.) and anti‐caking agent (ACA). The ACA treatments were: No additive (Control); a moisture migration control agent at 2.5 kg/metric ton (DMX‐7); calcium carbonate at 2% w.b. (Calcium carbonate); or a clinoptilolite zeolite at 1.25% w.b. (Zeolite). The ACA were added at the desired level to about 2,275 kg of DDGS using a vertical‐screw feed mixer. Batches of DDGS were weighed and loaded into one of eight compartments in an auger‐equipped feed truck. After loading, the truck traveled 250 km, sat motionless for at least 60 h, and traveled 250 km back to the ethanol plant. Time required to unload each compartment was recorded. There were no significant interactions between moisture level and ACA for any response criteria. Mean moisture levels were 9% and 11.6% for low and high moisture treatments. Flow rate of DDGS at unloading was higher (P < 0.01) for the 9% compared with 12% moisture level (620 vs. 390 kg/min). Flow rates of DDGS at unloading were: 509 (Control), 441 (DMX‐7), 512 (Calcium carbonate), and 558 (Zeolite) kg/min. None of the ACA created flow rates that differed significantly from Control. In conclusion, increasing moisture content from 9% to 11.6% clearly decreased flowability of DDGS. The ACA used in this experiment at the selected concentrations did not improve flowability of DDGS. Keywords. Flowability, DDGS, Angle of repose, Anti‐caking agents
T
he Energy Policy Act passed by the U. S. Congress in 2005 mandates that 7.5 billion gallons of renewable fuels be included in gasoline sold in the United States by the year 2012 (U.S. Environmental Protection Agency, 2008). This mandate has supported the rapid expansion of ethanol production in the United States. Ethanol production in 2008 is projected to be nearly 8 billion gallons (Renewable Fuels Association, 2008). Dried distillers grains with solubles (DDGS) is an important co‐product of ethanol production. About 7.2 kg of DDGS and 10.6 L of ethanol are produced from 25 kg of corn. Consequently, large quantities of DDGS are available for feeding livestock domestically and internationally. DDGS has many positive attributes for the feeding of livestock (University of Minnesota, 2008). Unfortunately, DDGS can have some undesirable handling characteristics related to poor flowability under certain conditions (Agricultural Utilization Research Institute (AURI) and Minn. Corn Growers Assoc., 2005; Bhadra et al., 2008). Reduced flowability, or the potential for reduced flowability of DDGS prevents the routine use of railcars for transport. Reduced flowability and bridging of DDGS in bulk storage containers and transport vehicles limits the use of DDGS for feeding
Submitted for review in May 2008 as manuscript number FPE 7496; approved for publication by the Food & Process Engineering Institute Division of ASABE in November 2008. The authors are Lee J. Johnston, Professor, West Central Research and Outreach Center, University of Minnesota, Morris, Minnesota; John Goihl, President, Nutritionist, Agri‐Nutrition Services, Inc., Shakopee, Minnesota; and Gerald C. Shurson, Professor, Department of Animal Science, University of Minnesota, St. Paul, Minnesota. Corresponding author: Lee J. Johnston, West Central Research and Outreach Center, University of Minnesota, 46352 Hwy 329, Morris, MN 56267; phone: 320‐589‐1711; fax: 320‐589‐4870; e‐mail:
[email protected].
livestock and poultry. Livestock producers and feed mills do not want to deal with the inconvenience and expense of handling a feedstuff that does not flow through their feeding and milling systems. Consequently, some pork producers have used DDGS in the past but have discontinued their use of DDGS due to poor flowability (J. Goihl, President, Agri‐Nutrition Services, personal communication). Flow is defined as “the relative movement of a bulk of particles among neighboring particles or along the container wall surface” (Peleg, 1977). Many factors influence the flow of a bulk material (Peleg, 1977) and there is no one measurement that adequately describes flowability (Bhadra et al., 2008). Consequently, characterization of and methods to improve DDGS flowability under controlled conditions have been slow. The AURI and Minn. Corn Growers Assoc. (2005) studied a limited number of DDGS samples under laboratory conditions. They reported that relative humidity greater than 60% seemed to reduce flowability of DDGS which was likely due to the product's ability to adsorb moisture. Ganesan et al. (2007) demonstrated that DDGS does adsorb water during storage. While moisture in the environment and moisture content of DDGS likely influence flowability, many other factors have been suggested as possible controllers of flowability such as particle size, content of solubles, dryer temperature, moisture content at dryer exit, and others (Ganesan et al., 2008a,b,c). Most interventions to improve flowability of DDGS have been limited to trial and error approaches within ethanol plants. These interventions relate to the completeness of fermentation, adjusting moisture content, and changing particle size, but have not been reported in the public domain. ILC Resources (Richard Bristol, Director of Nutrition and Technical Services, personal communication) investigated the utility of including 2% calcium carbonate in DDGS as a flowability agent. They reported a 6% to 12% reduction in the
Applied Engineering in Agriculture Vol. 25(1): 75‐82
E 2009 American Society of Agricultural and Biological Engineers ISSN 0883-8542
75
angle of repose determined in a laboratory setting when calcium carbonate was added to DDGS after drying. Determination of flowability under practical industry conditions was not attempted in their study. Similarly, Ganesan et al. (2008a) evaluated the addition of calcium carbonate to DDGS that contained varying concentrations of solubles and moisture in a laboratory setting. They reported reduced flowability of DDGS as concentration of solubles and moisture increased. Addition of calcium carbonate had no significant effect on flowability of DDGS. Because moisture and relative humidity seem to play an important role in flowability of DDGS, some have suggested use of zeolites and/or grain conditioners as a way of controlling moisture migration through DDGS. However, no controlled studies to evaluate this concept have been reported. Research results reported in the scientific literature have focused on studies conducted under tightly‐controlled conditions within laboratories. No studies have been reported that evaluate flowability of DDGS in commercial ethanol plants operating at typical production rates. Understanding the efficacy of interventions to improve DDGS flowability under such “real‐world,” commercial conditions would provide great value to the ethanol and feed milling industries. Consequently, we designed a study to determine if the addition of selected anti‐caking agents is effective in improving flowability of DDGS under practical commercial conditions. Our secondary objective was to identify physical and/or chemical characteristics of DDGS produced in a commercial ethanol plant that might be related to flowability of DDGS.
MATERIALS AND METHODS This experiment was conducted at a dry‐grind ethanol plant (BushMills Ethanol Inc., Atwater, Minn.) constructed in 2005. Experimental treatments were replicated on four separate days beginning on 1 September and ending on 27 October 2006. MOISTURE LEVEL AND ANTI‐CAKING AGENTS Treatments were imposed in a 2 × 4 factorial arrangement (eight total treatments). The main treatment effects were moisture content of DDGS (9% vs. 12% w.b.) and type of anti‐caking agent (ACA). The moisture treatments were selected to represent DDGS that was expected to flow readily (9%) and DDGS that was expected to present poor flowability (12%). The selected moisture levels are within ranges reported by Spiehs et al. (2002; 9.8% to 12.8% w.b.) and the University of Minnesota (2008; 7.6% to 13.8% w.b.) for DDGS samples collected from commercial ethanol plants. The ACA treatments were: 1. control; 2. a grain conditioner purported to control moisture migration (2.5 kg/metric ton, DMX‐7, Delst, Inc., Temecula, Calif.); 3. calcium carbonate (2% Unical‐P, ILC Resources, Inc., Des Moines, Iowa); and 4. a clinoptilolite zeolite (1.25% St. Cloud Zeolite, St. Cloud Mining Co., Winston, N. Mex.). The control was standard DDGS produced in the plant on a selected day with no ACA added. The ACA's were incorporated at the desired level to DDGS containing 9% or 12% moisture from the plant's stockpile. During the night shift prior to our arrival at 0900 h, the ethanol plant produced DDGS containing 9% or 12% (w.b.)
76
moisture and placed it in two separate stockpiles. Stockpiles were housed in the plant's warehouse and all experimental work was completed in the warehouse. At about 1000 h, we began applying ACA treatments to the DDGS. About 2,275 kg of DDGS was augered into a New Holland portable on‐farm grinder mixer (Model 358) by‐passing the grinding hammers and the appropriate ACA was added. This mixer was equipped with a single vertical screw in the mixing hopper and an electronic scale. Solid ACA's (calcium carbonate, zeolite) were added to DDGS through the hand‐add hopper and the hopper was flushed with DDGS. The liquid ACA (DMX‐7) was sprayed on DDGS with a garden hand sprayer as it exited the top of the vertical mixing screw. The DDGS and ACA were allowed to mix for 3 min after all the DDGS was added. Treated and control lots of DDGS were augered into one of eight individual compartments in an auger‐equipped feed truck. Weight of each lot at loading was recorded. Anti‐caking agents were applied to one moisture level of DDGS before switching to the other moisture level. Order of selecting moisture level and application of ACA's was random. Environmental temperature and relative humidity outside the warehouse was recorded every 10 min during the period that the truck was being loaded (about 4 to 6 h). Temperature of each lot of DDGS was recorded immediately after being placed in the truck. Once the truck was loaded on Friday afternoon, it traveled 250 km and sat motionless for about 60 hours over the weekend. On Monday morning, the truck traveled 250 km back to the ethanol plant where it was unloaded back into the warehouse. Speed of the unload augers was held constant for each compartment and across unloading days by operating the truck engine at a constant rpm. Time required to unload each compartment was recorded and flow rate (kg/minute) for DDGS in each compartment was calculated. The operator assigned a subjective flowability score (scale: 1 = free flowing; 10 = completely bridged) to each compartment based on the number of interventions (pokes, prods, blows to side of compartment) required to unload the compartment. The same truck and operator were used on four different days (4 loads total) which provided 32 truck compartments (4 loads × 8 compartments/load). Before the start of the experiment, each of the eight truck compartments used for the experiment were loaded with 2,275 kg of DDGS containing the same moisture content and no ACA's. The truck was immediately moved from the load‐out area to the warehouse and unloaded as described above. This provided a baseline unload rate of DDGS from each compartment under ideal conditions. This baseline rate was used to correct flow rate of experimental DDGS from each compartment to adjust for inherent differences in the truck which were unrelated to treatments. At the time of loading, a sample of DDGS was collected. Six samples (about 1.6 kg) of each lot were collected from throughout the lot as the DDGS fell into the feed truck compartment. Weight recorded for each lot loaded into the truck was adjusted to account for the amount of sample collected. Samples were thoroughly mixed by hand. Both drained and poured angle of repose measurements (McGlinchey, 2005) were recorded on each composite sample at the time of loading in a modified Hele‐Shaw cell. To measure drained angle of repose, about 8 kg of DDGS was placed in the top compartment of the modified Hele‐Shaw
APPLIED ENGINEERING IN AGRICULTURE
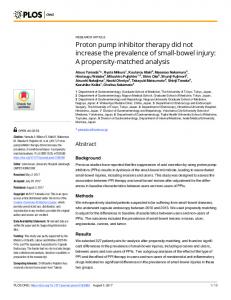
Figure 1. Modified Hele‐Shaw cell used to measure drained angle of re‐ pose (indicated by angle labeled “A”) and poured angle of repose (indi‐ cated by angle labeled “B”). See text for details of measurements.
cell (fig. 1) as it sat on a level surface. The trap door covering the opening in the floor of the top compartment was removed and the DDGS was allowed to drain into the bottom compartment. The angles labeled “A” were measured, averaged, and recorded as the drained angle of repose. To measure the poured angle of repose, the angles labeled “B” were measured and a mean value calculated. A subsample of each composite sample was placed in a sealed plastic bag and frozen at ‐20°C for subsequent analysis. Each sample was analyzed for moisture (AOAC Method 935.29), nutrient content [protein (AOAC Method 990.03), calcium (AOAC Method 985.01), phosphorus (AOAC Method 985.01), crude fiber (AOAC Method Ba6a‐05), crude fat (AOAC Method 945.16), ash (AOAC Method 942.05)], particle size (ASAE Standard S319), bulk density, residual sugars (AOAC Method 982.14), color (Hunter Labs methodology), and angle of repose. Drained angle of repose as described above was measured on DDGS samples after storage of DDGS samples for a minimum of 4 weeks. In addition, poured angle of repose was measured in a Hele‐Shaw cell and by the Carr method with the following modifications on all DDGS samples after storage. Poured angle of repose determined by the Carr method used a plastic funnel and no vibration. These characteristics of each DDGS sample were related to the measure of flowability recorded as flow rate at truck unloading. The PROC MIXED procedure of SAS (SAS Institute Inc., 2002, Cary, N.C.) was used to determine the effects of replicate day, and the effects of moisture level and ACA's on flowability. The statistical model to determine the effects of replicate day included day as a fixed effect. Since only one compartment was available in the truck for each combination of moisture level and ACA treatments, replicate day and treatments were confounded. The statistical model to determine the effects of treatments included: moisture level, ACA, and the moisture level by ACA interaction as fixed effects with replicate day as a random effect. Where necessary, treatment means were separated by Tukey's test protected to control the Type I error rate of multiple comparisons. Statistically significant differences were assumed when P < 0.05.
Vol. 25(1): 75‐82
DDGS CHARACTERISTICS AND FLOWABILITY To satisfy our secondary objective, we conducted two independent analyses to identify physical and/or chemical characteristics of DDGS that might predict flowability. The first analysis included a stepwise linear regression procedure (SAS Institute Inc., 2002, Cary, N.C.). In this analysis, flow rate of DDGS (kg/min) from the feed truck was the dependent variable and temperature and moisture content of DDGS at loading and unloading; particle size; acid detergent fiber concentration; neutral detergent fiber concentration; ash content; bulk density; Hunter L*, a*, and b* color scores; ambient temperature and humidity at the experiment site; flowability agent; and concentration of residual sugars were offered as independent variables. To enter the regression model, independent variables needed to be significant at P < 0.15. Independent variables that were significant at P < 0.10 after additional variables entered the model remained in the final model. The second analysis relied on a classification and regression tree (CART) procedure (Systat 12, Systat Software Inc., 2007, Chicago, Ill.) to identify DDGS characteristics that might predict flowability. Flow rate of DDGS from the feed truck was the dependent variable. The same independent variables offered to stepwise regression were also used as independent variables in the CART analysis. The flow rate of DDGS from the feed truck was predicted using a least squares fitting method with a minimum split index value of 0.05 and a minimum improvement in proportional reduction of error equal to 0.05.
RESULTS AND DISCUSSION MOISTURE LEVEL AND ANTI‐CAKING AGENTS As described above, this experiment was conducted on four separate days beginning 1 September 2006. The same truck was used on each day to control variation in unloading rate that would likely occur among different trucks. The necessity to standardize the truck used limited our ability to replicate treatment combinations (2 moisture levels by 4 ACA treatments yields 8 treatment combinations) within each experimental day since the feed truck contained only eight compartments. Consequently, experimental treatments and day are confounded which limits our ability to determine any interactive effects of ambient environmental conditions and flowability treatments. Environmental conditions and DDGS production conditions for each replicate day are presented in table 1. Logistical considerations with the feed truck owner and the ethanol plant dictated that replicate days be spaced at least 14 days apart. Obviously, there were differences in environmental temperature and humidity recorded just outside the warehouse where the experiment was conducted. However, addition rate of condensed distillers solubles (CDS) to the DDG before drying and dryer temperatures were relatively consistent across replicate days. This experiment was conducted during normal operations of the ethanol plant with only one intervention by the research team (different moisture levels). Consequently, addition rate of CDS and dryer temperatures were the conditions prevailing during the manufacture of DDGS used for this study and are offered for descriptive purposes.
77
Table 1. Production conditions on replicate days of the experiment (Mean ± Standard error of the mean). Day Item (°C)[a]
Outdoor temperature Outdoor humidity (%)[a] Condensed distillers solubles addition to DDG (l/min)[b] Dryer temperature ranges (°C)[b]: Entry Drop box [a] [b]
9/1/06
9/15/06
9/29/06
10/27/06
23.8 ± 1.68 67.1 ± 8.84 189
27.8 ± 0.92 34.2 ± 4.10 174
19.9 ± 2.85 42.1 ± 10.84 193
12.9 ± 3.13 42.5 ± 15.0 193
427 ‐ 455 94 ‐ 97
420 ‐ 463 93 ‐ 97
454 ‐ 460 100 ‐ 104
316 ‐ 464 103 ‐ 107
Mean of readings recorded every 10 min while the truck was being loaded (about 4 to 6 h). One observation per day collected from process control software at the ethanol plant.
The differences in environmental temperature apparently influenced temperature of the DDGS at loading (table 2). Moisture content (w.b.) of the DDGS averaged between the 9% and 12% treatments was not significantly different across replicate days at loading. There was no significant drying of the DDGS while it sat in the feed truck during the 60 h between loading and unloading because the moisture content at loading and unloading was very similar. There were no statistically significant differences in flow rate of DDGS across replicate days. We observed no significant interactions between moisture level of the DDGS and anti‐caking agents for any of the response criteria measured in this experiment. This suggests that the response to anti‐caking agents was similar regardless of the moisture content of the DDGS. Consequently, we will present only main effect means and no interaction means. Temperature of DDGS at loading was slightly higher for 9% DDGS compared with 12% DDGS; however, at unloading temperature was not different (table 3). As designed, the 9% DDGS contained significantly less moisture than the 12% DDGS. The production staff at the ethanol plant effectively controlled the moisture content of the DDGS and provided product that allowed true evaluation of the treatments
imposed in this study. Particle size of DDGS was smaller (P < 0.01) for the 12% DDGS compared with the 9% DDGS. This difference was unexpected and may have been a chance occurrence. One may speculate that quality and grind of the incoming corn influenced particle size of the resulting DDGS. However, Rausch et al. (2005) reported little correlation between particle size categories in ground corn and the resulting DDGS. Particle size of the DDGS in the present study was lower than that reported by Rausch et al. (2005) and Bhadra et al. (2008) but similar to that reported by Liu (2008). Unfortunately, these authors did not directly relate particle size to flowability of DDGS. Ganesan et al. (2005) stated that small changes in particle size will result in a significant difference in flowability of bulk materials. In a preliminary analysis of our data, particle size did not explain a meaningful proportion of the variation in flow rate when it was used as a covariate in the statistical analysis. This suggests that factors other than particle size, probably moisture level, were responsible for the reduced flow rate of the 12% DDGS. Flow rate and flowability score were clearly poorer (P < 0.01) for 12% DDGS compared with 9% DDGS. These results are supported by the recent work of Bhadra et al. (2008) in which flowability index of DDGS
Table 2. Characteristics and flow rate of DDGS used on replicate days of the experiment (Mean ± Standard error of the mean). Day Item No. of samples DDGS temperature (°C) at[b] Loading Unloading DDGS moisture (% w.b.) at[c] Loading Unloading Particle size (μ) Flow rate (kg/min)[d] Flowability score[e]
9/1/06
9/15/06
9/29/06
10/27/06
PSE[a]
8
8
8
8
--
32.5 ± 0.81a 23.9 ± 0.54x
32.0 ± 0.72a 26.4 ± 0.56y
27.4 ± 0.52b 24.3 ± 0.28x
23.7 ± 0.30c 18.1 ± 0.40z
0.62 0.46
0.001 0.001
10.4 ± 0.58 10.4 ± 0.61 632 ± 20.0 481 ± 34.4 --
9.8 ± 0.63 9.6 ± 0.67 584 ± 14.4d 577 ± 73.2 6.25 ± 0.99
10.8 ± 0.37 10.8 ± 0.34 636 ± 23.5 404 ± 28.2 6.50 ± 0.68
10.4 ± 0.42 10.4 ± 0.39 668 ± 23.9e 558 ± 61.0 3.75 ± 0.75
0.51 0.52 20.8 52.6 0.82
0.60 0.43 0.06 0.10 0.06
P