Published September 16, 2015
Journal of Environmental Quality
TECHNICAL REPORTS Landscape and Watershed Processes
Selecting Color-based Tracers and Classifying Sediment Sources in the Assessment of Sediment Dynamics Using Sediment Source Fingerprinting Louise R.M. Barthod, Kui Liu, David A. Lobb,* Philip N. Owens, Núria Martínez-Carreras, Alexander J. Koiter, Ellen L. Petticrew, Gregory K. McCullough, Cenwei Liu, and Leticia Gaspar
A
gricultural
nonpoint-source pollution can adversely affect surface water quality because inputs of nutrients such as phosphorus (P) and nitrogen (N) cause eutrophication, resulting in excessive plant growth, depletion of oxygen, and, as a consequence, changes in the abundance and diversity of organisms (Chambers et al., 2008). Over the past few decades, this phenomenon has been widely observed in Lake Winnipeg, Manitoba, Canada, the tenth largest freshwater lake in the world (23,750 km2) (Environment Canada, 2011). Indeed, lake water quality has significantly decreased since the mid-1990s, with a proliferation of algal blooms due to a recent and rapid increase in loading and concentration of P (Schindler et al., 2012). The Lake Winnipeg Basin drains ~1,000,000 km2, with nearly 65 million ha of farmland (65%), including parts of four Canadian provinces (Alberta, Saskatchewan, Manitoba, and Ontario) and four US states (Montana, North Dakota, South Dakota, and Minnesota). Agriculture in Manitoba contributes approximately 5% of the total N and 15% of the total P loading into Lake Winnipeg (1994–2001) (Lake Winnipeg Stewardship Board, 2006). Therefore, agricultural beneficial management practices (BMPs) have been implemented to minimize nutrient loading in Lake Winnipeg. Understanding the processes involved, such as the interactions of sediment with nutrients, is required to be able to evaluate the effectiveness of the proposed BMPs. Against this background, identifying the sources of sediment within agricultural basins across the Canadian Prairies plays an important role for the conservation of Lake Winnipeg
Abstract The use of sediment color as a fingerprint property to determine sediment sources is an emerging technique that can provide a rapid and inexpensive means of investigating sediment sources. The present study aims to test the feasibility of color fingerprint properties to apportion sediment sources within the South Tobacco Creek Watershed (74 km2) in Manitoba, Canada. Suspended sediment from 2009 to 2011 at six monitoring stations and potential source samples along the main stem of the creek were collected. Reflectance spectra of sediments and source materials were quantified using a diffuse reflectance spectrometry, and 16 color coefficients were derived from several color space models. Canonical discriminant analysis was used to reclassify and downsize sediment source groups. After the linear additive test and stepwise discriminant function analysis, four color coefficients were chosen to fit the Stable Isotope Analysis in R model. Consistent with the conventional fingerprinting approach, the color fingerprint results demonstrated a switch in the dominant sediment source between the headwaters and the outlet of the watershed, with the main sources being topsoil in the upper reaches, whereas outcrop shale and stream bank materials dominated in the lower reaches. The color fingerprinting approach can be integrated with conventional fingerprints (e.g., geochemical and fallout radionuclide properties) to improve source discrimination, which is a key component for source ascription modeling. We concluded that the use of color fingerprints is a promising, cost-effective technique for sediment source fingerprinting.
Core Ideas • Defining sources and testing the behavior of tracers are critical for sediment source apportionment. • The predominant sources of river sediment varied at different reaches of the study creek. • Integrating color and conventional fingerprinting techniques likely improves source apportionment. • Color fingerprinting is a promising, cost-effective technique for sediment source ascription.
Copyright © 2015 American Society of Agronomy, Crop Science Society of America, and Soil Science Society of America. 5585 Guilford Rd., Madison, WI 53711 USA. All rights reserved.
L.R.M. Barthod, K. Liu, D.A. Lobb, and C. Liu, Dep. of Soil Science and Watershed Systems Research Program, Univ. of Manitoba, 13 Freedman Crescent, Winnipeg, MB, R3T 2N2, Canada; P.N. Owens and L. Gaspar, Environmental Science Program and Quesnel River Research Centre, Univ. of Northern British Columbia, 3333 University Way, Prince George, BC, V2N 4Z9, Canada; N. Martínez-Carreras, Centre de Recherche Publique– Gabriel Lippmann, Dep. of Environment and Agro-Biotechnologies, 41 rue du Brill, L-4422 Belvaux, Luxembourg; A.J. Koiter, Natural Resources and Environmental Studies Program, Univ. of Northern British Columbia, 3333 University Way, Prince George, BC, V2N 4Z9, Canada; E.L. Petticrew, Geography Program and Quesnel River Research Centre, University of Northern British Columbia, 3333 University Way, Prince George, BC, V2N 4Z9, Canada; G.K. McCullough, Centre for Earth Observation Science, Dep. of Environment and Geography, 482 Wallace Bldg., Univ. of Manitoba, Winnipeg, Canada R3T 2N2. Assigned to Associate Editor Kevin McGuire.
J. Environ. Qual. 44:1605–1616 (2015) doi:10.2134/jeq2015.01.0043 Received 27 Jan. 2015. Accepted 12 May 2015. *Corresponding author (
[email protected]).
Abbreviations: BMP, beneficial management practice; CIE, Commission Internationale de l’Eclairage; DFA, discriminant function analysis; FRN, fallout radionuclide; RI, Redness Index; SIAR, Stable Isotope Analysis in R; STCW, South Tobacco Creek Watershed.
1605
because the sources of sediment are likely to influence its contaminant loading. Fingerprinting techniques can be used to distinguish the sources of sediment and apportion their contributions within a watershed, and as such there has been a rapid growth in studies using fingerprinting to address a range of questions in watersheds throughout the world (Walling, 2005; Walling, 2013). A variety of radiochemical, biogeochemical, and physical properties have been successfully used worldwide in the application of environmental fingerprinting techniques, such as geochemistry and/or radiochemistry (e.g., Foster and Walling, 1994; Collins et al., 1997), mineral magnetism (e.g., Walden et al., 1997), particle size (e.g., Stone and Saunderson, 1992), and more recently soil color (e.g., Martinez-Carreras et al., 2010a; Martinez-Carreras et al., 2010b) and infrared spectroscopy (e.g., Poulenard et al., 2009; Evrard et al., 2013; Brosinsky et al., 2014b; Verheyen et al., 2014). However, very limited research using these techniques has been performed in the Lake Winnipeg Basin despite a pressing need for information on sediment and associated nutrient sources. A recent study (Koiter et al., 2013a) using geochemical and fallout radionuclide (FRN) fingerprints in the South Tobacco Creek Watershed (STCW), Manitoba, produced valuable insights about the development of this technique. In this watershed, a switch in the predominant source of sediment between the headwaters and the watershed outlet was observed, highlighting the importance of the sampling location in relation to the scale and geomorphic connectivity of the watershed. However, this technique, which uses geochemical and FRN fingerprint properties, is highly labor intensive and costly, and there is a need to develop rapid and inexpensive means of investigating sediment sources, especially from a watershed management perspective. Color-based fingerprints used to quantify sediment sources successfully in small-to-medium scale catchments (e.g., MartinezCarreras et al., 2010a; Martinez-Carreras et al., 2010b; Brosinsky et al., 2014a; Brosinsky et al., 2014b; Verheyen et al., 2014) or during runoff events in headwater catchments (e.g., Legout et al., 2013) could provide a rapid, inexpensive, and straightforward method to investigate sediment sources. Soil color is commonly described quantitatively using a Munsell soil color chart (Munsell Color Company, 1975), which is intuitively designed to reflect our perception of color and its variations (Viscarra Rossel et al., 2006). However, the values obtained using this approach do not represent a continuous physical variable and, as a consequence, cannot be used as a fingerprint property. Color is a three-dimensional phenomenon (Hunt and Pointer, 2011) and can be represented in color space models whereby individual colors are specified by points in these spaces. Those parameters are continuous physical variables that can be used to describe soil color and thus can be used to quantify the sources of sediment in the application of sediment source fingerprinting. To a large extent, the color-based fingerprinting approach has failed to discriminate sediment sources unambiguously in medium- and large-sized catchments (Martinez-Carreras et al., 2010a) where heterogeneous pedology and geology as well as intrasource variability and source overlap are observed. Yet, this approach has been typically based on suspended sediment samples collected at the catchment outlet only and therefore does not fully address the influence of 1606
basin topography, geomorphology, and connectivity on sediment dynamics. However, it is now well known that only a fraction of sediment eroded within a catchment will reach the basin outlet (Fryirs, 2013). Considering the (dis)connectivity and storage that could occur throughout the watershed (Fryirs, 2013), it is important to fully understand the sediment dynamics and to determine the sediment sources at various scales. With the exception of Martinez-Carreras et al. (2010a) and Verheyen et al. (2014), there have been no attempts to test the color-based fingerprints at a variety of scales in medium- and large-sized catchments despite recognition of the need for this (Brosinsky et al., 2014a). The present study explored the potential of color-based fingerprints as a means of apportioning sediment contributions at a variety of scales in STCW. The results are compared with the findings of the “conventional” geochemical and FRN fingerprinting approach undertaken in the same watershed (Koiter et al., 2013a) to assess the efficiency of color parameters as fingerprint properties, particularly their feasibility to detect changes in the predominant sources along the study creek.
Materials and Methods Study Area The STCW (74.4 km2) lies within the Lake Winnipeg Basin and is situated approximately 100 km southwest of Winnipeg (Fig. 1). The STCW has been the subject of several scientific projects exploring the effects of small dams, reservoirs, and agricultural BMPs on water and air quality, hydrology, runoff, soil erosion, and nutrient and sediment losses (e.g., Rawn et al., 1999; Li et al., 2007; Tiessen et al., 2010; Li et al., 2011; Tiessen et al., 2011; Liu et al., 2013). Within the STCW, three physiographic regions can be distinguished from west to east: (i) the upper reaches (above 410 m), which lies in the undulating glacial tills; (ii) the Manitoba Escarpment (between 410 and 320 m), where the elevation drops nearly 90 m in less than 5 km; and (iii) the lower reaches (below 320 m), which lies in the lacustrine sediments of glacial Lake Agassiz (Fig. 2). Soils are primarily clay loams formed on moderately to strongly calcareous glacial till that overlay Cretaceous shale bedrock (Agriculture and AgriFood Canada, 2013). The South Tobacco Creek flows across the Manitoba Escarpment descending over 200 m, incising the escarpment and exposing the underlying shale bedrock. Because the point of incision (the “knick point”) migrates upstream, it has produced steep valley walls and actively eroding cut-bank shale bedrock outcrops along the channel, some exceeding 20 m in height (Koiter et al., 2013a). Although the main outcrop is located in the middle of the watershed, there are also small outcrops in the headwaters. This shale is friable and can easily be broken down into fine-grained sediments under the effects of fluvial processes as well as freeze-thaw and wetting-drying cycles and as such potentially represents an important source of sediment (Koiter et al., 2013a). At Miami, the outlet of the STCW, the South Tobacco Creek drains into the Tobacco Creek, which flows north into Lake Winnipeg (Fig. 1). Agriculture accounts for 74% of land use in the STCW. Forests cover 25% of the watershed and are mostly limited to Journal of Environmental Quality
Fig. 1. Overview of the Tobacco Creek Watershed (Manitoba) and in-stream monitoring stations.
valley walls that are unsuitable for cultivation. The remainder is mostly urban/transportation areas and surface water (1%) (Land Cover 2010 using LiDAR imagery) (Melvin, 2010). The climate of the study area is classified as continental subhumid and has warm summers and cold winters (range, -30°C to +30°C). The mean annual precipitation (1971–2000, Environment Canada weather station, Deerwood) is estimated to be 566 mm, with 27% occurring as snowfall (151 cm). The average temperature for the same period is 3°C, with monthly average temperatures below 0°C from November to March (Environment Canada, 2013a). Along the study stream, daily discharge was measured at two gauging stations operated by the Water Survey of Canada (WSC) (Environment Canada, 2013b). One station is below the escarpment (site 4, WSC 05OF023), and the other is at the STCW outlet (site 6, WSC 05OF017) (Fig. 1). The high discharges occur during the snowmelt (April) and major rainfall
events (May–July) (Fig. 3). Twenty-six small dams and reservoirs were constructed between 1985 and 1996 in the headwaters to reduce peak flows and flooding (Agriculture and Agri-Food Canada, 2012). Moreover, significant natural damming occurs throughout the watershed due to beavers (Castor canadenis), which contributes to the modification of the hydrology of the watershed. The STCW presents heterogeneous climatic, topographical, geomorphological, and hydrological characteristics that may influence the sediment dynamics throughout the watershed. To better appreciate this phenomenon, six sediment monitoring stations were established along the main stem of the creek (Fig. 1) to provide information on the sediment sources at various spatial scales.
Fig. 2. Longitudinal profile of the South Tobacco Creek and the Manitoba Escarpment across South Tobacco Creek Watershed (modified from Koiter et al., 2013a). Journal of Environmental Quality 1607
have collected small-volume water samples and have used the sediment retained on filter papers for analysis (e.g., MartinezCarreras et al., 2010b; Brosinsky et al., 2014b). Based on field observations and previous work in STCW (Koiter et al., 2013a), three main potential sources of sediment were identified for each site: (i) topsoil from agricultural fields, riparian areas adjacent to the creek and forested valley walls; (ii) unconsolidated material from surface and subsurface stream banks; and (iii) shale bedrock material exposed along the stream channel. Topsoil was collected immediately upstream from each in-stream monitoring station (Fig. 1). At each site, transects were established along several toposequences parallel to the dominant slope gradient, extending from the edge of the stream bank into the adjacent fields through the riparian area. Each transect was comprised of four to eight sampling points, representing topsoil sources from agricultural fields, riparian areas, and/or forest valley walls. At each sampling point, the surface horizon (A horizon) was sampled over its full depth (using a 3.18-cm-diameter soil probe) to characterize surface soils. In a cultivated landscape, the surface soil is regularly mixed, leading to difficulties in identifying the material “likely to be mobilized by erosion.” In fact, the likely eroded material is often applied in fingerprinting studies (e.g., Collins et al., 1997; Russell et al., 2001; Martinez-Carreras et al., 2010b). Because the identification of sampling areas that are susceptible to erosion and are well connected to the channel is subjective (Koiter et al., 2013a), a systematic approach was adopted based on the characterization of surface soils along a transect. A total of 29 composite topsoil samples were analyzed (Table 2). Multiple stream bank samples were also collected upstream from the in-stream monitoring stations. At each site, three sampling points were defined. For each of these sampling points, stream bank samples were collected at 5- or 10-cm incremental depths along the bank profile (for a total depth ranging between 40 and 170 cm) using a box-core sampler inserted perpendicular to the stream bank face. A total of 117 stream bank samples (collected from five sites) were analyzed (Table 2). In the Manitoba Escarpment, three representative large bedrock outcrops were sampled between sites 3 and 4 (STCS4-OC10, 15 m high); between sites 4 and 5 (STC-S3-OC4, 8 m high), and between sites 5 and 6 (STC-S2-OC11, 13 m high) (Fig. 1). The bedrock outcrops consist of very friable shale, which enables the collection of outcrop samples similarly to the collection of stream bank samples. A total of 38 outcrop samples were collected from the different layers of bedrock (Table 2). The outcrop samples were pulverized and ground to a powder using a mortar and pestle.
Fig. 3. Daily discharge at two sites in the South Tobacco Creek Watershed (site 4: south branch of the South Tobacco Creek near highway 240; site 6: south Tobacco Creek at Miami) (source data: Environment Canada, 2013b).
Collection and Preparation of Sediment and Source Samples Samples of suspended sediment were collected at each instream monitoring station (Fig. 1) using a passive time-integrated sediment sampler following the design of Phillips et al. (2000). In brief, the samplers work on the principle that the reduced flow velocity of water entering the large chamber promotes settling of sediment (for details, see Phillips et al. [2000]). At sites 1, 2, 4, 5, and 6, suspended sediment samples were collected between 2009 and 2011; site 3 was added in 2011. The drainage areas for sites 1, 2, 3, 4, 5, and 6 are 44, 188, 1600, 3645, 6644, and 7441 ha, respectively. At each site, two samplers were installed during the ice-free period (Apr.–Nov.). The samplers were regularly inspected for maintenance, and the suspended sediment samples were collected two or three times per year, depending on the magnitude and duration of the major flow periods. The slurry of sediment and water collected from the samplers was allowed to settle, and then the water was decanted for sediment collection. The suspended sediments were air-dried and disaggregated by hand with a marble roller or gently with a mortar and pestle. For each site, the sediment samples from the two samplers were combined before analysis. Particle-size distributions of the physically disaggregated sediment were measured using laser diffraction (Mastersizer 2000, Malvern) in the range of 0.02 to 2000 mm. For each site, the grain-size composition of suspended-sediment samples was predominantly 0.05) were eliminated from the dataset. Because the Stable Isotope Analysis in R (SIAR; v 4.2) model (Parnell et al., 2010; discussed in detail below) assumes that each fingerprint property of both source and sediment is “reasonably” normally distributed, each individual parameter was tested for normal distribution for each source using the Shapiro–Wilk test. Violating the assumption of normality may result in a misrepresentation of the fingerprint variability in the SIAR mixing model; thus, color variables violating normality were excluded in the further analyses. A discriminant function analysis (DFA) and a stepwise DFA were performed on the normally distributed color variables to select composite fingerprints for the SIAR model. A DFA was used to assess the individual discrimination power of each or multiple color coefficient by determining the number of samples correctly classified into the source groups using leave-one-out cross validation (Reimann et al., 2008). After investigating the individual discrimination power of each color coefficient, a forward stepwise DFA based on the Wilk’s lambda criterion was performed to determine the best combination of variables (color coefficients) in discriminating source groups without redundant information. Discriminant function analysis and stepwise DFA (niveau = 0.05) were performed using R packages (MASS and klaR) (Venables and Ripley, 2002; Weihs et al., 2005).
Source Ascription Modeling The source contributions to the sediment load were estimated at each in-stream monitoring station using SIAR (v 4.2) available as an open source R package developed for ecological studies (Parnell et al., 2010). Recently, SIAR has been used to determine the sources of sediment using geochemical and radionuclide fingerprints (e.g., Dutton et al., 2013; Koiter et al., 2013a). The model assumes that each sediment fingerprint property comes from a Gaussian distribution with an unknown mean and standard deviation. The weights are source proportions, which are given a Dirichlet prior distribution. The Dirichlet prior
Table 3. Source description based on watershed physiography, landscape feature and reclassification using canonical discriminant analysis and number of samples in the South Tobacco Creek Watershed. Physiography Outcrop Within and below the escarpment (sites 4, 5, and 6)
Above the escarpment (sites 1 and 2)
1610
Source description Landscape feature A1 outcrop shale materials B1 subsurface stream bank materials B2 surface (0–5 cm) stream bank materials B3 field topsoil B4 riparian area topsoil C3 field topsoil C4 topsoil from riparian area and forest valley wall C1 subsurface stream bank materials C2 surface (0–5 cm) stream bank materials
Reclassification source 4 (A1) source 3 (B1-B2)
source 1 (B3-B4-C3-C4) source 2 (C1-C2)
Number of samples 38 77 8 5 9 8 7 26 6
Journal of Environmental Quality
distribution default given by SIAR was used; it is designed to be vague so that the results are primarily influenced by the data. Model fitting is via Markov chain Monte-Carlo, which produces simulations of plausible values of the relative contributions of the different sources. Because stream bank materials within and below the escarpment were substantially different than above the escarpment, they were treated as two separate sources. In practice, sediment sources in the lower reaches should not contribute sediments sampled in the upper reaches. Therefore, stream bank materials within and below the escarpment (source 3) were excluded in the model when determining the source contribution at sites 1 and 2, which are located above the escarpment. The source contribution to the suspended sediment at each station was estimated separately using the SIAR model. The model was run using 200,000 iterations with a burn-in of 50,000. The trophic enrichment and concentration dependence factors, used for ecological study Parnell et al., 2010), were omitted, in agreement with other similar studies (Koiter et al., 2013a). Some studies have included particle size, organic matter, and conservativeness correction factors in the mixing model formulation (e.g., Walling and Woodward, 1995; Collins et al., 1997; Walling et al., 1999; Gruszowski et al., 2003; Motha et al., 2003). However, regarding the complexity of the relationships between tracer concentration and grain size (Russell et al., 2001) as well as organic matter content highlighted by these studies, no correction factors were applied, following the recommendations of Martinez-Carreras et al. (2010a), Smith and Blake (2014), and Verheyen et al. (2014).
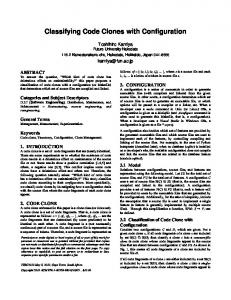
Fig. 4. Root mean square error normalized by the mean for all 16 color fingerprint properties.
by plotting the first discriminant function against the second discriminant function. On this two-dimensional scatterplot (Fig. 5b), the outcrop shale materials (A1) are easily distinguishable from the other three sources. Both the outcrop shale materials and stream bank materials within and below the escarpment originated from the local sources, explaining the close relationship between these two sources, as shown in Fig. 5. The topsoil above the escarpment is different from the topsoil within and below the escarpment because the former is partially from external sources as a result of ancient glacial deposits. However, the topsoil cannot be distinguished based on physiography and origins (e.g., above and below the escarpment) as indicated by the scatter plot of the first two discriminant functions, suggesting
Results and Discussion Linearly Additive Behavior of Color Coefficients The normalized RMSE values by the mean for each color coefficient are presented in Fig. 4. The x, y, and h coefficients showed strong linearly additive properties with the lowest normalized RMSE (