Clinical Chemistry 48:9 1526 –1538 (2002)
Laboratory Management
Selection, Preparation, and Characterization of Commutable Frozen Human Serum Pools as Potential Secondary Reference Materials for Lipid and Apolipoprotein Measurements: Study within the Framework of the Dutch Project “Calibration 2000” Christa Cobbaert,1,2* Cas Weykamp,3 Henk Baadenhuijsen,4 Aldy Kuypers,4 Jan Lindemans,2 and Rob Jansen5
Background: The Dutch project “Calibration 2000” aims at harmonization of laboratory results via calibration by development of matrix-based secondary reference materials. We considered the selection, preparation, and characterization of 34 potential reference materials (PRMs). Methods: Sixteen PRMs were prepared either strictly according to the NCCLS C37-A protocol or in a less stringent and more convenient way. In addition, 18 commercial, so-called human serum-based calibrators or controls were purchased and tested. Lipoprotein integrity was evaluated by examining the physicochemical characteristics of the materials. Commutability of the PRMs was assessed in 86 Dutch clinical laboratories, using a multicenter split-patient-sample between-fieldmethod (twin-study) design. Normalized residuals of the PRMs with respect to the patient regression lines were calculated; in addition, the extra contribution of each PRM to the total measurement uncertainty (CVNetto) was calculated. On the basis of these results, the most native PRM was selected to investigate its
potential to reduce interlaboratory variation and to improve lipid and apolipoprotein standardization. Results: In general, only the NCCLS C37-A-type materials displayed normalized residuals below the decision limit for commutability and had small CVNetto values ranging between 0 and 3.8%. This contrasts with the findings in regularly pooled frozen sera and lyophilized cryoprotected PRMs. In two subsequent external quality assessment surveys, the NCCLS type C37-A materials contributed to reducing the intermethod lipid and (apo)lipoprotein variation to ⬃2– 4%. Conclusions: NCCLS C37-A materials have a strong potential as secondary reference materials, not only for cholesterol but also for HDL-cholesterol, LDL-cholesterol, triglyceride, and apolipoprotein measurements. © 2002 American Association for Clinical Chemistry
In The Netherlands, the latest revision of the Dutch cholesterol consensus takes into account the cholesterol/ HDL-cholesterol (HDL-C)6 ratio, in addition to classic risk factors such as hypertension, diabetes mellitus, and family history, for determining the absolute risk for individuals to develop coronary heart disease within the next
1
Amphia Hospital, 4819 EV Breda, The Netherlands. Lipid Reference Laboratory, University Hospital Rotterdam, 3000 CA Rotterdam, The Netherlands. 3 Queen Beatrix Hospital, 7100 GG Winterswijk, The Netherlands. 4 Dutch Foundation for Quality Assessment in Clinical Laboratories (SKZL), University Hospital Nijmegen, 6500 HB Nijmegen, The Netherlands. 5 St. Anna Hospital, 5660 AB Geldrop, The Netherlands. *Address correspondence to this author at: Amphia Hospital, Langendijk, Department of Clinical Chemistry, Langendijk 75, 4819 EV Breda, The Netherlands. Fax 31-76-5277043; e-mail
[email protected]. Received September 4, 2001; accepted May 8, 2002. 2
6 Nonstandard abbreviations: HDL-C and LDL-C, HDL- and LDL-cholesterol; apo A-I and B, apolipoprotein A-I and B; EQAS, external quality assessment scheme; PRM, potential reference material; NCEP, National Cholesterol Education Program; CHOD-PAP, cholesterol oxidase–phenol aminophenazone, GPO-PAP, glycerophosphate oxidase–phenol aminophenazone; SKZL, Dutch Foundation for Quality Assessment in Clinical Laboratories; Lp(a), lipoprotein(a); SDSA, state-of-the-art within-laboratory SD; and MAB, mean absolute bias.
1526
Clinical Chemistry 48, No. 9, 2002
decade (1 ). To correctly diagnose and treat patients at risk, clinical laboratories should have acceptable analytical performance. Because of this increased demand for measurement of blood lipids and apolipoproteins in medical practice, precise and accurate assays are warranted. A very widely held view is that the desirable bias should be ⬍0.25(CV2intraindividual ⫹ CV2interindividual)1/2 and that the desirable imprecision is ⬍0.50(CVintraindividual). Performance guidelines for serum lipids have been published in the last decade (2–5 ); those for apolipoprotein (apo) A-I and B can be deduced from biological variation data. Standardization may be achieved in two ways: (a) manufacturers could produce calibrators that mimic patient sera and that are traceable to reference methods of a higher metrologic order; and (b) proficiency testing providers or external quality assessment (EQA) societies could periodically include native human serum pools in the EQA surveys that are commutable and have been value assigned. To our knowledge, few proficiency testing providers and EQA societies have used pools that mimic patient sera across different methods (6, 7 ) because the collection procedure, the pool preparation and stabilization process, and the lyophilization or freezing process decrease lipoprotein integrity. Adding sucrose has been demonstrated to help to a certain extent, by cryoprotecting lipoproteins during lyophilization (8 ). Recently, our group has been successful in preparing lyophilized, sucrose-containing candidate reference materials that are promising for harmonizing cholesterol methods and potentially for homogeneous HDL-C methods (9, 10 ). In the context of the Dutch project “Calibration 2000” (11–13 ), the Lipid Task Force aimed at nationwide standardization of serum/plasma lipids [cholesterol, HDL-C, LDL-cholesterol (LDL-C), and triglycerides] and apolipoproteins (apo A-I and B) beyond the year 2000. It was reasoned that, to that end, a native human reference material would be the best choice. Therefore, human potential reference materials (PRMs; n ⫽ 16), which were processed to various degrees and which were expected to produce equal results across different methods (wet and dry chemistry methods; heterogeneous and homogeneous methods), were developed; in addition, human serumbased calibrators and controls, stated to be of high quality, were purchased from manufacturers (n ⫽ 18). The most native PRM was preselected on the basis of its physicochemical characteristics and lack of lipoprotein deterioration. In addition, the commutability of the most native PRM was evaluated in a representative sample of Dutch clinical chemistry laboratories (n ⫽ 86 of 120 laboratories) by means of a twin-study design as described by Baadenhuijsen et al. (14 ). The commutability of the PRM was compared with that of the materials regularly used in the Dutch EQA scheme (EQAS; i.e., either frozen materials or lyophilized cryoprotected materials). Additionally, the state-of-the-art analytical performance of the participating Dutch clinical laboratories during 2000 (i.e., the average of what is currently available) was
1527
assessed for serum or plasma lipids and for apo A-I and B. Finally, two national standardization surveys were performed in ⬃100 laboratories with the most commutable PRM to investigate its potential for diminishing interlaboratory variation and to demonstrate its potential as a secondary reference material for lipid and apolipoprotein measurements.
Materials and Methods central evaluation of lipoprotein integrity in commercial and homemade nccls c37-a derived materials
PRMs. Homemade serum pools (n ⫽ 16; see Table 1), either prepared strictly according to the NCCLS C37-A protocol (PRMs 9 –16) (15 ) or gathered in a less-stringent, more convenient way (PRMs 1– 8), were prepared locally (Queen Beatrix Hospital, Winterswijk, The Netherlands). For PRMs 1– 8, fresh, leftover patient sera were randomly pooled in the first batch. To this end, PRMs 1– 4 were initially stored frozen at ⫺80 °C and subsequently bottled after thawing and centrifugation, whereas PRMs 5– 8 were directly bottled from the serum pools. In both strata, the effects of intermittent freezing, sucrose cryoprotection, and lyophilization or freezing were investigated. In the end, NCCLS C37-A reference material (i.e., PRM 15) and 15 variations of it were obtained (Table 1). After selecting the most native PRM, we prepared second, scaled-up batches according to the NCCLS N37-A protocol and from selectively pooled leftover patient sera. The batches contained target HDL-C concentrations of ⬇0.9, ⬇1.1, and ⬇1.6 mmol/L, which encompassed the National Cholesterol Education Program (NCEP) cutpoints (2 ). Commercially available, human serum-based calibrators and controls that were stated to be commutable across methods were purchased from different manufacturers (n ⫽ 18; see Table 2). The materials were either lyophilized in the presence or absence of cryoprotectants (n ⫽ 15) or liquid stabilized (n ⫽ 3). Bovine serum-based and aqueous materials were not considered because of the different matrices. For the purpose of comparison, a fresh-frozen serum pool from the CDC (PRM 19) and a fresh, unfrozen serum (PRM 20) were included. Accuracy platform and routine methods in the Lipid Reference Laboratory Rotterdam. Serum lipids in the PRMs were initially measured centrally, i.e., in the Lipid Reference Laboratory Rotterdam, with standard enzymatic methods. Cholesterol was measured with a cholesterol oxidase–phenol aminophenazone (CHOD-PAP) method; triglycerides were measured with a glycerophosphate oxidase–phenol aminophenazone (GPO-PAP) method without glycerol correction. HDL-C was measured directly using ␣-cyclodextrin sulfate and polyethylene gly-
1528
Cobbaert et al.: Commutable Reference Materials for Lipids and Apolipoproteins
Table 1. Physicochemical characteristics and lipid and apolipoprotein recoveries of homemade, human serum-based PRMs.a PRM preparation procedure
PRM
a
Cryoprotection Intermittent with 200 g/L freezing sucrose
Lipoprotein Flakes separation after after UC?b UC?
Freezing or lyophilization
Aspect
A710 nm
Freezing Lyophilization Freezing Lyophilization Freezing Lyophilization Freezing Lyophilization
Clear Clear Turbid⫹ Turbid⫹⫹ Clear Clear Turbid⫹ Turbid⫹⫹
0.151 0.219 0.184 1.064 0.178 0.057 0.110 0.803
No No Yes Yes No No Yes Yes
Freezing Lyophilization Freezing Lyophilization Freezing Lyophilization Freezing Lyophilization
Clear Clear Clear Turbid⫹⫹ Clear Clear Clear Turbid⫹⫹
0.064 0.044 0.060 0.754 0.023 0.042 0.044 0.663
No No Yes Yes No No Yes Yes
Recovery, % TG
Chol
99.6 98.7 99.5 99.7 99.1 99.6 100.0 99.8
102.3 100.1 101.6 100.0 100.7 100.8 100.0 101.0
HDL-C apo A-I apo B
Regular procedure 1 2 3 4 5 6 7 8
Yes
Yes No
No
Yes No
No ⫹c No ⫹⫹ No ⫹ No ⫹⫹
102.8 100.2 97.0 85.5 104.7 103.1 100.0 88.0
103.1 99.8 101.7 99.4 101.6 98.1 100.0 99.2
104.8 100.2 100.6 90.0 101.7 98.8 100.0 91.4
No 100.2 100.5 102.8 100.7 ⫹ 98.8 99.8 102.4 100.5 No 99.8 99.5 99.1 101.5 ⫹⫹⫹ 98.0 98.7 88.0 99.7 No 100.3 100.3 104.7 99.9 ⫹ 99.5 99.5 104.5 100.9 No 100.0 100.0 100.0 100.0 ⫹⫹⫹ 97.0 98.4 86.6 99.4
101.0 100.1 101.1 91.6 100.4 102.5 100.0 92.7
According to NCCLS C37-A 9 10 11 12 13 14 15 16
Yes
Yes No
No
Yes No
a PRMs 1– 8 were prepared from one donor pool according to the regular pool preparation procedure for preparing SKZL EQA materials; PRMs 9 –16 were prepared according to the NCCLS C37-A protocol from serum from another donor. Lipid and apolipoprotein concentrations were “normalized” (i.e., divided by their sodium concentration) to correct for volume effects in the eight arms of both preparation strata. The normalized lipid and apolipoprotein ratios enable direct comparison of lipid and apolipoprotein recoveries per stratum in all preparation arms; recoveries are referenced to PRM 7 and PRM 15 for, respectively, the regular and the NCCLS C37-A pool preparation procedure. b UC, ultracentrifugation; TG, triglycerides; Chol, cholesterol. c ⫹, small amount; ⫹⫹, intermediate amount; ⫹⫹⫹, large amount.
col-modified enzymes. All lipid reagents were purchased from Roche Diagnostics. We measured apo A-I and B with immunoturbidimetric assays from Roche Diagnostics. Sodium was measured by flame photometry on an IL 943 apparatus (Instrumentation Laboratory). For the recovery experiment using the homemade PRMs, triplicate analyses were performed on a single occasion. Routine methods in Rotterdam are directly standardized against CDC Reference Methods and international Reference Preparations. CDC Reference Methods for cholesterol, HDL-C, and LDL-C are available in the Lipid Reference Laboratory Rotterdam, a permanent member of the CDC Cholesterol Reference Method Laboratory Network (16 –18 ). apo A-I and B standardization in the Lipid Reference Laboratory Rotterdam was achieved based on the WHO-IFCC protocol for apo A-I and B standardization from Dr. S. Marcovina (Northwest Lipid Research Laboratories, University of Washington, Seattle, WA). The latter protocol guarantees the transferability of values from the WHO-IFCC First International Reference calibrators (SP1-01 for apo A-I and SP3-07 for apo B) to in-house reference materials. Evaluation of lipoprotein integrity in commercial and homemade PRMs. Lipoprotein integrity in the PRMs was investigated by examining their physicochemical characteristics by macroscopic turbidity, absorbance at 710 nm, the
lipoprotein pattern on agarose gel electrophoresis (Paragon; Beckman Coulter), and the presence or absence of flakes in the LDL layer after ultracentrifugation under the conditions used in the CDC Betaquant method (4, 17 ). In the homemade PRMs, serum lipid and apo A-I and B concentrations were corrected for volume variations. To this end, “normalization” was performed by dividing the mean lipid and apolipoprotein concentrations by the mean sodium concentration measured in the same vials. The calculated normalized ratios enabled direct comparison of the lipid and apolipoprotein recoveries for PRMs 1– 8 and PRMs 9 –16, respectively. Recoveries are referenced to PRM 7 for the regularly prepared PRMs 1– 8 and to PRM 15 for the NCCLS C37-A-derived PRMs 9 –16. Selection of the most native PRM for further commutability and standardization studies. Of the 34 PRMs shown in Tables 1 and 2, the material with superior physicochemical characteristics was selected to investigate its potential as a possible secondary reference material for lipid and apolipoprotein standardization in the clinical chemistry field. To this end, the production of PRM 15 was scaled up, and a second, larger batch was prepared for the national studies. For comparison, the regularly prepared type of serum pools currently used in the Dutch EQA surveys, i.e., PRM 2 and PRM 3, as defined in Table 1, were investigated in parallel (9, 10 ).
1529
Clinical Chemistry 48, No. 9, 2002
Table 2. Physicochemical characteristics of commercial, human serum-based calibrators and controls. PRM
Product name
Manufacturer
1 2 3 4 5 6 7 8 9 10 11 12 13 14 15 16 17 18
Liquichek™ lipids control, level 1b Liquichek lipids control, level 2b Tina-quant姞 Apo A-I calibrator Tina-quant Apo B calibrator CFAS LDL/HDL-C Cardiolipid™ control, level 1 Cardiolipid control, level 2 EZ LDL™ calibrator EZ HDL™ calibrator Calibrator LDL direct Calibrator (human)b Calibrator HDL direct Apolipoproteins T standard CFAS Apo calibrator Seronorm™ lipoprotein Randox apolipoprotein calibrator Randox direct LDL/HDL cholesterol calibrator AQ16 Fresh serum
Bio-Rad Bio-Rad Roche Diagnostics Roche Diagnostics Roche Diagnostics Sigma Diagnostics姞 Sigma Diagnostics Sigma Diagnostics Sigma Diagnostics Roche Diagnostics Roche Diagnostics Roche Diagnostics Roche Diagnostics Roche Diagnostics Dade Behring SERO A/S Sanbio姞 BV Sanbio BV
Liquid stabilized Liquid stabilized Lyophilized Lyophilized Lyophilized Lyophilized Lyophilized Lyophilized Lyophilized Lyophilized Lyophilized Lyophilized Lyophilized Lyophilized Lyophilized Liquid stabilized Lyophilized Lyophilized
Turbid Turbid Turbid Turbid Turbid Turbid Turbid Turbid Turbid Turbid Clear Turbid Turbid Clear Turbid Turbid Turbid Turbid
CDC pool Homemade
Frozen human serum Fresh human serum
Clear Clear
19 20
Product type
Aspect after thawing or after reconstitution?
⫹c ⫹ ⫹ ⫹⫹ ⫹⫹⫹ ⫹⫹⫹ ⫹⫹⫹ ⫹ ⫹ ⫹ ⫹ ⫹ ⫹⫹⫹ ⫹⫹⫹ ⫹⫹⫹ ⫹⫹
A710 nm
Lipoprotein separation after UC?a
Flakes after UC?
0.265 0.246 0.406 0.639 1.147 0.808 0.636 0.546 0.575 0.304 0.309 0.259 0.352 0.271 0.644 0.242 1.359 0.497
Yes Yes Yes Yes Yes Yes Yes Yes Yes No Yes No Yes Yes No Yes Yes Yes
⫹⫹ ⫹⫹ ⫹⫹ ⫹⫹ ⫹ ⫹ ⫹ ⫹⫹ ⫹⫹ ⫹ ⫹⫹ ⫹⫹⫹ ⫹⫹ ⫹⫹⫹ ⫹⫹⫹ ⫹⫹⫹ ⫹⫹⫹ ⫹⫹⫹
0.346 0.217
Yes Yes
No No
a
UC, ultracentrifugation. Prepared from human serum with added constituents of human and animal origin. c ⫹, small amount; ⫹⫹, intermediate amount; ⫹⫹⫹, large amount. b
commutability assessment of the selected PRMs in a twin study Twin-study design. The commutability of PRMs 2, 3, and 15, as defined in Table 1, was evaluated by pairing laboratories two by two. Every pair of laboratories was asked to split six fresh patient samples with concentrations covering the HDL-C measurement range, to exchange them with the partner laboratory, and to assay them the next day (within 24 h after collection). Until analysis, specimens were stored at 4 °C. In total, 12 patient specimens were assayed in duplicate by each laboratory in a single analytical batch with the PRMs randomly interspersed between the fresh patient specimens. The dispersion of the data points from each PRM was then compared with the patient regression lines produced by the population of paired laboratories. A detailed description of the twin study is given by Baadenhuijsen et al. (14 ). Participating clinical chemistry laboratories. Eighty-six of 120 Dutch clinical chemistry laboratories that regularly participate in the Dutch National EQAS (SKZL) agreed to participate in the twin study. Consequently, 43 laboratory pairs were formed. Matching of the laboratories took into account the use of measurement methods based on different principles by the paired laboratories and the geographic distance between them. All participating laboratories measured cholesterol, HDL-C, LDL-C, and triglycerides in the split fresh patient
samples and in the PRMs, whereas only 19 laboratories measured apo A-I and B. In case of lipoprotein(a) [Lp(a)], commutability was not assessed because it was not feasible for the volunteering laboratories to perform a split-sample comparison on fresh serum; on the other hand, 15 laboratories that perform Lp(a) measurements on a regular basis agreed to participate in standardization surveys 2000-4 and 2000-5. Routine methods for lipid and apo A-I and B measurements in The Netherlands in April 2000 Cholesterol. All laboratories used CHOD-PAP reagents for cholesterol measurements on their routine analyzers. Reagents and analyzers had been purchased from Bayer, Beckman Coulter, Dade Behring, Instrumentation Laboratory, Ortho Clinical Diagnostics, or Roche Diagnostics. Twenty percent of the laboratories had Vitros analyzers (Ortho Clinical Diagnostics) and used a dry-chemistrybased method. HDL-C. Of the participating laboratories, 14% used a two-step HDL-C precipitation method in combination with a CHOD-PAP measurement, whereas 86% of the laboratories used homogeneous HDL-C methods. Only one-half of the Vitros users, i.e., 10% of the total number of participating laboratories, used a two-step precipitation method for HDL-C on their dry-chemistry analyzers.
1530
Cobbaert et al.: Commutable Reference Materials for Lipids and Apolipoproteins
LDL-C. Of the participating laboratories, 89% calculated LDL-C by the Friedewald formula, whereas 8% of the laboratories measured LDL-C with a homogeneous LDL-C method. Three percent of the laboratories used a two-step method for measuring LDL-C (either a precipitation method or an immunoseparation method in combination with a CHOD-PAP reaction). Triglycerides. Of the participating laboratories, 66% used a GPO-PAP enzymatic method without correction for free glycerol; 9% used a GPO-PAP method with standard correction for free glycerol, and 5% used a GPO-PAP method with measured correction for free glycerol. Twenty percent of the laboratories used a dry-chemistry method on a Vitros analyzer. apo A-I and B. Fifty-three percent of the laboratories used an immunonephelometric method (Beckman Coulter or Dade Behring), whereas 47% used an immunoturbidimetric method (Roche Diagnostics). Lp(a). Sixty-nine percent of the laboratories used an immunonephelometric method (Beckman Coulter or Dade Behring), 15% used an immunoturbidimetric method (Roche Diagnostics), and the others used either an IRMA method (Mercodia) or the Genzyme Lp(a)-cholesterol method (Orange Medical). Statistical analysis. Data acquired in the twin study were analyzed centrally by the SKZL. Before statistical analysis, the measured raw data in the selected PRMs were checked for trueness and plausibility by comparison with the assigned values and for within- and between-laboratory consistency. In a few laboratories, some PRM data points deviated substantially; i.e., ⬎50% to 100% from the target value. When we checked with these laboratories, it became clear that reconstitution errors were made. The explained, incorrect PRM data points were excluded from the data analysis. The measured data for the 12 fresh patient specimens and the PRM data points were plotted in an x-y scattergram for each analyte and each laboratory pair. The intermethod relationship was assessed using bivariate regression analysis according to Passing and Bablok (19, 20 ). The normalized regression residuals for each PRM were calculated as multiples of the state-of-the-art within-laboratory SD (SDSA; i.e., the mean within-laboratory SD of what is currently available; see Table 3), as described by Baadenhuijsen et al. (14 ). Because of the design of the Dutch EQAS, the SDSA is one of the statistical outcomes for each of the analytes covered in this scheme and may be considered as the average of the currently obtainable within-laboratory precision. The normalized residuals for each PRM may be taken as a measure of their degree of commutability. In accordance with Franzini and Ceriotti (21 ), it is reasonable to take the value of 3 SDSA as the cutoff between commutable and
Table 3. SDSAa for lipid and apolipoprotein measurements in The Netherlands during 2000. Analyte
Ctarget
Cholesterol, mmol/L HDL-C, mmol/L LDL-C, mmol/L Triglycerides, mmol/L apo A-1, g/L apo B, g/L
5 1 4 2 1 1
SDSA (CVSA, %)
0.125 (2.5%) 0.04 (4%) 0.16 (4%) 0.05 (2.5%) 0.05 (5%) 0.05 (5%)
a SDSA values are used for calculation of the normalized residuals of PRMs in the commutability study.
noncommutable. In addition, the degree of commutability was quantitatively expressed by CVNetto (%), i.e., the extra contribution by the PRM to the total measurement uncertainty as described by Baadenhuijsen et al. (14 ).
analytical performance of lipid and apolipoprotein measurements in the netherlands during 2000 Target value assignment of the selected PRMs. Target values were assigned to PRMs 3 and 15 at three concentrations (i.e., at low, medium, and high HDL-C concentrations). Value assignment was performed by the Lipid Reference Laboratory Rotterdam, using CDC Reference Methods for cholesterol, HDL-C and LDL-C. Quadruplicate analyses were performed with the CDC Reference Methods in two independent analyses. Target values for cholesterol, HDL-C, and LDL-C were calculated by averaging the eight reference method results per concentration and per analyte. Target values were not assigned to PRM 2, the lyophilized, sucrose-protected PRM currently used in the Dutch EQA surveys for lipid assessment, because of matrix effects. For apo A-I and B, value assignment was performed using in-house calibrators and an immunoturbidimetric method from Roche Diagnostics on a Hitachi 911 analyzer, which produces results that are traceable to the WHO International Reference Materials for apo A-I and apo B. Data analysis. Mean bias and mean absolute bias (MAB) were calculated for PRMs 3 and 15; the lyophilized PRM 2 was not considered because of matrix effects and intermethod differences (see Results). To this end, the percentages of bias and absolute bias were calculated for each laboratory for PRMs 3 and 15 at low, medium, high HDL-C concentrations. Finally, basic statistics were calculated for the percentage of bias and percentage of MAB across the participating clinical chemistry laboratories (n ⫽ 86). The lipid and apolipoprotein concentrations measured in the twin study in the tested PRMs were averaged across the participating laboratories. The CV (%) was computed for each PRM and each analyte and was considered as a
Clinical Chemistry 48, No. 9, 2002
set CV representing the degree of interlaboratory variation in The Netherlands during 2000.
effect of calibration with nccls c37-a-type materials (prm 15) on interlaboratory variation Study design. After the twin study, two subsequent national SKZL EQAS surveys were performed in ⬃100 Dutch clinical chemistry laboratories with the selected PRM 15 to evaluate its potential for harmonization of lipid and apolipoprotein measurements in The Netherlands. The EQAS surveys were performed in the summer (Survey 2000-4) and the fall of 2000 (Survey 2000-5). To date, the SKZL includes in the EQA surveys six lyophilized, sucrose-protected control materials (PRM 2 and/or PRM 3 materials as defined in Table 1) and two commercial control materials for assessing the quality of lipid measurement in The Netherlands. In the 2000-4 survey (in July/August 2000), PRM 3 and PRM 15 were included at low, medium, and high HDL-C concentrations, and PRM 2 was included at low and medium HDL-C concentrations as survey samples. The survey samples, as usual, were presented blinded and encoded (2000-A to 2000-H) to the participants. In addition, the participants received positively identified low, medium, and high PRM 15 with assigned values for lipids and apolipoproteins. The participants were asked to analyze the PRM 15 preparations and the 2000-4 survey samples in duplicate in the same analytical batch. Laboratories were unaware of the survey composition and of the fact that the regular survey samples were replaced by PRMs. The laboratories were asked to recalculate samples A–H by means of linear regression analysis (assigned values of the known PRM 15 samples on the x axis and laboratory measurements of the blinded PRM 15 samples on the y axis), using the regression parameters. All measurements and recalculated results were reported to the SKZL for central data analysis. In the 2000-5 survey (in September/October 2000), PRM 3 and PRM 15 containing the medium HDL-C concentration and four samples of PRM 2 were included as blinded survey samples. In addition, the participating laboratories received one sample of positively identified PRM 15 with the medium HDL-C concentration and with assigned lipid and apolipoprotein values. The laboratories were invited to either perform a one-point calibration on their instrument system using the identified PRM 15 and to use that calibration for the measurement of the survey samples or to analyze PRM 15 in duplicate in the same analytical batch as the survey samples and to recalculate the survey sample data by [⫻ 100/(PRM 15 recovery, %)]. Again, all raw data and/or recalculated data were reported to the SKZL for central data analysis. Data analysis Outlier elimination. The pooling procedure for the preparation of PRM 15 used blood donor selection based on relevant spreading of HDL-C concentrations. Therefore,
1531
the resulting concentrations of LDL-C and apo B were not in control. In the 2000-4 survey and in cases in which adequate spreading of the concentrations allowed the drawing of a relevant calibration line (HDL-C, cholesterol, apo A-I, and triglycerides), outliers were computed as: [Sy兩x/average of the PRM target values)] ⫻ 1000; Sy兩x being the standard error of regression in the linear regression analysis. If this arbitrary, normalized Sy兩x value was ⬎100, the data point for the PRM was considered an outlier and discarded. Additionally, a duplicate precision factor was calculated as the average measured value of the identified PRMs divided by the average measured value of the encoded, blinded PRMs in the survey; if this value was ⬍0.95 or ⬎1.05, the PRM data point was considered an outlier and discarded. In cases in which no relevant calibration line was possible because of insufficient spread in the concentrations (LDL-C and apo B; see Table 5), the average of the assigned values of the PRMs divided by the average of the measured values in the known PRMs was calculated; if this value was ⬍0.8 or ⬎1.20, the laboratory was considered an outlier. Again the duplicate precision factor was calculated per PRM as the average measured value of the positively identified PRMs divided by the average of the measured values of the blinded and encoded PRMs in the survey; if this value was ⬍0.95 or ⬎1.05, the PRM data point was considered an outlier and discarded. In the 2000-5 survey with single-point calibration or recalculation based on the deviation from a complete PRM 15 recovery, outlier detection and elimination were performed as described above for LDL-C and apo B in the 2000-4 survey Interlaboratory variation. The effect of calibration using PRM 15 was investigated by evaluating the interlaboratory variation. The lipid and apolipoprotein concentrations measured in, respectively, the 2000-4 and 2000-5 survey samples were averaged for each survey, each sample, and each concentration across the participating laboratories for both the original measurements and the recalculated data. The interlaboratory CV (%) was computed in both data sets across all participating laboratories for each PRM and each analyte. The effect of calibration on interlaboratory variation can be deduced from the interlaboratory CV in the recalculated data set.
Results evaluation of lipoprotein integrity in commercial and homemade nccls c37-a-derived reference materials Homemade PRMs. As illustrated in Table 1, the intrinsic absorbances at 710 nm in NCCLS C37-A-derived PRMs 9 –16 were approximately threefold lower than the absorbances measured in the regularly prepared PRMs 1– 8. Lyophilized PRMs to which no sucrose was added (PRMs 4, 8, 12, and 16) displayed huge intrinsic absorbances (range, 0.663–1.064); accordingly, deposits appeared at the
1532
Cobbaert et al.: Commutable Reference Materials for Lipids and Apolipoproteins
application sites on agarose gel electrophoresis, and the pre--bands almost disappeared (gels not shown). Adequate lipoprotein separation by ultracentrifugation was not possible in any of the PRMs cryoprotected with 200 g/L sucrose; lipoprotein fractions remained floating because of enhanced serum density. In the homemade series, PRM 15 was equivalent to the original NCCLS C37-A reference material. As demonstrated in Table 1, its intrinsic absorbance was only 0.044, no flakes appeared on ultracentrifugation at serum density, and lipoprotein separation was adequate. In agarose gel electrophoresis, no debris was present at the application site and -, pre--, and ␣-bands were present. After ultracentrifugation according to the conditions of the CDC Betaquant procedure (4, 17 ), all homemade, lyophilized PRMs (PRMs 2, 4, 6, 8, 10, 12, 14, and 16) displayed flakes in the LDL layer, irrespective of the presence of 200 g/L sucrose, intermittent freezing, and the pool preparation procedure (not shown). Sucroselyophilized PRMs 2, 6, 10, and 14 contained substantially fewer flakes compared with the noncryoprotected PRMs (4, 8, 12, and 16). Frozen PRMs 1, 3, 5, 7, 9, 11, 13, and 15 displayed no flakes irrespective of the addition of sucrose, intermittent freezing, and the pool preparation procedure. As shown in Table 1, lipid and apolipoprotein recoveries were close to 100% in both frozen and lyophilized PRMs that were cryoprotected, irrespective of the pool preparation procedure. In lyophilized PRMs that were not cryoprotected, HDL-C and apo B recoveries were incomplete, whereas cholesterol, triglyceride, and apo A-I recoveries were unaffected. Surprisingly, HDL-C recovery as measured by the direct HDL-C method from Roche was increased (up to 104.7%) in all cryoprotected PRMs.
None of the commercial materials (Table 2) approached the physicochemical characteristics of PRM 15. Consequently, these materials were not further investigated.
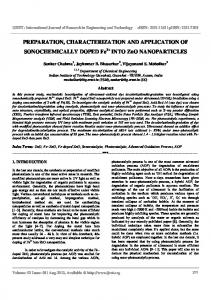
commutability assessment of the selected PRMs in a twin study design In Fig. 1, normalized residuals of the tested PRMs are presented for each participating laboratory. From Fig. 1 it is obvious that the absolute normalized residuals for PRM 15 were ⱕ3 SDSA for lipids (except for the medium HDL-C concentration) as well as for apolipoproteins, whereas this was generally not the case for PRMs 2 and 3.
Commercial calibrators and controls. From Table 2 it becomes obvious that all commercial preparations displayed intrinsic absorbances ⬎0.246 at 710 nm and flakes after ultracentrifugation at serum density. Sixteen of 18 preparations were macroscopically turbid. In agarose gel electrophoresis, all 18 commercial reference materials and controls had deposits at the application sites, in contrast to the frozen and fresh serum pools. After ultracentrifugation according to the specifications of the CDC Betaquant method (4, 17 ), all commercial materials displayed flakes, and eventually a complete network of flakes formed throughout the ultracentrifugation tube (not shown). Selection of PRMs. On the basis of its superior physicochemical characteristics, PRM 15 prepared according to the strict NCCLS C37-A procedure was considered the best candidate reference material and was therefore selected for further commutability and standardization studies. For reasons of comparison, the currently used Dutch EQA control materials were investigated in parallel (PRMs 2 and 3).
Fig. 1. Degree of commutability of selected PRMs. Commutability is expressed by the normalized residuals of the studied PRMs to the patient regression line, as derived from a twin study including 43 Dutch laboratory pairs. Normalized residuals were calculated as multiples of SDSA. The dashed line represents the cutoff between commutable and noncommutable. Characteristics of the selected PRMs 2, 3, and 15 are presented in Table 1. Symbols used for the various PRMs at low (L), medium (M), and high (H) HDL-C concentrations are as follows: for PRM 15, ⽧, C37-L; f, C37-M; Œ, C37-H; for PRM 3, ⫻, low (Fro-L); ⴱ, medium (Fro-M); F, high (Fro-H); for PRM 2, ⫹, low (Lyo-L); ⫺, medium (Lyo-M); E, high (Lyo-H).
1533
Clinical Chemistry 48, No. 9, 2002
Table 4. Additional contribution for each PRM to total measurement uncertainty. CVNetto, %
PRM 15 C37-L C37-M C37-H PRM 3 Fro-L Fro-M Fro-H PRM 2 Lyo-L Lyo-M Lyo-H
b
HDL-C
Chol
3.6 3.2 1.9
0.5 1.5 0.5
0 0.8 0.9
0 0 0
0 0 0.9
2.4 3.2 3.8
5.9 3.5 3.5
2.4 1.4 1.2
3.4 1.8 1.6
3.3 0 3.8
2.0 5.9 4.5
3.7 4.9 4.0
5.8 4.0 6.2
1.8 3.4 3.8
4.1 3.4 4.1
0.6 0.3 4.6
0 6.2 11
2.4 2.9 7.4
LDL-C
TG
apo A-I
apo B
a The extra contribution for each PRM to measurement uncertainty is expressed as CVNetto (%) (14 ). b Chol, cholesterol; TG, triglycerides; L, low HDL-C concentration; M, medium HDL-C concentration; H, high HDL-C concentration; C37, PRM 15 as characterized in Table 1; Fro, PRM 3, as characterized in Table 1; Lyo, lyophilized and cryoprotected PRM 2, as characterized in Table 1.
The CVNetto values for different lipids and lipoproteins in PRMs 2, 3, and 15 are presented in Table 4. Overall, PRM 15 displayed significantly lower CVNetto values for lipids and apolipoproteins (range, 0 –3.8%; overall mean, 1.3%) compared with PRM 2 (range, 0 –11%; overall mean, 4.0%) and PRM 3 (range, 0 –5.9%; overall mean, 3.1%; ␣ ⫽ 0.05). Consequently, PRM 15 contributed least to measurement uncertainty, followed by PRM 3 and PRM 2, respectively. For cholesterol, the frozen PRM 3 apparently behaved like PRM 15 across different laboratory methods and instruments (Fig. 1), but examination of the corresponding CVNetto values for cholesterol (Table 4) revealed the superiority of PRM 15; the extra contribution by PRM 15 to measurement uncertainty was, on average, only 0.67% compared with 1.67% for PRM 3.
analytical performance of lipid and apolipoprotein measurements in the netherlands during 2000 Interlaboratory variation in The Netherlands. The overall laboratory mean and the interlaboratory variation (CV, %) for the NCCLS C37-A (PRM 15) and regularly frozen (PRM 3) materials, as measured in 86 Dutch clinical chemistry laboratories that participated in the twin study, are presented in Table 5. Table 5 shows that the interlaboratory imprecision was consistent and similar in PRM 3 and PRM 15 materials for each analyte. Interlaboratory imprecision seemed related to method and calibration differences and increases in the following order: cholesterol (⬇3.5%) ⬍ triglycerides (⬇5%) ⬍ HDL-C and LDL-C (⬇6%) ⬍ apo B (⬇ 7% for PRM 15) ⬍ apo A-I (⬇ 9%); imprecision was the largest for immunologic methods.
Mean absolute bias in The Netherlands during 2000. From the values in Table 5 for PRM 15, the NCCLS C37-A-type PRM, we deduced that the mean absolute bias was ⬇2.8% for cholesterol, ⬇4.8% for HDL-C, and ⬇ 7.5% for LDL-C. For the apolipoproteins, the MAB was ⬇4.8% for apo B and ⬇8% for apo A-I. The percentages of Dutch clinical chemistry laboratories in the studied population sample that exceeded the NCEP bias recommendations for cholesterol (33%), HDL-C (32%), and LDL-C (68%) are shown in Table 6. No CDC Reference Method was used for triglycerides; hence the so-called bias and MAB should be interpreted as the deviation from a GPO-PAP comparison method without free glycerol correction. For apo A-I and B, bias criteria were deduced from biological variability data and were based on medical needs; for the apolipoproteins, it is obvious that one-fourth of the laboratories measuring apo B exceeded the bias criterion of ⫾6%, whereas one-half of the laboratories measuring apo A-I exceeded this criterion.
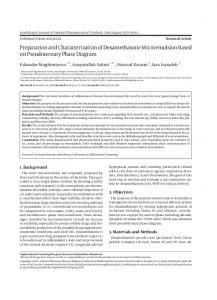
effect of calibration with nccls c37-a-type materials (prm 15) on interlaboratory variation The effects of three- and one-point adjustments with PRM 15 on harmonization of lipid and apolipoprotein measurements are illustrated in Fig. 2, A (2000-4 survey) and B (2000-5 survey), respectively, and show that significant reductions in interlaboratory variation can be reached with PRM 15 for lipids, apolipoproteins, and Lp(a) compared with PRMs 2 and 3 (␣ ⫽ 0.05). For PRM 15, the interlaboratory CV was reduced to ⬇2% for serum lipids and apo B, to ⬇3% for Lp(a), and to ⬇ 3– 4% for apo A-I.
Discussion To achieve nationwide standardization for lipids and apolipoproteins, commutable reference materials that produce equal results across different methods and analytes (wet- and dry-chemistry methods; heterogeneous and homogeneous methods) are needed. To this end, (apo)lipoproteins should not become denatured during the usual preparation procedures. To be practical, it is also preferable that those reference materials are stable over a longer period of time and can be stored at room temperature. In the initial phase of this study, it was demonstrated that commercial human-based reference materials (Table 2) are inferior to homemade PRMs. Because of substantial macroscopic turbidity, high intrinsic absorbances after reconstitution or thawing, the presence of debris at agarose gel application sites, and the presence of flakes after ultracentrifugation, massive lipoprotein denaturation is suspected in these materials. For these reasons, none of the commercial materials had potential for combined lipid and apolipoprotein standardization. In the homemade PRMs (Table 1), all lyophilized materials displayed flakes after ultracentrifugation, irrespective of the addition of sucrose; if sucrose was added
1534
Cobbaert et al.: Commutable Reference Materials for Lipids and Apolipoproteins
Table 5. Interlaboratory variation (mean, SD, and CV) and analytical bias of serum lipid and apolipoprotein measurements in Dutch clinical chemistry laboratories during 2000. Analyte
PRM
Cholesterol, mmol/L
PRM 15 C37-La C37-M C37-H PRM 3 Fro-L Fro-M Fro-H PRM 15 C37-L C37-M C37-H PRM 3 Fro-L Fro-M Fro-H PRM 15 C37-L C37-M C37-H PRM 3 Fro-L Fro-M Fro-H PRM 15 C37-L C37-M C37-H PRM 3 Fro-L Fro-M Fro-H PRM 15 C37-L C37-M C37-H PRM 3 Fro-L Fro-M Fro-H PRM 15 C37-L C37-M C37-H PRM 3 Fro-L Fro-M Fro-H
HDL-C, mmol/L
LDL-C, mmol/L
Triglycerides, mmol/L
apo A-I, g/L
apo B, g/L
Target value
Mean
SD
CV, %
Mean bias, %
Median absolute bias, %
SDMAB, %
4.70 5.10 5.63
4.77 5.16 5.68
0.18 0.17 0.19
3.8 3.3 3.3
1.4 1.2 0.8
3.1 2.8 2.6
2.1 2.0 2.1
2.4 2.2 2.2
4.66 5.65 6.78
4.69 5.68 6.86
0.17 0.19 0.22
3.6 3.3 3.2
0.7 0.5 1.1
3.0 2.8 2.8
3.0 2.7 2.5
2.1 2.0 2.0
1.07 1.25 1.83
1.08 1.27 1.84
0.07 0.08 0.11
6.1 6.1 6.0
0.7 1.5 0.4
4.8 4.9 4.5
3.7 4.0 3.3
4.0 4.0 4.0
0.93 1.13 1.55
0.94 1.17 1.58
0.07 0.08 0.11
7.3 7.1 6.7
1.5 2.9 2.0
5.9 6.5 6.0
4.8 6.0 4.8
4.8 4.5 3.8
2.80 2.85 3.26
2.98 3.09 3.28
0.20 0.20 0.22
6.7 6.5 6.7
6.3 8.3 0.6
7.5 9.2 5.3
6.8 8.1 3.8
5.7 5.8 4.3
2.52 3.18 3.95
2.91 3.74 4.52
0.19 0.23 0.27
6.5 6.1 6.0
1.52 1.74 1.19
1.60 1.82 1.24
0.09 0.09 0.07
5.3 4.9 5.5
4.9 4.4 4.5
6.2 5.5 5.9
5.3 4.6 5.9
5.6 5.1 5.8
1.80 1.68 1.63
1.90 1.72 1.70
0.10 0.09 0.08
5.1 5.0 4.6
5.3 2.6 4.3
6.1 4.7 5.5
5.6 4.8 4.3
5.4 5.2 4.8
1.29 1.39 1.73
1.32 1.41 1.86
0.13 0.12 0.20
9.8 8.5 11
2.1 1.7 7.7
7.5 7.1 11.1
6.2 6.1 8.7
6.6 4.6 8.1
1.19 1.39 1.68
1.18 1.46 1.78
0.11 0.13 0.16
9.3 8.9 9.0
⫺1.0 4.7 5.7
7.0 7.3 7.6
6.7 5.0 4.8
5.7 7.4 7.7
0.97 1.00 1.02
0.99 1.02 1.02
0.07 0.07 0.07
7.1 6.9 6.9
2.4 1.7 0.0
5.2 4.7 4.7
2.6 2.0 3.4
5.7 5.5 5.1
0.99 1.04 1.24
1.00 1.14 1.27
0.09 0.10 0.10
9.0 8.8 7.9
1.3 9.8 2.8
6.1 11.1 6.0
4.4 9.6 4.8
6.4 7.7 6.0
MAB, %
a C37, PRM 15, as characterized in Table 1; Fro, PRM 3, as characterized in Table 1; Lyo, lyophilized and cryoprotected PRM 2, as characterized in Table 1; L, low HDL-C concentration; M, medium HDL-C concentration; H, high HDL-C concentration.
Clinical Chemistry 48, No. 9, 2002
Table 6. Percentage of Dutch clinical chemistry laboratories exceeding generally accepted bias recommendations during 2000. Analyte
Bias recommendation
Laboratories exceeding the bias recommendation, %
Cholesterola HDL-Ca LDL-Ca apo A-I apo B
ⱕ⫾3% ⱕ⫾5% ⱕ⫾4% ⱕ⫾6% ⱕ⫾6%
33.3 32.1 67.9 52.6 27.8
a
NCEP bias recommendations (2, 4, 5 ).
as cryoprotectant, only tiny flakes were present. The homemade frozen NCCLS C37-A PRMs did not contain flakes at all, had the lowest intrinsic absorbances at 710 nm, and did not precipitate at the application site in agarose gel electrophoresis. The frozen, homemade PRMs that were not cryoprotected allowed adequate lipoprotein separation in combination with the CDC Betaquant method (4, 17 ), the latter being essential for target value assignment and standardization purposes. Macroscopic transparency and an intrinsic absorbance ⬍0.050 was
1535
demonstrated in PRM 15, illustrating the superior characteristics of this frozen NCCLS C37-A preparation compared with PRMs 3, 7, and 11. From this part of the study it was concluded that lipoprotein integrity and physicochemical characteristics were superior in PRM 15, which was strictly prepared according to NCCLS C37-A, compared with the other 15 homemade PRMs. Any deviation from the strict NCCLS preparation procedure led to additional loss of lipoprotein integrity. Hence, it was decided to scale up the production of the PRM 15 arm, the original NCCLS C37-A material, for field evaluation and to perform a national commutability study and two national harmonization studies using PRM 2, a prototype of the lyophilized, sucrose-containing survey materials of the SKZL, and PRM 3, a prototype of the regularly frozen survey materials of the SKZL, for comparison. To demonstrate the commutability of the selected PRMs in specific clinical chemistry methods that were in use in this field evaluation, twin studies were performed with 43 laboratory pairs (14 ); i.e., of 120 Dutch clinical chemistry laboratories that were invited to participate, a
Fig. 2. Changes in interlaboratory imprecision in The Netherlands for three types of PRMs. N represents the number of clinical chemistry laboratories that participated in the EQA survey. (A), change in interlaboratory CV (%) after a three-point calibration using NCCLS C37-A material. (B), change in interlaboratory CV (%) after a one-point calibration using NCCLS C37-A material. 䡺, before calibration; f, after calibration; L, low HDL-C; M, medium HDL-C; H, high HDL-C; C37, PRM 15; Fro, PRM 3; Lyo, PRM 2.
1536
Cobbaert et al.: Commutable Reference Materials for Lipids and Apolipoproteins
sample of 86 laboratories (70%) agreed to volunteer in the commutability study. In our opinion, this population sample adequately represents the method and instrument combinations used in The Netherlands as well as the state-of-the-art analytical performance for lipid and apolipoprotein measurements during 2000. In the same analytical batch, the selected PRMs with low, medium, and high HDL-C concentrations were analyzed along with fresh patient specimens. As seen in Fig. 1 and Table 4, it was clear that across different lipid and apolipoprotein measurement procedures in The Netherlands only the highest-quality C37-A-type PRM (PRM 15) behaved like fresh patient specimens across all tested analytes, the normalized residuals being generally ⬍3 SDSA, except for HDL-C in the medium NCCLS C37-A sample. Confirmed commutability of the NCCLS C37-A preparation across the studied lipids and apolipoproteins is new; therefore, our commutability data extend the original NCCLS C37-A findings for cholesterol measurement procedures, promising applicability for lipid and apolipoprotein measurement procedures in general. From Fig. 1 it seems that the PRM 3 materials behaved like patient sera for total cholesterol measurements, but the CVNetto values in Table 4 further underscore the superior behavior of PRM 15 compared with PRM 3. The lyophilized PRM 2 displayed behavior different from fresh patient specimens across all analytes tested, especially in the heterogeneous precipitation methods for HDL-C and LDL-C (data not shown). From the commutability experiment, the average analytical performance of Dutch clinical chemistry laboratories was computed (Tables 5 and 6). Two-thirds of the Dutch laboratories met the NCEP bias requirements for cholesterol (equal to or less than ⫾3%) and for HDL-C (equal to or less than ⫾5%) during 2000. Likely the universal use of well-standardized CHOD-PAP cholesterol reagents and the recently introduced, adequately standardized homogeneous HDL-C methods explain these results (22–26 ). For LDL-C, the bias data are somewhat surprising and should be interpreted with caution because value assignment with the Betaquant CDC Reference Method was performed in fresh-frozen PRM material. The CDC Cholesterol Reference Method Laboratory Network is investigating whether the Betaquant Reference Method itself suffers from a storage-time-dependent negative bias when frozen material is used. This may be the reason that nearly all clinical chemistry laboratories suffer from a so-called “positive” bias. In a future production lot, we plan to target LDL-C in fresh NCCLS C37-A material. Furthermore, for calculated LDL-C (89% of the sampled laboratories), the risk of increased imprecision grows with each of the measurements used to calculate the final result for LDL-C. On the basis of the SDSA values and nominal concentrations for cholesterol, HDL- C, and triglycerides presented in Table 3, it can be calculated that the total imprecision error for LDL-C is (0.1252 ⫹ 0.042 ⫹ 0.052)1/2 ⫽ 0.14 mmol/L at a concentration of [5 ⫺ 1 ⫺
(0.45 ⫻ 2) mmol/L] ⫽ 3.1 mmol/L. Consequently, the average within-laboratory CV for calculated LDL-C (Friedewald formula) was 4.5%, which is slightly above the recommended NCEP precision criterion. Overall total error for the LDL-C measurement should, however, be ⱕ12% and can be divided, as an error budget, across imprecision and bias. According to Demacker et al. (27 ) and also in our hands, the Friedewald formula is sufficiently accurate and precise, producing a total error below the recommended NCEP total error cutpoint of 12%. Although the homogeneous LDL-C methods may be well standardized, uncertainties still exist about their accuracy in the presence of abnormal triglycerides or abnormal lipoprotein composition (28 ). For triglycerides, no definite conclusions could be drawn with respect to bias assessment because a comparative GPO-PAP method was used for value assignment. For apo A-I and B, respectively, 47% and 72% of the Dutch clinical chemistry laboratories performing apo A-I and B analyses meet the 6% bias criterion. In the summer and fall of 2000, two national harmonization challenges were undertaken. To this end, the regular SKZL survey facilities were used. From Fig. 2, it becomes clear that either a three-point calibration (Survey 2000-4) or a one-point calibration (Survey 2000-5) with PRM 15, as defined in Table 1, enables harmonization of lipid and apolipoprotein measurements in The Netherlands; i.e., interlaboratory variation can be reduced, at least theoretically, to 2% for serum/plasma lipids and apo B, to 3% for Lp(a) and to 3– 4% for apo A-I when the NCCLS C37-A sera are used as calibrators. In the two surveys it was shown consistently that the strictly prepared NCCLS C37-A-type reference materials contributed to decreasing the interlaboratory variation in The Netherlands by ⬇44% in cholesterol measurements and by up to 88% in Lp(a) measurements. The one-point adjustment was as effective as the three-point adjustment, indicating that the methods are linear and that the imprecision is proportional across the range of concentrations. Because drift attributable to small, inherent instabilities is inevitable in daily laboratory practice across the time that routine calibrations are acceptable, it should be mentioned that the stated reduction in imprecision can not be exclusively ascribed to the NCCLS C37-A material itself, but also to removal of the drift component by readjustments of the recalculation procedure itself. To date, the Dutch EQAS mainly uses lyophilized, cryoprotected survey materials (PRM 2 as characterized in Table 1) in the surveys. From Fig. 2 it can be seen that these materials do not allow further harmonization of lipid and (apo)lipoprotein measurements in The Netherlands. The lyophilized materials suffer from matrix effects, causing intermethod differences and necessitating peer group means, especially for dry-chemistry instrument systems (cholesterol, triglycerides, and HDL-C) and heterogeneous precipitation methods (HDL-C). The regularly frozen PRM 3 (Table 1) allows further harmonization
1537
Clinical Chemistry 48, No. 9, 2002
solely for triglycerides, but provides no further improvement for the other analytes, the interlaboratory variation being similar to the interlaboratory variation for the lyophilized materials. To follow up the national lipid harmonization projects presented in this study and to further improve accuracy of lipid and apolipoprotein measurements in The Netherlands, the SKZL and the Lipid Task Force of Calibration 2000 recently appealed to the regional clinical chemistry societies to motivate their professionals to further diminish lipid and lipoprotein method biases by periodically (e.g., yearly) assessing their bias using the NCCLS C37A-type material. To this end, precise instructions for bias assessment and eventual calibration adjustment were given. Additional method codes for NCCLS C37-A-calibrated method groups are also foreseen on the EQA survey reports to prevent “contamination” of the original method peer groups and to keep track of ongoing harmonization efforts. As a result, laboratories that adjust their calibrations by use of the targeted NCCLS C37-A material can be distinguished from those that do not. In addition, the Dutch EQAS will periodically include value-assigned, frozen NCCLS C37-A material in future EQA surveys to monitor ongoing calibration efforts on a national level. We realize that periodic inclusion of frozen NCCLS C37-A material has logistic and financial consequences for the SKZL participants because the NCCLS C37-A material should be shipped on dry ice, which increases costs for the surveys compared with the currently used lyophilized survey materials, which are stored at room temperature. The SKZL also advocates the NCCLS C37-A reference material to professionals in the field to independently assess their lipid or apolipoprotein calibration whenever they run into trouble. Its use is recommended only in under the following restricted conditions: (a) to assess method bias in case of major method changes; (b) to elucidate unexpected leaps in bias after introduction of new reagent/calibrator lots; and (c) to distinguish matrix effects of commercial calibrators and controls from true bias, if demanded. Use of this expensive material is not recommended at defined time intervals, nor at the time of recalibration. On the basis of this study, we conclude that the NCCLS C37-A serum preparations are currently the best candidate secondary reference materials for future lipid and (apo)lipoprotein standardization. The commutability of this PRM was demonstrated in a representative population sample of Dutch clinical chemistry laboratories using state-of-the-art lipid and (apo)lipoprotein measurement procedures, which extends the applicability of NCCLS C37-A-type reference materials beyond cholesterol measurement procedures (15 ). In addition, the strictly prepared NCCLS C37-A material was shown to have potential to reduce intermethod lipid and (apo)lipoprotein differences to ⬃2– 4%. We are convinced that with the availability and further validation of the NCCLS C37-A reference material, and in conjunction with an adequate
procedure for harmonizing clinical laboratories, ultimate standardization of lipid and apolipoprotein measurements is within reach. The limitations of our study are obviously related to the fact that in our hands, to date, only two batches of PRM 15 have been prepared. Further and extensive evaluation is needed to document lot-to-lot and vial-to-vial variability, to perform ongoing characterization of the material over the expected shelf life and storage conditions, and to give this NCCLS C37-A material (PRM 15) the status of a Secondary Reference Material in conformance with recognized quality systems (ISO 13485 and US 21CFR820) and European standards for traceability, such as those described in prEN ISO 17511 (29 ).
This project was financed by The Netherlands Heart Foundation (Project IvD/98.0615/CHOL).
References 1. Behandeling en preventie van coronaire hartziekten door verlaging van de plasmacholesterol-concentratie. Consensus Cholesterol tweede herziening, April 1998. Alphen ald Rijn, The Netherlands: Van Zuiden Communications B.V., 1998. 2. Warnick GR, Wood PD. National Cholesterol Education Program recommendations for measurement of high-density lipoprotein cholesterol: executive summary. The National Cholesterol Education Program Working Group on Lipoprotein Measurement. Clin Chem 1995;41:1427–33. 3. Stein EA, Myers GL. National Cholesterol Education Program recommendations for measurement of triglycerides: executive summary. The National Cholesterol Education Program Working Group on Lipoprotein Measurement. Clin Chem 1995;41:1421– 6. 4. Bachorik PS, Ross JW. National Cholesterol Education Program recommendations for measurement of low-density lipoprotein cholesterol: executive summary. The National Cholesterol Education Program Working Group on Lipoprotein Measurement. Clin Chem 1995;41:1414 –20. 5. Current status of blood cholesterol measurement in clinical laboratories in the United States: a report from the laboratory standardization panel of the National Cholesterol Education Program. Clin Chem 1988;34:193–201. 6. Ross JW, Miller G, Myers GL, Praestgaard J. The accuracy of laboratory measurements in clinical chemistry. Arch Pathol Lab Med 1998;122:587– 608. 7. McGuinness C, Seccombe DW, Frohlich JJ, Ehnholm C, Sundvall J, Steiner G. Laboratory standardization of a large international clinical trial: the DAIS experience. DIAS Project Group. Diabetes Atherosclerosis Intervention Study. Clin Biochem 2000;33:15– 24. 8. Rumsey SG, Galeano NF, Arad Y, Deckelbaum JR. Cryopreservation with sucrose maintains normal physical and biological properties of human plasma low density lipoproteins. J Lipid Res 1992;33:1551– 61. 9. Baadenhuijsen H, Demacker PNM, Hessels M, Boerma GJM, Penders TJ, Weykamp C, et al. Testing the accuracy of total cholesterol assays in an external quality-control program. Effect of adding sucrose to lyophilized control sera compared with use of fresh or frozen sera. Clin Chem 1995;41:724 –30. 10. Cobbaert C, Mulder PGH, Baadenhuijsen H, Zwang L, Weykamp CW, Demacker PNM. A survey of total error of precipitation and homogeneous HDL-cholesterol methods—simultaneous evalua-
1538
11. 12. 13.
14.
15.
16.
17.
18.
19.
20.
Cobbaert et al.: Commutable Reference Materials for Lipids and Apolipoproteins
tion of lyophilized, saccharose-containing Candidate Reference Materials for HDL-cholesterol. Clin Chem 1999;45:360 –70. Jansen RTP. Kalibratie 2000. Ned Tijdschr Klin Chem 1998;23: 261– 4. Jansen RTP. The quest for comparability: Calibration 2000. Accred Qual Assur 2000;5:363– 6. Jansen RTP, Kuypers AWHM, Baadenhuijsen H, van den Besselaar AMHP, Cobbaert CM, Gratama JW, et al. Kalibratie 2000. Ned Tijdschr Klin Chem 2000;25:153– 8. Baadenhuijsen H, Steigstra H, Cobbaert C, Kuypers A, Weykamp C, Jansen R. Commutability assessment of potential reference materials using a multiCenter split-patient-sample between-fieldmethod (twin-study) design within the framework of the Dutch project “Calibration 2000”. Clin Chem 2002;48:1520 –5. National Committee for Clinical Laboratory Standards. Preparation and validation of commutable frozen human serum pools as secondary reference materials for cholesterol measurements procedures; approved guideline). NCCLS Document C37-A. Wayne, PA: NCCLS, 1999. McNamara JR, Leary ET, Ceriotti F, Cobbaert C, Cole TG, Hassemer DJ, et al. Status of lipid and lipoprotein standardization. Clin Chem 1997;43:1306 –10. Myers GL, Cooper GR, Henderson LO, Hassemer DJ, Kimberly M. Standardization of lipid and lipoprotein measurements. In: Rifai N, Warnick GR, Dominiczak MH, eds. Handbook of lipoprotein testing. Washington, DC: AACC Press, 1997:223–50. Myers GL, Kimberly MM, Waymack PP, Smith SJ, Cooper GR, Sampson EJ. A reference method laboratory network for cholesterol: a model for standardization and improvement of clinical laboratory measurements. Clin Chem 2000;46:1762–72. Passing H, Bablok W. A new biometrical procedure for testing the equality of measurements from two different analytical methods. Part I. J Clin Chem Clin Biochem 1983;21:709 –20. Passing H, Bablok W. A new biometrical procedure for testing the
21. 22.
23.
24.
25.
26.
27.
28.
29.
equality of measurements from two different analytical methods. Part II. J Clin Chem Clin Biochem 1984;22:431– 45. Franzini C, Ceriotti F. Impact of reference materials on accuracy in clinical chemistry. Clin Biochem 1998;31:449 –57. Nauck M, Ma¨ rz W, Jarausch J, Cobbaert C, Sa¨ gers A, Bernard D, et al. Multicenter evaluation of a homogenous assay for HDLcholesterol without sample pretreatment. Clin Chem 1997;43: 1622–9. Halloran P, Roetering H, Pisani T, van den Berg B, Cobbaert C. Reference standardization and analytical performance of a liquid homogenous HDL-cholesterol method compared to a chemical precipitation method. Arch Pathol Lab Med 1999;123:317–26. Nauck M, Graziani MS, Jarausch J, Bruton D, Cobbaert C, Cole TG, et al. A new liquid homogeneous assay for HDL cholesterol determination evaluated in seven laboratories in Europe and the United States. Clin Chem Lab Med 1999;37:1067–76. Cobbaert C, Luderer TKJ. Total error evaluation of Roche Direct HDL-cholesterol reagent and calibrator across 31 lot combinations: a 2-year experience [Letter]. Clin Chem 2000;46:133– 4. Lehmann P, Busse-Grawitz A, Cobbaert C, Cole T, Diegmann J, Gillery P, et al. Multicenter evaluation of a new liquid formulation of homogeneous assay for HDL-cholesterol [Abstract]. Clin Chem Lab Med 2001;39(Suppl):S289. Demacker PNM, Toenhake-Dijkstra H, de Rijke Y, Stalenhoef AFH, Stuyt PMJ, Willems HL. On the presumed inaccuracy of the Friedewald formula in hypertriglyceridemic plasma: a role for imprecise analysis? Clin Chem 1996;42:1491– 4. Nauck M, Warnick GR, Rifai N. Methods for measurement of LDL-c: a critical assessment of direct measurement by homogeneous assays versus calculation [Review]. Clin Chem 2002;48: 236 –54. Stuart M, Squirrell A. Accreditation of reference material producers. Accred Qual Assur 2001;6:38 – 40.