Journal of Experimental Psychology: General 2014, Vol. 143, No. 1, 455– 472
© 2013 American Psychological Association 0096-3445/14/$12.00 DOI: 10.1037/a0032122
Selective Stopping? Maybe Not Patrick G. Bissett and Gordon D. Logan
This document is copyrighted by the American Psychological Association or one of its allied publishers. This article is intended solely for the personal use of the individual user and is not to be disseminated broadly.
Vanderbilt University Selective stopping paradigms address selectivity in controlled behavior, as subjects stop certain responses or responses to certain stimuli. The literature has discussed 2 strategies for selective stopping. First, selective stopping may prolong the stop process by adding a discrimination stage (Independent Discriminate then Stop). Second, selective stopping may involve stopping nonselectively and then restarting the response if the signal is an ignore signal (Stop then Discriminate). We discovered a variant of the first strategy that occurred often in our experiments and previously published experiments: The requirement to discriminate stop and ignore signals may interact with the go process, invalidating the independent race model (Dependent Discriminate then Stop). Our experiments focused on stimulus selective stopping, in which subjects stop to one signal and ignore another. When stop and ignore signals were equally likely, some subjects used the Stop then Discriminate strategy and others used the Dependent Discriminate then Stop strategy. When stop signals were more frequent than ignore signals, most subjects used the Stop then Discriminate strategy; when ignore signals were more frequent than stop signals, most subjects used the Dependent Discriminate then Stop strategy. The commonly accepted Independent Discriminate then Stop strategy was seldom implemented. Selective stopping was either not selective (Stop then Discriminate), or interacted with going (Dependent Discriminate then Stop). Implications for the cognitive science, lifespan development, clinical science, and neuroscience of selective stopping are discussed. Keywords: cognitive control, race model, response inhibition, selective stop-signal paradigm, strategy
several clinical and neurological disorders (Lipszyc & Schachar, 2010), including attention-deficit/hyperactivity disorder (ADHD; Schachar & Logan, 1990), schizophrenia (Thakkar, Schall, Boucher, Logan, & Park, 2011), and Parkinson’s disease (Gauggel, Rieger, & Feghoff, 2004). The simple stop-signal paradigm does not address the selectivity of the control system. Selectivity has been an important theme in the cognitive control literature, with research focusing on how well we select goal-relevant stimuli and resist or inhibit distraction (Broadbent, 1957; Eriksen & Eriksen, 1974). Until recently, the selectivity of inhibitory control has been largely ignored, but this has changed with the increasing use of selective stopping paradigms (Aron, 2011). A control system that can efficiently stop to some stimuli (red light) but not others (green light) or stop certain actions (walking) but not others (talking) yields useful flexibility. The selective stopping paradigm is being used to address questions in many disciplines. In lifespan development, selective stopping is impaired in children, but there is little impairment in old age (Bedard et al., 2002; van de Laar, van den Wildbenberg, van Boxtel, & van der Molen, 2011). In human neuroscience, selective stopping has been used to separate inhibitory activity from attentional activity (Sharp et al., 2010). In clinical psychology, children with ADHD have much slower selective stop-signal response time (SSRT) than controls (Bedard et al., 2003). All selective stopping results rest on the independent race model (Logan & Cowan, 1984) and assume the same independence between going and stopping that is commonly observed in simple stopping. We test this assumption, showing that it is violated in many subjects, both in our data and in previous data. We explore the strategic heterogeneity across subjects that yields this violation in some people and not others and test to see if strategy adoption is affected by task demands. More generally, we take a step toward
Cognitive control is recruited when our previous goals are inappropriate or no longer relevant. A drastic form of control is complete inhibition, which is indexed by the stop-signal paradigm (Logan & Cowan, 1984; Vince, 1948). The stop-signal paradigm involves stopping a choice response when an infrequent signal occurs. Most studies use a simple stopping paradigm, in which all responses must be stopped when the one and only stop signal occurs. The simple stopsignal paradigm has proven useful in understanding response inhibition (Logan, 1994; Logan & Cowan, 1984; Verbruggen & Logan, 2008c); sequential control adjustments (Bissett & Logan, 2011; Rieger & Gauggel, 1999; Verbruggen, Logan, Liefooghe, & Vandierendonck, 2008); the neural underpinnings of cognitive control (Aron & Poldrack, 2006; Boucher, Palmeri, Logan, & Schall, 2007; Hanes, Patterson, & Schall, 1998); the lifespan development of control (Williams, Ponesse, Schachar, Logan, & Tannock, 1999); and
This article was published Online First March 11, 2013. Patrick G. Bissett and Gordon D. Logan, Department of Psychology, Vanderbilt University. This research was supported by National Science Foundation Grant BCS-0957074 and National Eye Institute Grant R01-EY021833-01. We would like to thank Valerie Bonnelle, David Sharp, Marijke van de Laar, Wery van den Wildenberg, and Frederick Verbruggen for providing us individual subject means and standard deviations from their published selective stopping articles (Sharp et al., 2010; van de Laar et al., 2010, 2011; van den Wildenberg & van der Molen, 2004; Verbruggen et al., 2006, 2008; Verbruggen & Logan, 2009c) for the reanalysis presented in the results section of Experiment 1. Correspondence concerning this article should be addressed to Patrick G. Bissett, Department of Psychology, Vanderbilt University, Nashville, TN 37240. E-mail:
[email protected] 455
BISSETT AND LOGAN
456
understanding how subjects stop selectively, one that is necessary before the selective stopping task can provide insight into the various domains that examine response inhibition (see Appendix; Verbruggen, Chambers, & Logan, in press).
This document is copyrighted by the American Psychological Association or one of its allied publishers. This article is intended solely for the personal use of the individual user and is not to be disseminated broadly.
Types of Selective Stopping Existing selective stopping research includes a heterogeneous set of paradigms, all of which are called selective stopping. We report an investigation of what we call stimulus selective stopping (Bedard et al., 2002, 2003; Dimoska, Johnstone, & Barry, 2006; Sharp et al., 2010; van de Laar, van den Wildenberg, van Boxtel, & van der Molen, 2010; van de Laar et al., 2011; van den Wildenberg & van der Molen, 2004; van Gaal, Lamme, Fahrenfort, & Ridderinkhof, 2011; Verbruggen, Liefooghe, & Vanderiendonck, 2006; Verbruggen & Logan, 2009c; Verbruggen et al., 2008). In this paradigm, two different signals can be presented on a trial, and subjects must stop if one of them occurs (stop signal), but not if the other occurs (ignore signal). The second type of selective stopping is what we call motor selective stopping. In this paradigm, subjects must stop some of their responses but not others. A common implementation of this paradigm, which we call conditional motor selective stopping, has subjects stop if a stop signal occurs and they were going to make one response (e.g., a right hand response) but not if a stop signal occurs and they were going to make the other response (e.g., a left hand response) (Aron, Behrens, Smith, Frank, & Poldrack, 2007; Cai, George, Verbruggen, Chambers, & Aron, 2012; De Jong, Coles, & Logan, 1995; Greenhouse, Oldenkamp, & Aron, 2012; Jahfari, Stinear, Claffey, Verbruggen, & Aron, 2010; Logan, Kantowitz, & Riegler, 1986; Swann et al., 2009; Verbruggen, Liefooghe, & Vandierendonck, 2005). This form of motor selective stopping is “conditional” because stopping depends on the outcome of go task response selection. Researchers have also investigated unconditional motor selective stopping, in which subjects make two responses (usually bimanual) on each trial, and stop signals indicate whether subjects must stop one response or the other response (Aron & Verbruggen, 2008; Cai et al., 2012; Cai, Oldenkamp, & Aron, 2011; Claffey, Sheldon, Stinear, Verbruggen, & Aron, 2010; Coxon, Stinear, & Byblow, 2007; Majid, Cai, Goerge, Verbruggen, & Aron, 2012). The stop stimulus or a pretrial cue indicates which response to inhibit, so stopping is not conditional on the outcome of go task response selection. Finally, some researchers have begun to combine both stimulus and motor selective stopping (van de Laar et al., 2010). Together, selective stopping includes a heterogeneous set of tasks that share the fundamental requirement of stopping to selected stimuli or responses but may not share the same selection process. We focus on stimulus selective stopping in this report, hoping that our results address the fundamental requirement in all stopping tasks, and not just the specific requirements of stopping to one signal and ignoring the other. We focus on the strategies people use to stop selectively, using response time (RT) on nosignal, stop, and ignore trials to classify subjects’ strategies. Studies of all kinds of selective stopping have found that RT is considerably slower on ignore trials than on no-signal trials, suggesting that selective stopping impairs the go process. We focus on this impairment and other RT effects to learn how people stop selectively.
Strategies for Selective Stopping Our analysis of strategies for selective stopping focuses on three dependent measures: no-signal RT, signal-respond RT, and ignore RT. No-signal RT is RT for the go task on trials without stop and ignore signals. No-signal RT reflects the finishing time for the go task when there is no requirement to discriminate the stop signal or to stop. Signal-respond RT is go RT on trials on which a stop signal occurs but subjects fail to inhibit the response. Signalrespond RT is diagnostic of independence in the independent race model (Logan & Cowan, 1984), which is used to interpret all stop-signal experiments, including selective stopping studies. If the stop process and the go process are independent, then signalrespond RT should be faster than no-signal RT (Logan & Cowan, 1984; Verbruggen & Logan, 2009b). If they are not independent, then signal-respond RT may be as slow as no-signal RT and maybe even slower. Ignore RT is go RT on trials on which an ignore signal occurs so stopping is not required. If stopping and going are independent, ignore RT should not be different from no-signal RT. If it is different, subjects may not be performing the selective stop-signal task as expected. Together, no-signal RT, signalrespond RT, and ignore RT reflect the strategies subjects adopt to deal with the selective stopping task. The literature has distinguished two strategies for selective stopping. In the Independent Discriminate then Stop strategy, subjects discriminate the signal before deciding to stop. If the signal is a stop signal, they stop; if the signal is an ignore signal, they complete the go process as usual, without ever initiating the stop process. Discriminating the signal will increase the duration of the stop process, producing SSRTs that are slower than SSRTs in simple stopping paradigms (Donders, 1868/1969; van de Laar, et al., 2010), but if stopping and going are independent, discriminating the signal will have no effect on the go process. This appears to be the commonly assumed strategy in studies of stimulus selective stopping (e.g., van de Laar et al., 2010). This strategy makes characteristic predictions for no-signal, signalrespond, and ignore RT: Signal-respond RT should be faster than no-signal RT, reflecting the usual outcome of the race between stopping and going in the independent race model (Logan & Cowan, 1984), and ignore RT should not be different from nosignal RT because the go process should not be affected by the requirement to discriminate the stop signal. Researchers have also suggested a Stop then Discriminate strategy, in which subjects inhibit the response whenever a signal occurs, and then discriminate the signal to determine whether to respond (Coxon et al., 2007; De Jong et al., 1995). Discrimination of the signal occurs after SSRT, so SSRT should be the same as in simple stopping. This strategy also makes characteristic predictions for no-signal, signalrespond, and ignore RT: Signal-respond RT should be faster than no-signal RT because the go process races independently with a simple stopping process (Logan & Cowan, 1984). However, ignore RT should be much slower than no-signal RT because subjects stop and then restart their responses on ignore trials. The third possibility, which we call Dependent Discriminate then Stop, is a variant of the discriminate then stop strategy in which the requirement to discriminate stop and ignore signals interacts with the go process and slows go RT whenever a signal occurs. This interaction produces dependence between stopping and going that violates the assumptions of the independent race
This document is copyrighted by the American Psychological Association or one of its allied publishers. This article is intended solely for the personal use of the individual user and is not to be disseminated broadly.
SELECTIVE STOPPING? MAYBE NOT
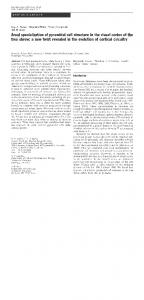
model (Logan & Cowan, 1984) and invalidates the usual estimates of SSRT. The Dependent Discriminate then Stop strategy makes characteristic predictions for no-signal, signal-respond and ignore RT: Signal-respond RT should not be faster than no-signal RT, and ignore RT should be slower than no-signal RT. The three strategies predict different patterns of differences between no-signal, signal-respond and ignore RTs, which are diagnostic of the different processes that underlie them. The patterns are represented in Figure 1 with the decision matrix that we used to classify each subject’s strategy. Our ability to distinguish between selective stopping strategies has important consequences for the many literatures that use the various selective stopping tasks. Subjects may not be doing what researchers think they are doing. The Dependent Discriminate then Stop strategy is a valid alternative to the commonly assumed Independent Discriminate then Stop strategy. Moreover, the data may not mean what researchers think they do. SSRT does not reflect a selective component if subjects use the Stop then Discriminate strategy, and SSRT cannot be estimated validly if subjects use the Dependent Discriminate then Stop strategy.
dependence and predict patterns of data that are consistent with it (i.e., signal-respond RT ⬍ no-signal RT). However, the Dependent Discriminate then Stop strategy assumes context dependence. Signalrespond RT will not be faster than no-signal RT, violating context independence. Violations of context independence invalidate the independent race model and invalidate estimates of SSRT that are based on it. Signal-respond RT is an important diagnostic of violations of context independence, but it is not reported often in selective stopping experiments. Some of the studies that do report it have found violations of context independence, showing signal-respond RT that is similar to or slower than no-signal RT (Dimoska et al., 2006; van de Laar et al., 2010). De Jong et al. (1995) compared observed and predicted signal-respond RT and found that observed signal-respond RT was slower than predicted, suggesting a violation of context independence. De Jong et al. (1995) used the race model to test context independence, but we are reluctant to do that: if the race model fails, then calculations based on the race model are suspect and should not be used to diagnose strategies.
The Present Experiments
Independent Race Model The independent race model (Logan & Cowan, 1984) explains stop-signal performance in terms of a race between a go process initiated by the go stimulus and a stop process initiated by the stop signal. The independent race model assumes two types of independence between the go and stop processes: stochastic independence and context independence (Colonius, 1990; Logan & Cowan, 1984). Stochastic independence assumes that the finishing times of the stop and go processes are independent (i.e., P(stop 艚 go|T ⫽ t) ⫽ P(stop| T ⫽ t) ⫻ P(go|T ⫽ t) for all t). The race model is robust with respect to violations of stochastic independence (Band, van der Molen & Logan, 2003; De Jong, Coles, Logan, & Gratton, 1990; Logan & Cowan, 1984). Context independence assumes that the finishing time of the go process is unaffected by the presence of the stop signal. Context independence can be tested by comparing signal-respond RT with no-signal RT. If context independence and stochastic independence are valid, then signal-respond RT should be faster than nosignal RT because signal-respond RTs come from trials on which the go process is faster than the stop process, whereas no-signal RTs come from all trials, fast and slow. The Independent Discriminate then Stop and Stop then Discriminate strategies assume context in-
457
In the present experiments, we investigate performance in stimulus selective stopping, distinguishing between the three strategies described above. Our analysis of strategies tests the context independence assumption to determine whether the independent race model is appropriate for interpreting selective stopping data. Independent Discriminate then Stop and Stop then Discriminate strategies assume context independence and encourage the use of the independent race model. The Dependent Discriminate then Stop strategy assumes context dependence and invalidates the use of the independent race model. In Experiment 1, we present two auditory signals, one a stop signal and one an ignore signal, each on a separate 20% of trials. In Experiments 2 and 3, we manipulate the percentage of stop and ignore signals. In Experiment 2, for some subjects, 32% of trials were stop trials and 8% of trials were ignore trials (frequent stop), and for other subjects the probabilities were reversed (frequent ignore). In Experiment 3, all subjects experienced both frequent stop and frequent ignore conditions across blocks and were told which condition they were in at the beginning of each 25-trial block. If strategy selection is flexible and controlled, subjects may employ a Stop then Discriminate strategy when stop signals are frequent to improve stopping at the expense of ignore RT and employ a Discriminate then Stop strategy when ignore signals are frequent to try to speed ignore RT at the expense of SSRT. If strategy selection is an enduring individual difference, subjects may use the same strategy inflexibly, regardless of signal frequency.
Experiment 1 Method
Figure 1. Decision matrix for strategy assignment based on mean nosignal response time (RT), mean signal-respond RT, and mean ignore RT.
Subjects. Twenty-four Vanderbilt University undergraduates were recruited from the Nashville area and were given partial coursecredit for a single 1-hr session. All subjects had normal or correctedto-normal vision. We replaced four subjects for accuracy below 85%, four subjects for unusually slow RT (⬎3 SDs above the mean), and
This document is copyrighted by the American Psychological Association or one of its allied publishers. This article is intended solely for the personal use of the individual user and is not to be disseminated broadly.
458
BISSETT AND LOGAN
one subject whose probabilities of successful stopping fell outside the 95% confidence interval of 0.5 probability of stopping to a stop signal, as assessed by a binomial distribution test. Apparatus and stimuli. The experiment was run on a Pentium Dual-Core PC running E-Prime 1 (http://pstnet.com). The stimuli were presented on a 48-cm cathode ray tube monitor. The go task was for subjects to respond to a single black shape on a white background presented in the center of the screen. The shape was chosen from a set of four shapes: triangle, circle, square, or rhombus. The height and width of each shape was 4 cm at the longest point. There were two tones, one 500 Hz and the other 750 Hz (both 70 dB, 100 ms) presented through closed headphones (Sennheiser eH 150). One tone acted as the stop signal and the other acted as the ignore signal, counterbalanced across subjects. Procedure. Each trial began with a 500-ms fixation cross, followed immediately by the presentation of the go stimulus for 850 ms. The go stimulus was followed by a 1,000-ms blank-screen intertrial interval (ITI). The go task was to respond quickly and accurately based upon the identity of the shape. Two of the shapes were mapped onto the “z” key on a standard QWERTY keyboard, and the other two were mapped onto the “m” key, with shape to key response mapping counterbalanced across subjects. Subjects responded z with their left index finger and m with their right index finger. They were instructed to respond as quickly as possible without sacrificing accuracy. On 40% of trials, one of two signals occurred. One signal was the stop signal, which occurred on a random 20% of trials, and subjects were instructed to try their best to stop their response when they heard it. Stop-Signal Delay (SSD) was initially set at 250 ms and was adjusted based upon a staircase tracking algorithm designed to achieve a 0.5 probability of responding given a stop signal (Levitt, 1971). Whenever a subject failed to stop to the stop signal, SSD was decreased by 50 ms, handicapping the race in favor of the stop process. Whenever a subject successfully inhibited to the stop signal, SSD was increased by 50 ms, handicapping the race in favor of the go process. This tracking procedure yields accurate estimates of SSRT (Band et al., 2003), especially when using the integration method for SSRT computation (Logan & Cowan, 1984; Verbruggen et al., in press), as used here. The other signal was the ignore signal, which occurred on a separate 20% of trials. When it occurred, subjects were instructed to respond as quickly and accurately as possible, just as they do on the 60% of trials without a signal. Signal delay on ignore trials was equal to the most recent stop trial SSD, and SSD was not adjusted on the basis of ignore trial performance. The experiment began with both written and verbal instructions. Subjects were instructed to respond quickly and accurately on no-signal and ignore trials but also to do their best to withhold their response on stop trials. After instructions, subjects were given 24 trials of experimenter-supervised practice. The first 12 trials did not include stop or ignore signals, and the final 12 included two stop and two ignore signals. After practice, subjects completed the main task, which included five blocks of 240 trials. At the end of each block, subjects were given a rest period in which they were presented with their mean no-signal RT and accuracy from the preceding block.
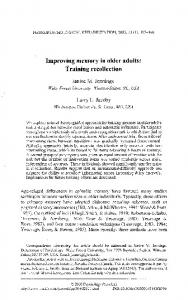
Results We first evaluated mean error and stop performance collapsed across strategies. Choice error rate on no-signal trials was 3.2%, which did not differ from choice error rate on ignore trials (2.8%), t(23) ⫽ 1.28, p ⫽ .21. Omissions errors occurred on 0.3% of no-signal trials and 1.3% of ignore trials, and this difference was significant, t(23) ⫽ 3.37, p ⬍ .01. Probability of responding given a stop signal was 0.5, suggesting that the SSD tracking algorithm worked as intended. Mean SSD was 245 ms. For mean RT analysis, we excluded omission errors but included commission. Signal-respond trials cannot be omissions by definition, so we exclude omissions from all conditions. Signalrespond trials are defined by any response occurring, so we include all signal-respond trials and all no-signal and ignore trials on which a response occurred. No-signal RT was 549 ms, which did not significantly differ from signal-respond RT (543 ms), t(23) ⫽ 0.77, p ⬎ .4. Ignore RT was 655 ms, which is considerably slower than no-signal RT (549 ms), t(23) ⫽ 15.57, p ⬍ .01 (see Figure 2a for cumulative distribution functions for RT across all subjects). These results suggest violations of context independence (also see Dimoska et al., 2006; van de Laar et al., 2010) and are more consistent with a Dependent Discriminate then Stop strategy than with the Independent Discriminate then Stop or the Stop then Discriminate strategies assumed in the literature. We classified each subject’s strategy by comparing their mean no-signal RT, signal-respond RT, and ignore RT (see Figure 1). Subjects were classified as using the Independent Discriminate then Stop strategy if their signal-respond RT was faster than their no-signal RT and their ignore RT was no slower than their nosignal RT. Subjects were classified as using the Stop then Discriminate strategy if their signal-respond RT was faster than their no-signal RT and their ignore RT was slower than their no-signal RT. Subjects were classified as using the Dependent Discriminate then Stop strategy if their signal-respond RT was no faster than their no-signal RT and their ignore RT was slower than their no-signal RT. These classifications involve accepting and rejecting null hypotheses. We used the Bayes factor to compare the evidence for and against the null hypotheses without bias (Rouder, Speckman, Sun, Morey, & Iverson, 2009). The Bayes factor is the ratio of the odds in favor of the null hypothesis to the odds in favor of the alternative hypothesis. A Bayes factor of 1 means the odds in favor of the null hypothesis are no better than the odds against it. Numbers greater than 1 support the null hypothesis, and numbers less than 1 support the alternative hypothesis. Consequently, we accepted the null hypothesis when the Bayes factor was greater than 1 and accepted the alternative hypothesis (that there was a difference) when the Bayes factor was less than 1. In comparing signal-respond versus no-signal RTs, we only accepted the alternative if signal-respond trials were faster than no-signal trials. We calculated the Bayes factor by calculating the mean and standard deviation of no-signal, signal-respond, and ignore RTs separately for each subject. Then we calculated two independent samples t tests, one comparing signal-respond RT with no-signal RT, and one comparing ignore RT with no-signal RT. We used Jeff Rouder’s Bayes factor calculator on the Perception and Cognition Lab website (http:// pcl.missouri.edu/bf-two-sample) to convert t tests and sample sizes to
459
This document is copyrighted by the American Psychological Association or one of its allied publishers. This article is intended solely for the personal use of the individual user and is not to be disseminated broadly.
SELECTIVE STOPPING? MAYBE NOT
Figure 2. Experiment 1 cumulative distribution functions of response time (RT) for signal-respond trials, no-signal trials, and ignore trials for all subjects (a), subjects who used the Stop then Discriminate strategy (b), and subjects who used the Dependent Discriminate then Stop strategy (c).
Bayes factors. We used the recommended Jeffrey-Zellner-Slow Prior with the default value of 1, which is appropriate if there are no strong prior assumptions (Rouder et al., 2009). Using this procedure, we were able to classify every subject. We found no evidence of the Independent Discriminate then Stop
strategy in any of the 24 subjects, contrary to the common assumption in the literature. We found evidence of the Stop then Discriminate strategy in eight of the 24 subjects. Their cumulative distributions are presented in Figure 2b. We found evidence of Dependent Discriminate then Stop in the remaining 16 of the 24
BISSETT AND LOGAN
This document is copyrighted by the American Psychological Association or one of its allied publishers. This article is intended solely for the personal use of the individual user and is not to be disseminated broadly.
460
subjects. Their cumulative distributions are presented in Figure 2c. The mean RTs across subjects for each strategy are presented in Table 1. These results are remarkable. If they are representative, they suggest that subjects in published stimulus selective stopping experiments may not stop selectively and independently, as researchers commonly assume. Instead, they may either not stop selectively or stop selectively in a way that violates the race model. In either case, published estimates of selective SSRT may not be valid. To determine whether these strategy adoption rates are representative, we obtained data from eight published experiments on stimulus selective stopping (Sharp et al., 2010; van de Laar et al., 2010, 2011; van den Wildenberg & van der Molen, 2004; Verbruggen et al., 2006, 2008; Verbruggen & Logan, 2009c). In each experiment, stop signals and ignore signals were presented equally often, but the probability of either signal occurring differed between experiments (range 0.25 to 0.4). Some experiments used auditory signals; some used visual signals. We categorized each subject’s strategy with the Bayes factor analysis described above. We assumed no omissions occurred on no-signal and ignore trials and a 0.5 probability of response given a stop signal to estimate sample size for the Bayes factor calculations. The results are presented in Table 2. Each experiment showed evidence of Stop then Discriminate and Dependent Discriminate then Stop strategies. The commonly assumed Independent Discriminate then Stop strategy was only found in four of the eight experiments. In the total sample of 157 subjects, 47 subjects (30%) used the Stop then Discriminate strategy, 92 (59%) used the Dependent Discriminate then Stop strategy, and only 10 (6%) used the Independent Discriminate then Stop strategy. Eight (5%) could not be categorized (the null hypothesis was supported in both comparisons). Taken together, these previously published results reveal a strikingly similar distribution of strategy adoption rates to what we observed in our experiment: About one third of subjects used the Stop then Discriminate strategy, two thirds used the Dependent Discriminate
then Stop strategy, and very few used the Independent Discriminate then Stop strategy.
Conclusions Experiment 1 examined the strategies used in stimulus selective stopping. We showed that some subjects used a Stop then Discriminate strategy but most used a Dependent Discriminate then Stop strategy. This result was corroborated in eight previously published experiments on stimulus selective stopping. We found very little evidence for Independent Discriminate then Stop, the strategy often assumed in the literature. This suggests that most subjects either stop nonselectively (Stop then Discriminate) or violate the race model for stopping (Dependent Discriminate then Stop), invalidating SSRT estimates.
Experiment 2 In Experiment 2, we manipulated the probability of stop and ignore signals to determine whether the strategy subjects adopt is an enduring individual difference or an option they choose to satisfy task demands. If the strategy is an enduring individual difference, the probability of stop and ignore signals should have no effect. However, if the strategy is a choice, then the probability of stop and ignore signals might influence the choice. If stop signals are likely, subjects may be encouraged to emphasize stopping, and adopt a Stop then Discriminate strategy that yields fast nonselective stopping but slow ignore RT. If ignore signals are likely, subjects may be encouraged to emphasize going, and adopt a Discriminate then Stop strategy that yields faster ignore RT but slower SSRT. Experiment 2 also provided an opportunity to replicate the surprising dependence between stop and go processes seen in the Dependent Discriminate then Stop strategy, and to determine whether that dependence varies strategically with the probability of stop and ignore signals.
Table 1 Mean Reaction Times Across Experiment and Strategy for Signal-Respond, No-Signal, and Ignore Trials Experiment/Strategy Experiment 1 Stop then Discriminate Dependent Discriminate then Stop Experiment 2 Frequent Stop Group Stop then Discriminate Dependent Discriminate then Stop Independent Discriminate then Stop Experiment 2 Frequent Ignore Group Stop then Discriminate Dependent Discriminate then Stop Uncategorized Experiment 3 Frequent Stop Blocks Stop then Discriminate Dependent Discriminate then Stop Independent Discriminate then Stop Experiment 3 Frequent Ignore Blocks Stop then Discriminate Dependent Discriminate then Stop Uncategorized Note.
N
Signal-Respond
No-Signal
Ignore
8 16
558 536
600 523
697 633
11 4 3
597 462 643
662 455 716
807 609 738
4 12 2
535 507 461
582 508 452
621 558 460
11 10 3
542 538 788
600 547 898
706 672 964
2 21 1
585 524 578
685 514 559
782 581 551
N ⫽ Number of subjects making each strategy choice. Reaction times in milliseconds.
SELECTIVE STOPPING? MAYBE NOT
461
Table 2 Strategy Adoption Rates Across Eight Previously Published Stimulus Selective Stopping Datasets
This document is copyrighted by the American Psychological Association or one of its allied publishers. This article is intended solely for the personal use of the individual user and is not to be disseminated broadly.
Article Sharp et al. (2010) van de Laar et al. (2010) van de Laar et al. (2010) van de Laar et al. (2011) van den Wildenberg & van der Molen (2004) Verbruggen et al. (2006) Verbruggen et al. (2008) Verbruggen & Logan (2009c) Total Percentage
Details Experiment 1 Experiment 2 Young Adult Group Young Adult Group. Congruent Experiment 2 Experiment 4 Experiment 4
N
S⬎D
DD⬎S
ID⬎S
Uncategorized
26 16 16 17 28
6 6 3 4 8
7 9 13 13 19
7 1 0 0 1
6 0 0 0 0
19 16 19
9 4 7
8 12 11
1 0 0
1 0 1
157
47 30%
93 59%
10 6%
8 5%
Note. N ⫽ Number of total subjects in each study; S ⬎ D ⫽ Stop then Discriminate; D D ⬎ S ⫽ Dependent Discriminate then Stop; I D ⬎ S ⫽ Independent Discriminate then Stop.
Method Subjects. Thirty-six Vanderbilt University undergraduates were recruited from the Nashville area and were given partial course credit or $12 for a single 1-hr session. All subjects had normal or corrected-to-normal vision. The subjects were randomly assigned into one of two groups, the frequent stop group or the frequent ignore group. We replaced five subjects for accuracy below 85%, one subject for unusually slow RT (⬎3 SDs above the mean), and two subjects whose probabilities of successful stopping fell outside the 95% confidence interval of 0.5 probability of stopping to a stop signal, as assessed by a binomial distribution test. Apparatus and stimuli. The apparatus and stimuli were the same as in Experiment 1. Procedure. The procedure for Experiment 2 was the same as Experiment 1, with the following exceptions. Subjects were randomly assigned to one of two groups. In the frequent stop group, 32% of all trials were stop trials, 8% of all trials were ignore trials, and 60% of all trials were no-signal trials. In the frequent ignore group, 32% of all trials were ignore trials, 8% of all trials were stop trials, and 60% of all trials were no-signal trials. In experimentersupervised practice, the first 12 trials did not include stop or ignore signals, and the final 12 included four stop signals and one ignore signal for the frequent stop group and four ignore signals and one stop for the frequent ignore group.
Results We first evaluated mean error and stop performance for each group. No-signal choice error rate was higher for frequent stop subjects (5.0%) than for frequent ignore subjects (2.8%), t(34) ⫽ 2.56, p ⬍ .05. Ignore-trial choice error rate was also higher for frequent stop subjects (4.3%) than for frequent ignore subjects (2.6%), t(34) ⫽ 2.34, p ⬍ .05. No-signal omission errors were more likely for frequent stop subjects (1.6%) than for frequent ignore subjects (0.3%), t(34) ⫽ 2.85, p ⬍ .01. Ignore omission errors were much more likely for frequent stop subjects (10.3%) than for frequent ignore subjects (0.1%), t(34) ⫽ 4.14, p ⬍ .001. Probability of responding given a stop signal was lower for frequent stop subjects (0.49) than for frequent ignore subjects (0.51),
t(34) ⫽ 3.63, p ⬍ .001, but both were very similar to the targeted 0.5. Mean SSD was longer for frequent stop subjects (373 ms) than for frequent ignore subjects (196 ms), t(34) ⫽ 3.17, p ⬍ .01. Mean no-signal RT was slower for frequent stop subjects (625 ms) than for frequent ignore subjects (518 ms), t(34) ⫽ 2.50, p ⬍ .05. This aligns with previous results showing that RT increases with the probability of a stop signal (Bissett & Logan, 2011; Logan, 1981; Logan & Burkell, 1986). For frequent stop subjects, signal-respond RT (575 ms) was considerably faster than no-signal RT (625 ms), t(17) ⫽ 4.44, p ⬍ .01, and ignore RT (752 ms) was considerably slower than no-signal RT (625 ms), t(17) ⫽ 7.94, p ⬍ .01. However, for frequent ignore subjects, signal-respond RT (508 ms) did not differ from no-signal RT (518 ms), t(17) ⫽ 1.74, p ⫽ .1, and ignore RT (561 ms) was slower than no-signal RT (518 ms), t(17) ⫽ 9.15, p ⬍ .01. The cumulative distribution functions for the two groups are presented in Figure 3a and 3b. We categorized subjects’ strategies with the Bayes factor (Rouder et al., 2009). In the frequent stop group, 11 of 18 subjects used Stop then Discriminate, four used Dependent Discriminate then Stop, and three used Independent Discriminate then Stop. In the frequent ignore group, only four subjects used Stop then Discriminate, 12 used Dependent Discriminate then Stop, and two could not be categorized. The mean RTs for each strategy in each group appear in Table 1. To compare the distribution of strategies across groups, we categorized each subject into one of the four cells in Figure 1 and used the Freeman-Halton extension of the Fisher Exact Test (Freeman & Halton, 1951), which showed that the distribution of strategies across groups was significantly different (p ⬍ .01).
Conclusions Experiment 2 manipulated the probability of stop and ignore signals across subjects and showed that more subjects used the Stop then Discriminate strategy when stop signals were frequent and more subjects used the Dependent Discriminate then Stop strategy when ignore signals were frequent. This suggests that most subjects adjust their strategy based upon task demands, using a strategy that results in faster stopping and slower ignore RT if stop signals are frequent and slower stopping and faster ignore RT if ignore signals are frequent.
BISSETT AND LOGAN
This document is copyrighted by the American Psychological Association or one of its allied publishers. This article is intended solely for the personal use of the individual user and is not to be disseminated broadly.
462
Figure 3. Experiment 2 cumulative distribution functions of response time (RT) for signal-respond trials, no-signal trials, and ignore trials for the frequent stop subjects (a) and the frequent ignore subjects (b).
Experiment 3 Experiment 2 manipulated stop and ignore probabilities between subjects, so it is possible that the different distributions of strategies we observed in frequent ignore and frequent stop groups were due to differences between the individuals in the groups, and not to strategic choices subjects made in response to task demands. To address this possibility, we manipulated the frequency of stop and ignore signals within subject in Experiment 3. We determined whether subjects switch between strategies when frequent stop and frequent ignore conditions alternate in short blocks of 25 trials.
Method Subjects. Twenty-four Vanderbilt University undergraduates were recruited from the Nashville area and were given partial course-credit for a single 1-hr session. All subjects had normal or corrected-to-normal vision. We replaced two subjects for accuracy below 85%, one subject for unusually slow RT (⬎3 SDs above the mean), and five subjects whose probabilities of successful stopping fell outside the 95% confidence interval of 0.5 probability of stopping to a stop signal for either block type, as assessed by a binomial distribution test.
Apparatus and stimuli. The apparatus and stimuli were the same as in Experiment 2. Procedure. The procedure for Experiment 3 was the same as Experiment 2, with the following exceptions. The task was separated into 25 trial blocks. Subjects alternated between frequent stop blocks (15 no-signal trials, eight stop trials, two ignore trials) and frequent ignore blocks (15 no-signal trials, eight ignore trials, two stop trials), with the order of blocks counterbalanced across subjects. There were separate SSD tracking algorithms for each block type. Subjects were told in the instructions that cues would inform them of which type of signal would be more likely to occur in the next block. A cue that said “Frequent Stop” or “Frequent Ignore” was presented for 1,500 ms before each block. In experimentsupervised practice, the first 12 trials did not include stop or ignore signals, and the final 24 were equally split into 12 frequent stop (four stop and one ignore) and 12 frequent ignore (four ignore and one stop) trials, with order counterbalanced across subjects. There was only one session with 44 blocks of 25 trials. Every 100 trials, subjects were given a rest period in which they were presented with their mean no-signal RT and accuracy from the preceding four blocks.
SELECTIVE STOPPING? MAYBE NOT
This document is copyrighted by the American Psychological Association or one of its allied publishers. This article is intended solely for the personal use of the individual user and is not to be disseminated broadly.
Results We first evaluated mean error and stop performance measures for each block type. No-signal choice error rate was higher in frequent stop blocks (4.4%) than in frequent ignore blocks (3.3%), t(23) ⫽ 3.80, p ⬍ .01. Ignore trial choice error rate was marginally higher in frequent stop blocks (4.7%) than frequent ignore blocks (3.4%), t(23) ⫽ 1.88, p ⫽ .07. On no-signal trials, there were very few omissions in both frequent stop (0.2%) and frequent ignore (0.3%) blocks, and the blocks did not differ (p ⬎ .2). Omissions were higher on ignore trials in the frequent stop block (2.7%) than in the frequent ignore block (0.7%), t(23) ⫽ 3.83, p ⬍ .01. Probability of responding on stop trials was lower in the frequent stop blocks (0.49) than in the frequent ignore blocks (0.53), t(23) ⫽ 4.61, p ⬍ .01, but both were close to the targeted 0.5. Mean SSD was much longer in the frequent stop blocks (368 ms) than in the frequent ignore blocks (184 ms), t(23) ⫽ 7.57, p ⬍ .01. Mean no-signal RT was slower in frequent stop blocks (615 ms) than frequent ignore blocks (530 ms), t(23) ⫽ 4.50, p ⬍ .01. In frequent stop blocks, signal-respond RT (571 ms) was faster than no-signal RT (615 ms), t(23) ⫽ 5.24, p ⬍ .01, and
463
ignore RT (724 ms) was slower than no-signal RT (615 ms), t(23) ⫽ 13.0, p ⬍ .01. In frequent ignore blocks, signal-respond RT (531 ms) was not different from no-signal RT (530 ms), t(23) ⬍ 1, but ignore RT (597 ms) was slower than no-signal RT (530 ms), t(23) ⫽ 9.86, p ⬍ .01. Cumulative distribution functions are presented in Figure 4 for the frequent stop blocks (a) and the frequent ignore blocks (b). We categorized each subject’s strategy separately in frequent stop and frequent ignore blocks using the Bayes factor analysis (Rouder et al., 2009). In the frequent stop blocks, 11 of 24 used Stop then Discriminate, 10 used Dependent Discriminate then Stop, and three used Independent Discriminate then Stop. In the frequent ignore blocks, only two subjects used Stop then Discriminate, 21 used Dependent Discriminate then Stop, and one was uncategorized. Ten of the 24 subjects used the same strategy in both blocks. Nine of those 10 used the Dependent Discriminate then Stop strategy, and the other used the Stop then Discriminate strategy. The mean RTs for each strategy in each block type appear in Table 1. Fisher’s exact test showed that strategy adoption differed by block (p ⬍ .01), suggesting that subjects flexibly changed strategy based upon task demands.
Figure 4. Experiment 3 cumulative distribution functions of response time (RT) for signal-respond trials, no-signal trials, and ignore trials for the frequent stop blocks (a) and the frequent ignore blocks (b).
BISSETT AND LOGAN
464
This document is copyrighted by the American Psychological Association or one of its allied publishers. This article is intended solely for the personal use of the individual user and is not to be disseminated broadly.
Conclusions We cued subjects every 25 trials on whether stop or ignore signals would be frequent. Fourteen subjects switched strategies between blocks, with more of the Stop then Discriminate strategy in the frequent stop blocks and more of the Dependent Discriminate then Stop strategy in frequent ignore blocks. This reveals within-subject strategic flexibility for choosing selective stopping strategies. Ten subjects did not switch strategies between blocks. These subjects either may not have been able to use different strategies, suggesting a strategic repertoire of one, or they chose not to switch strategies. If subjects chose not to switch strategies, explicit instructions to change strategies or rewards may induce more subjects to switch.
General Discussion Selective stopping paradigms are intended to capture more complex control processes than those involved in simple stopping. Stimulus selective stopping requires discriminating stop signals from ignore signals. Researchers assume that adding this requirement only changes the stop process, leaving the go process intact. Our results suggest that stimulus selective stopping invites strategies that challenge this assumption. People often use a Stop then Discriminate strategy, in which they stop whenever a signal occurs and restart the go process if the signal is an ignore signal. Thus, the process that stops the response is not selective, so SSRT does not measure the added requirement to discriminate between stop and ignore signals. People often use the Discriminate then Stop strategy that researchers expect, but the requirement to discriminate creates a dependency between stop and go processes, invalidating the independent race model and invalidating estimates of SSRT. In Experiment 1, when stop and ignore signals were equally likely, a third of the subjects used the Stop then Discriminate strategy, but two thirds used the Dependent Discriminate then Stop strategy. In Experiment 2, when stop signals were more frequent, most subjects used the Stop then Discriminate strategy, speeding the stop process at the expense of slower ignore RT; when ignore signals were more frequent, most subjects used the Dependent Discriminate then Stop strategy, speeding ignore RT at the expense of slower SSRT. In Experiment 3, when stop and ignore probabilities were cued in short blocks, many subjects switched between the Stop then Discriminate strategy when stop signals were more frequent and the Dependent Discriminate then Stop strategy when ignore signals were more frequent. Thus, many subjects can employ more than one strategy. The lack of evidence for Independent Discriminate then Stop (across experiments, only six out of 84 subjects used this strategy) suggests that selective stopping usually entails either stopping nonselectively (Stop then Discriminate) or stopping selectively with strong dependence between stopping and going (Dependent Discriminate then Stop).
The Search for Selective SSRT The validity of the race model and SSRT calculation rests on the assumption of context independence, which states that go process
finishing time is unaffected by the presence of the stop signal (Colonius, 1990; Logan & Cowan, 1984). This assumption justifies the use of the no-signal RT distribution as an estimate of the underlying go distribution on stop trials. A common test for context independence involves comparing signal-respond RTs and no-signal RTs. The assumption is valid if signal-respond RTs are faster than no-signal RTs and invalid if they are not. If context independence is valid, SSRT can be computed with the integration method, using no-signal RTs, the probability responding given a stop signal, and SSD (Logan & Cowan, 1984; Verbruggen & Logan, 2009b). There is evidence here and in previous research on selective stopping (De Jong et al., 1995; Dimoska et al., 2006; Table 2) that the context independence assumption is violated at the group level. This collapses across the strategic heterogeneity observed between subjects and conditions. We computed SSRT for each subject and strategy and presented them in Table 3. The Independent Discriminate then Stop strategy, which assumes context independence and allows valid calculation of selective SSRT, is very seldom implemented. In the six instances in which we observed the Independent Discriminate then Stop strategy, go RT was very slow (M ⫽ 809 ms) and SSRT was very fast (M ⫽ 170 ms). In the Introduction, we suggested that the Independent Discriminate then Stop strategy should involve slower SSRT than simple stopping, as the signal needs to be discriminated, which is a slower process than the detection necessary in simple stopping (Donders, 1868/1969). These SSRT estimates are numerically faster than what we observed in subjects who used the Stop then Discriminate strategy or in usual simple stopping tasks. Subjects who used Independent Discriminate then Stop may have traded go processing speed for faster stop processing (Bissett & Logan, 2011, 2012). Because this strategy was so rare, we hesitate to make any strong conclusions. The Stop then Discriminate strategy allows valid calculation of SSRT with the usual computations, but we propose it does not reflect selective SSRT. Subjects’ behavior is selective, as they stop when stop signals occur and respond when ignore signals occur, but they do not use a selective stop mechanism. These subjects appear to stop nonselectively whenever a tone occurs. This explains why their SSRTs (232 ms) are as fast as previous estimates of simple SSRT in a similar task (⬃230 ms, Bissett & Logan,
Table 3 Stop-Signal Reaction Time Across Strategies and Computation Experiment/Strategy
N
SSRT
Independent Discriminate then Stop Stop then Discriminate Dependent Discriminate then Stop No Signal Ignore Uncategorized
6 36 63
170 232
3
313 392 432
Note. N ⫽ Number of subjects using each strategy choice. In Experiment 3, each subject is counted twice in this table, once for their Frequent Stop block strategy and again for their Frequent Ignore block strategy. SSRT is presented in milliseconds. SSRT is calculated with the integration method using the no-signal RT as the underlying go distribution except in the case of the Ignore row under Dependent Discriminate then Stop, in which ignore RT is used.
This document is copyrighted by the American Psychological Association or one of its allied publishers. This article is intended solely for the personal use of the individual user and is not to be disseminated broadly.
SELECTIVE STOPPING? MAYBE NOT
2011, Experiment 1). This suggests that the SSRT computed for subjects who use the Stop then Discriminate strategy reflects a nonselective inhibition process. Subjects who used the Dependent Discriminate then Stop strategy violated the context independence assumption, so the usual method of calculating SSRT using no-signal RT as the underlying go distribution on stop trials is invalid. It may be possible to use the ignore RT distribution to estimate the underlying go distribution on stop trials, but this requires the strong assumption that the dependence between going and signal processing is the same on stop and ignore trials. In the next section, we suggest three explanations for this dependency that differ on their support for this assumption, but we do not endorse any of them, and we urge caution in making this assumption. For completeness and comparison to previous studies, we do include SSRT computations using both the no-signal and ignore RT distributions as the underlying go distribution on stop trials, even though the former is certainly invalid and the latter may be invalid. When we used the no-signal distribution to estimate the underlying go distribution on stop trials, we found that subjects who used the Dependent Discriminate then Stop strategy had slow SSRTs (M ⫽ 313 ms). When we used the ignore RT distribution to estimate the underlying go distribution, we found even slower SSRTs (M ⫽ 392 ms). The slow SSRTs in both calculations are consistent with the hypothesis that subjects engage a selective stopping mechanism that involves an additional discrimination stage (Donders, 1868/1969). The prevalence of the Dependent Discriminate then Stop strategy may explain why selective SSRT is slower than simple SSRT in the literature (e.g., van de Laar et al., 2010).
What Produces the Dependency in Dependent Discriminate Then Stop? The most common strategy, Dependent Discriminate then Stop, involves dependence between going and discriminating the stop and ignore signal. We suggest three potential explanations for this dependence and discuss the implications for SSRT calculation. First, the dependence may reflect dual-task interference. The discrimination process and the go process may require the same processing bottleneck (Pashler, 1994; Welford, 1952) or may share common resources (Dux & Marios, 2009; Navon & Gopher, 1979). Discriminating the signal may occupy the bottleneck or take resources away from go processing, slowing both signal-respond RT and ignore RT. However, simple stopping does not occupy the same bottleneck as the go task (Yamaguchi, Logan, & Bissett, 2012), and the tasks do not share obvious resources. The stop signals were auditory and the go signals were visual, and so should not share perceptual resources (Navon & Gopher, 1979; Treisman & Davies, 1973). The stop and ignore signals differed by 250 Hz, so the discrimination should not have demanded many resources. Our arbitrary four-stimuli-to-two-response go mapping may have been difficult for some subjects. The dual-task explanation would predict that a simpler two-stimuli-to-two-response go mapping may reduce the dependency between go and stop stimulus discrimination. The dual-task interference explanation suggests that the dependency between go processing and signal processing should
465
be the same on stop and ignore trials, because the discrimination process that interferes with going is required for both trial types. If going is slowed to the same degree on stop and ignore trials, then the ignore RT distribution can be used to estimate the underlying go distribution, instead of the no-signal RT distribution, and SSRT can be calculated with the mean or integration methods (Logan & Cowan, 1984; Verbruggen & Logan, 2009b). A second explanation is that the dependence reflects goal priming (Chartrand & Bargh, 1999; Verbruggen & Logan, 2009a). Stop and ignore signals may become associated with the stop goal, and subjects may retrieve the stop goal when stop and ignore signals are presented later in the experiment (Verbruggen & Logan, 2008a, 2008b). Activating the stop goal may slow go RT, increasing both signal-respond and ignore RTs. This association between signals and stop goals may slow signal-respond RT in selective stopping more than simple stopping because SSRT is slow in Dependent Discriminate then Stop, giving more time for the goal to be retrieved and affect go processing. However, stop signals may be associated more strongly with stopping than ignore signals, so the go process may be slowed more on stop trials than on ignore trials. If this is the case, then the ignore RT distribution cannot be used to estimate the underlying go distribution, and that complicates SSRT calculation. A third explanation is that stop and ignore signals partially activate the network that implements stopping. The interactive race model (Boucher et al., 2007) assumes a mutually inhibitory network of stop and go units. In simple stopping, the stop units become active late in processing when the significance of the stop signal is apprehended. In selective stopping, the stop units could become active as soon as a signal is detected, before stop and ignore signals are discriminated. Early, weak activation of the stop units would slow go processing on stop and ignore trials, producing signal-respond RTs that were slower than no-signal RTs. Brain imaging research has identified a network of regions that are involved in stopping (right inferior frontal gyrus, pre supplementary motor area, and the basal ganglia, Aron et al., 2007) and in braking responses in anticipation of stop signals (Chikazoe et al., 2009; Jahfari et al., 2010). In selective stopping, the presentation of a stop or ignore signal may activate the stopping network and slow the go process, producing signal-respond RTs that are slower than no-signal RTs. If the stop network was activated as soon as a signal was detected, with no information that would distinguish stop and ignore signals, then ignore RT could be used to estimate the underlying go RT distribution and calculate SSRT (e.g., by integration). However, if the network was activated after some distinguishing information was available, then there could be more activation on stop trials than on ignore trials. If there was, then ignore RT would underestimate the finishing time of the go process, so it could not be used to calculate SSRT.
Restart Cost or Restart Benefit in the Stop Then Discriminate Strategy? Many subjects use a Stop then Discriminate strategy that involves nonselective stopping followed by restarting the response. An open question is what happens to go activation on
This document is copyrighted by the American Psychological Association or one of its allied publishers. This article is intended solely for the personal use of the individual user and is not to be disseminated broadly.
466
BISSETT AND LOGAN
the same amount of activation is required for ignore and no-signal responses, so ignore RT should equal no-signal RT plus half of the time it takes to discriminate stop and ignore signals (half because subjects only restart on half of the trials). The data suggest this alternative is unlikely: In the 36 cases of the Stop then Discriminate strategy, ignore RT was 107 ms slower than no-signal RT, so discrimination time would be twice that value (i.e., 214 ms). Discrimination time is unlikely to be that long (Donders, 1868/ 1969), so we can reject this alternative. Second, go activation may decay completely during discrimination of stop and ignore signals, so the go process has to start from zero after discrimination is complete (Figure 5c). In this case, ignore RT would equal no-signal RT plus half of discrimination time plus the time spent accumulating go activation before the stop process finished (i.e., SSD ⫹ SSRT). In the 36 cases of the Stop then Discriminate strategy, no-signal RT was 622 ms and SSD ⫹ SSRT was 373 ⫹ 232 ⫽ 605 ms. Thus, this alternative predicts that ignore RT must be at least 622 ⫹ 605/2 ⫽ 925 ms. Observed ignore RTs were 729 ms, so we can reject this alternative as well. Third, go activation may decay during discrimination but not completely, so the go process does not have to start from the beginning. This would predict that ignore RT should equal nosignal RT plus half of discrimination time plus the time to accumulate the go activation lost to decay. This alternative fits the data better than the other two. Some of the 107 ms difference between ignore RT and no-signal RT would be due to discrimination and some would be due to accumulating the go activation lost to decay. More detailed modeling would be required to separate the contribution of these two components.
Implications for Motor Selective Stopping
Figure 5. Three possible go evidence accumulation patterns across time for subjects who Stop then Discriminate. SSD ⫽ stop-signal delay; SSRT ⫽ stop-signal response time.
ignore trials when subjects Stop then Discriminate. We considered three alternatives, expressed in a simple accumulator model in which activation of the go response accumulates until threshold is reached, whereupon a response occurs (e.g., Boucher et al., 2007). We assume the go process completes before the stop process on half the trials. The go process stops and restarts on the other half of the trials. We assume that go activation stops before reaching threshold when the stop process completes. We consider three ways in which go continues to threshold after the go process restarts (see Figure 5). First, go activation may remain at the same level while the person discriminates the tone (Figure 5a). When the go process restarts, it continues from this level until it reaches threshold. Thus,
In the introduction we described three variants of selective stopping: stimulus selective stopping, conditional motor selective stopping, and unconditional motor selective stopping. We have focused on stimulus selective stopping, revealing that most subjects use the Dependent Discriminate then Stop strategy, some use the Stop then Discriminate strategy, and few use the Independent Discriminate then Stop strategy. Here, we consider how this strategic framework may apply to the two variants of motor selective stopping. In conditional motor selective stopping, there is only one signal, so discriminating signals is not required. Instead subjects need to stop selectively if they make one response (critical response) to the go task and not if they make the other (noncritical response). Subjects may do this by stopping nonselectively whenever a stop signal occurs, and then restarting if the go task requires the noncritical response. This is similar to the Stop then Discriminate strategy. Alternatively, subjects may select the go response first, and initiate the stop process if the selected go response is the critical one. Stopping the critical response may impair going, like the Dependent Discriminate then Stop strategy, or it may not impair going, like the Independent Discriminate then Stop strategy. We should be able to determine which strategy subjects adopt by testing whether no-signal RT for the critical response is slower than signalrespond RT for the critical response and testing whether RT for
This document is copyrighted by the American Psychological Association or one of its allied publishers. This article is intended solely for the personal use of the individual user and is not to be disseminated broadly.
SELECTIVE STOPPING? MAYBE NOT
the noncritical response is slower when a signal occurs than when there is no signal. We know of two conditional motor selective stopping studies that present the RT data required for these comparisons (Aron et al., 2007; De Jong et al., 1995). In both cases, no-signal RT for the critical response was slower than signal-respond RT for the critical response and signal-present RT for the noncritical response was slower than no-signal RT for the noncritical response. This suggests that subjects may have used the Stop then Discriminate strategy. De Jong et al. (1995) noted that signal-respond RT for the critical response was slower than predicted from the race model, suggesting that some subjects may have used the Dependent Discriminate then Stop strategy. In unconditional motor selective stopping, subjects usually make bimanual responses, with a stop signal indicating which response needs to be stopped. Stop signals usually occur in different locations corresponding to different responses, so discrimination of signals is involved. This similarity with stimulus selective stopping may result in similar strategy choices. Subjects could be categorized on the basis of signal-respond, nosignal, and unstopped hand RTs (i.e., RT when the other hand is stopped). Existing work suggests that stopping one hand slows the RT for the unstopped hand (Aron & Verbruggen, 2008; Cai et al., 2011; Majid et al., 2012), providing evidence against the Independent Discriminate then Stop strategy. To our knowledge, no published study has presented signal-respond RT, but personal communication with Adam Aron (January 17, 2013) verified that at the group level, signal-respond RT are faster than no-signal RT in Aron and Verbruggen (2008); Cai et al. (2011) and Majid et al. (2012). This suggests that the Stop then Discriminate strategy is most often used in unconditional motor selective stopping. To test this, future work will need to examine individual subject strategies. Our suggestion that unconditional motor selective stopping involves the Stop then Discriminate strategy seems to conflict with neuroscience work showing that simple stopping exerts a more global inhibitory signal across the skeletal motor system than does unconditional motor selective stopping (Cai et al., 2011; Claffey et al., 2010; Majid et al., 2012). One possible resolution may be in the individual subject approach that we propose here: Analyses of group data may suggest just one strategy, but individual subject analyses may show strategic diversity, like we observed. Some subjects may stop nonselectively (with a Stop then Discriminate strategy) and others may stop selectively (with a Discriminate then Stop strategy). Subjects who stop nonselectively may show neural evidence of global inhibition in selective and simple stopping, and subjects who stop selectively may show neural evidence of global inhibition only in simple stopping. In both variants of motor selective stopping, slower RT for the noncritical (or unstopped) response on signal trials compared to no-signal trials is evidence against the Independent Discriminate then Stop strategy, suggesting the Stop then Discriminate strategy or the Dependent Discriminate then Stop strategy may be adopted more frequently. The framework we propose here may be applied to motor selective stopping tasks to resolve ambiguities. Future work will need to test whether the distribution of strategies we see in stimulus selective stopping is also found in motor selective stopping.
467
Implications for Lifespan Development, Clinical Science, and Neuroscience The stop-signal paradigm has been a useful tool in several fields, including lifespan development, clinical science, and neuroscience. The promise of selective stopping providing similar insights can only be realized if the underlying processes are understood and specified. We believe that strategy categorization is an important step in this direction. In lifespan development of selective stopping, the focus has been on the changes in selective SSRT across age. For example, van de Laar et al. (2011) showed that selective SSRT did not slow more than simple SSRT from young adulthood to old age (21 ms vs. 25 ms, respectively). One possibility is that the signal discrimination required for selective stopping is not impaired in older adulthood. An alternative possibility is that strategies change with age, with older adults more frequently choosing a Stop then Discriminate strategy, speeding up their SSRT by using the faster nonselective stopping mechanism. This explanation is supported by the very slow ignore RT in the older adults (Ignore RT 120 ms slower than no-signal RT in older adults, ⬃75 ms slower in the other groups), possibly because of the time-consuming restart time on ignore trials. This later explanation suggests a strategic change that may mask selective SSRT impairment in older adults. This emphasizes the importance of categorizing strategies in developmental studies of selective stopping. Selective stopping work with clinical populations is rare. Bedard et al. (2003) found that children with ADHD had slower selective SSRT than age-matched control children (difference ⫽ 121 ms). This suggests a deficit in selective stopping or a difference in the prevalence of adopting different strategies. For example, children with ADHD may use a strategy that delays stopping more often than controls. Without assessing strategy adoption rates across groups, these alternatives are difficult to distinguish. We recommend that future clinical selective stopping studies should categorize the strategy used by each subject in each group. Neuroscientific studies have used stimulus selective stopping tasks to isolate stopping-specific activation, comparing activation on ignore trials with activation on stop trials either in ERP (e.g., Dimoska et al., 2006) or fMRI (e.g., Sharp et al., 2010). These comparisons are based on the assumption that ignore trials do not involve a stop process, as if all subjects use a Discriminate then Stop strategy. Here, we show that many subjects use the Stop then Discriminate strategy, initiating a stop process on both stop and ignore trials, so the difference between them does not isolate the stop process. This calls into question existing neuroscientific studies implementing this comparison. We recommend that future neuroscientific studies categorize the strategy used by each subject before comparing their brain activation.
Conclusions Selective stopping paradigms aim to capture the complex control processes involved in stopping to some signals and not others. Our results suggest a strategic heterogeneity in selective stopping that has not previous been reported. Some subjects use a Stop then Discriminate strategy, stopping nonselectively whenever a signal occurs, which delays discrimination of the signal and delays ignore RT. These subjects’ performance can
BISSETT AND LOGAN
This document is copyrighted by the American Psychological Association or one of its allied publishers. This article is intended solely for the personal use of the individual user and is not to be disseminated broadly.
468
be explained with the independent race model (Logan & Cowan, 1984), but their SSRTs reflect the speed of nonselective inhibition, not the intended selective inhibition. Other subjects use a Dependent Discriminate then Stop strategy, discriminating the stop and ignore signals before stopping, but this discrimination appears to interfere with go processing, violating the context independence assumption of the independent race model and questioning the validity of SSRTs computed for these subjects. It may be possible to use the distribution of ignore RTs to estimate the underlying go process, but this requires very strong assumptions that have not yet been validated. Very few subjects use the Independent Discriminate then Stop strategy assumed in the literature, which would allow valid calculation of selective SSRT. Overall, our results suggest that strategy adoption in selective stopping determines the order of stop and discrimination processes, independence between going and stopping, and validity of SSRT computation.
References Aron, A. R. (2011). From reactive to proactive and selective control: Developing a richer model for stopping inappropriate response. Biological Psychiatry, 69, e55– e68. doi:10.1016/j.biopsych.2010.07.024 Aron, A. R., Behrens, T. E., Smith, S., Frank, M. J., & Poldrack, R. A. (2007). Triangulating a cognitive control network using diffusionweighted magnetic resonance imaging (MRI) and functional MRI. The Journal of Neuroscience, 27, 3743–3752. doi:10.1523/JNEUROSCI .0519-07.2007 Aron, A. R., & Poldrack, R. A. (2006). Cortical and subcortical contributions to stop signal response inhibition: Role of subthalamic nucleus. The Journal of Neuroscience, 26, 2424 –2433. doi:10.1523/JNEUROSCI .4682-05.2006 Aron, A. R., & Verbruggen, F. (2008). Dissociating a selective from a global mechanism for stopping. Psychological Science, 19, 1146 –1153. doi:10.1111/j.1467-9280.2008.02216.x Band, G. P. H., van der Molen, M. W., & Logan, G. D. (2003). Horse-race model simulations studies of the stop signal procedure. Acta Psychologica, 112, 105–142. doi:10.1016/S0001-6918(02)00079-3 Bedard, A.-C., Ickowicz, A., Logan, G. D., Hogg-Johnson, S., Schachar, R., & Tannock, R. (2003). Selective inhibition in children with attentiondeficit hyperactivity disorder off and on stimulant medication. Journal of Abnormal Child Psychology, 31, 315–327. doi:10.1023/A: 1023285614844 Bedard, A.-C., Nichols, S., Barbosa, J. A., Schachar, R., Logan, G. D., & Tannock, R. (2002). The development of selective inhibitory control across the life span. Developmental Neuropsychology, 21, 93–111. doi: 10.1207/S15326942DN2101_5 Bissett, P. G., & Logan, G. D. (2011). Balancing cognitive demands: Control adjustments in the stop-signal paradigm. Journal of Experimental Psychology: Learning, Memory, and Cognition, 37, 392– 404. doi: 10.1037/a0021800 Bissett, P. G., & Logan, G. D. (2012). Post-stop-signal adjustments: Inhibition improves subsequent inhibition. Journal of Experimental Psychology: Learning, Memory, and Cognition, 38, 955–966. doi:10.1037/ a0026778 Boucher, L., Palmeri, T. J., Logan, G. D., & Schall, J. D. (2007). Inhibitory control in mind and brain: An interactive race model of countermanding saccades. Psychological Review, 114, 376 –397. doi:10.1037/0033-295X .114.2.376 Broadbent, D. E. (1957). A mechanical model for human attention and immediate memory. Psychological Review, 64, 205–215. doi:10.1037/ h0047313
Cai, W., George, J. S., Verbruggen, F., Chambers, C. D., & Aron, A. R. (2012). The role of the right presupplementary motor area in stopping action: Two studies with event-related transcranial magnetic stimulation. Journal of Neurophysiology, 108, 380 –389. doi:10.1152/jn.00132.2012 Cai, W., Oldenkamp, C. L., & Aron, A. R. (2011). A proactive mechanism for selective suppression of response tendencies. The Journal of Neuroscience, 31, 5965–5969. doi:10.1523/JNEUROSCI.6292-10.2011 Chartrand, T. L., & Bargh, J. A. (1999). Automatic activation of impression formation and memorization goals: Nonconscious goal priming reproduces effects of explicit task instructions. Journal of Personality and Social Psychology, 76, 893–910. doi:10.1037/0022-3514.76.6.893 Chikazoe, J., Jimura, K., Hirose, S., Yamashita, K.-I., Miyashita, Y., & Konishi, S. (2009). Preparation to inhibit a response complements response inhibition during performance of a stop-signal task. The Journal of Neuroscience, 29, 15870 –15877. doi:10.1523/JNEUROSCI.3645-09 .2009 Claffey, M. P., Sheldon, S., Stinear, C. M., Verbruggen, F., & Aron, A. R. (2010). Having a goal to stop action is associated with advance control of specific motor representations. Neuropsychologia, 48, 541–548. doi: 10.1016/j.neuropsychologia.2009.10.015 Colonius, H. (1990). A note on the stop-signal paradigm, or how to observe the unobservable. Psychological Review, 97, 309 –312. doi:10.1037/ 0033-295X.97.2.309 Coxon, J. P., Stinear, S. M., & Byblow, W. D. (2007). Selective inhibition of movement. Journal of Neurophysiology, 97, 2480 –2489. doi: 10.1152/jn.01284.2006 De Jong, R., Coles, M. G. H., & Logan, G. D. (1995). Strategies and mechanisms in nonselective and selective inhibitory motor control. Journal of Experimental Psychology: Human Perception and Performance, 21, 498 –511. doi:10.1037/0096-1523.21.3.498 De Jong, R., Coles, M. G. H., Logan, G. D., & Gratton, G. (1990). Searching for the point of no return: The control of response processes in speeded choice reaction performance. Journal of Experimental Psychology: Human Perception and Performance, 16, 164 –182. doi: 10.1037/0096-1523.16.1.164 Dimoska, A., Johnstone, S. J., & Barry, R. J. (2006). The auditory-evoked N2 and P3 components in the stop-signal task: Indices of inhibition, response-conflict or error-detection. Brain and Cognition, 62, 98 –112. doi:10.1016/j.bandc.2006.03.011 Donders, F. C. (1969). On the speed of mental processes. In W. G. Koster, Attention and performance II (pp. 412– 431). Amsterdam, the Netherlands: North-Holland. (Original work published 1868) Dux, P. E., & Marois, R. (2009). The attentional blink: A review of data and theory. Attention, Perception, & Psychophysics, 71, 1683–1700. doi:10.3758/APP.71.8.1683 Eriksen, B. A., & Eriksen, C. W. (1974). Effects of noise letters upon identification of a target letter in a non-search task. Perception & Psychophysics, 16, 143–149. doi:10.3758/BF03203267 Freeman, G. H., & Halton, J. H. (1951). Note on exact treatment of contingency, goodness of fit and other problems of significance. Biometrika, 38, 141–149. Gauggel, S., Rieger, M., & Feghoff, T.-A. (2004). Inhibition of ongoing responses in patients with Parkinson’s disease. Journal of Neurology, Neurosurgery, & Psychiatry, 75, 539 –544. Greenhouse, I., Oldenkamp, C. L., & Aron, A. R. (2012). Stopping a response has global and non-global effects on the motor system depending on preparation. Journal of Neurophysiology, 107, 384 –392. doi: 10.1152/jn.00704.2011 Hanes, D. P., Patterson, W. F., & Schall, J. D. (1998). Role of frontal eye field in countermanding saccades: Visual, movement and fixation activity. Journal of Neurophysiology, 79, 817– 834. Jahfari, S., Stinear, C. M., Claffey, M., Verbruggen, F., & Aron, A. R. (2010). Responding with restraint: What are the neurocognitive mech-
This document is copyrighted by the American Psychological Association or one of its allied publishers. This article is intended solely for the personal use of the individual user and is not to be disseminated broadly.
SELECTIVE STOPPING? MAYBE NOT anisms? Journal of Cognitive Neuroscience, 22, 1479 –1492. doi: 10.1162/jocn.2009.21307 Levitt, H. (1971). Transformed up– down method in psychoacoustics. Journal of the Acoustical Society of America, 49, 467– 477. doi:10.1121/ 1.1912375 Lipszyc, J., & Schachar, R. (2010). Inhibitory control and psychopathology: A meta-analysis of studies using the stop signal task. Journal of the International Neuropsychological Society, 16, 1064 –1076. doi:10.1017/ S1355617710000895 Logan, G. D. (1981). Attention, automaticity, and the ability to stop a speeded choice response. In J. Long & A. D. Baddeley (Eds.), Attention and performance IX (pp. 205–222). Hillsdale, NJ: Erlbaum. Logan, G. D. (1994). On the ability to inhibit thought and action: A users’ guide to the stop signal paradigm. In D. Dagenbach & T. H. Carr (Eds.), Inhibitory processes in attention, memory, and language (pp. 189 –239). San Diego, CA: Academic Press. Logan, G. D., & Burkell, J. (1986). Dependence and independence in responding to double stimulation: A comparison of stop, change, and dual-task paradigms. Journal of Experimental Psychology: Human Perception and Performance, 12, 549 –563. doi:10.1037/0096-1523.12.4 .549 Logan, G. D., & Cowan, W. B. (1984). On the ability to inhibit thought and action. A theory of an act of control. Psychological Review, 91, 295– 327. doi:10.1037/0033-295X.91.3.295 Logan, G. D., Kantowitz, B. H., & Riegler, G. L. (1986). On the ability to inhibit selectively: Global and local mechanisms of response interdiction. Unpublished manuscript. Majid, D. S. A., Cai, W., George, J. S., Verbruggen, F., & Aron, A. R. (2012). Transcranial magnetic stimulation reveals dissociable mechanisms for global versus selective corticomotor suppression underlying the stopping of action. Cerebral Cortex, 22, 363–371. doi:10.1093/ cercor/bhr112 Navon, D., & Gopher, D. (1979). On the economy of the human processing system. Psychological Review, 86, 214 –255. doi:10.1037/0033-295X.86 .3.214 Pashler, H. (1994). Dual-task interference in simple tasks: Data and theory. Psychological Bulletin, 116, 220 –244. doi:10.1037/0033-2909.116.2 .220 Rieger, M., & Gauggel, S. (1999). Inhibitory after-effects in the stop signal paradigm. British Journal of Psychology, 90, 509 –518. doi:10.1348/ 000712699161585 Rouder, J. N., Speckman, P. L., Sun, D., Morey, R. D., & Iverson, G. (2009). Bayesian t-tests for accepting or rejecting the null hypothesis. Psychonomic Bulletin & Review, 16, 225–237. doi:10.3758/PBR.16.2 .225 Schachar, R. J., & Logan, G. D. (1990). Impulsivity and inhibitory control in normal development and childhood psychopathology. Developmental Psychology, 26, 710 –720. doi:10.1037/0012-1649.26.5.710 Sharp, D. J., Bonnelle, V., De Boissezon, X., Beckmann, C. F., James, S. G., Patel, M. C., & Mehta, M. A. (2010). Distinct frontal systems for response inhibition, attentional capture, and error processing. PNAS Proceedings of the National Academy of Sciences of the United States of America, 107, 6106 – 6111. doi:10.1073/pnas.1000175107 Swann, N., Tandon, N., Canolty, R., Ellmore, T. M., McEvoy, L. K., Dreyer, S., . . . Aron, A. R. (2009). Intracranial EEG reveals a time- and frequency-specific role for the right inferior frontal gyrus and primary motor cortex in stopping initiated responses. The Journal of Neuroscience, 29, 12675–12685. doi:10.1523/JNEUROSCI.3359-09.2009 Thakkar, K. N., Schall, J. D., Boucher, L., Logan, G. D., & Park, S. (2011). Response inhibition and response monitoring in a saccadic countermanding task in schizophrenia. Biological Psychiatry, 69, 55– 62. doi: 10.1016/j.biopsych.2010.08.016
469
Treisman, A., & Davies, A. (1973). Dividing attention to ear and eye. In S. Kornblum (Ed.), Attention and performance IV (pp. 101–117). New York, NY: Academic Press. van de Laar, M. C., van den Wildenberg, W. P. M., van Boxtel, G. J. M., & van der Molen, M. W. (2010). Processing of global and selective stop signals: Application of Donders’ subtraction method to stop-signal task performance. Experimental Psychology, 57, 149 –159. doi:10.1027/ 1618-3169/a000019 van de Laar, M. C., van den Wildenberg, W. P. M., van Boxtel, G. J. M., & van der Molen, M. W. (2011). Lifespan changes in global and selective stopping and performance adjustments. Frontiers in Psychology, 2, 357. van den Wildenberg, W. P. M., & van der Molen, M. W. (2004). Developmental trends in simple and selective inhibition of compatible and incompatible responses. Journal of Experimental Child Psychology, 87, 201–220. doi:10.1016/j.jecp.2003.11.003 van Gaal, S., Lamme, V. A. F., Fahrenfort, J. J., & Ridderinkhof, K. R. (2011). Dissociable brain mechanisms underlying the conscious and unconscious control of behavior. Journal of Cognitive Neuroscience, 23, 91–105. doi:10.1162/jocn.2010.21431 Verbruggen, F., Chambers, C. D., & Logan, G. D. (in press). Fictitious inhibitory differences: How skewness and slowing distort the estimation of stopping latencies. Psychological Science. Verbruggen, F., Liefooghe, B., & Vandierendonck, A. (2005). On the difference between response inhibition and negative priming: Evidence from simple and selective stopping. Psychological Research, 69, 262– 271. doi:10.1007/s00426-004-0177-6 Verbruggen, F., Liefooghe, B., & Vandierendonck, A. (2006). Selective stopping in task switching: The role of response selection and response execution. Experimental Psychology, 53, 48 –57. doi:10.1027/16183169.53.1.48 Verbruggen, F., & Logan, G. D. (2008a). Automatic and controlled response inhibition: Associative learning in the go/no-go and stop-signal paradigms. Journal of Experimental Psychology: General, 137, 649 – 672. doi:10.1037/a0013170 Verbruggen, F., & Logan, G. D. (2008b). Long-term aftereffects of response inhibition: Memory retrieval, task goals, and cognitive control. Journal of Experimental Psychology: Human Perception and Performance, 34, 1229 –1235. doi:10.1037/0096-1523.34.5.1229 Verbruggen, F., & Logan, G. D. (2008c). Response inhibition in the stop-signal paradigm. Trends in Cognitive Sciences, 12, 418 – 424. doi: 10.1016/j.tics.2008.07.005 Verbruggen, F., & Logan, G. D. (2009a). Automaticity of cognitive control: Goal priming in response-inhibition paradigms. Journal of Experimental Psychology: Learning, Memory, and Cognition, 35, 1381–1388. doi:10.1037/a0016645 Verbruggen, F., & Logan, G. D. (2009b). Models of response inhibition in the stop-signal and stop-change paradigms. Neuroscience and Biobehavioral Reviews, 33, 647– 661. doi:10.1016/j.neubiorev.2008.08.014 Verbruggen, F., & Logan, G. D. (2009c). Proactive adjustments of response strategies in the stop-signal paradigm. Journal of Experimental Psychology: Human Perception and Performance, 35, 835– 854. doi: 10.1037/a0012726 Verbruggen, F., Logan, G. D., Liefooghe, B., & Vandierendonck, A. (2008). Short-term aftereffects of response inhibition: Repetition priming or between-trial control adjustment? Journal of Experimental Psychology: Human Perception and Performance, 34, 413– 426. doi: 10.1037/0096-1523.34.2.413 Vince, M. A. (1948). The intermittency of control movements and the psychological refractory period. British Journal of Psychology, 38, 149 – 157. Welford, A. T. (1952). The psychological refractory period and timing of high-speed performance: A review and a theory. British Journal of Psychology, 43, 2–19.
BISSETT AND LOGAN
470
Williams, B. R., Ponesse, J. S., Schachar, R. J., Logan, G. D., & Tannock, R. (1999). Development of inhibitory control across the life span. Developmental Psychology, 35, 205–213. doi:10.1037/0012-1649.35.1 .205
Yamaguchi, M., Logan, G. D., & Bissett, P. G. (2012). Stopping while going! Response inhibition does not suffer dual-task interference. Journal of Experimental Psychology: Human Perception and Performance, 38, 123–134. doi:10.1037/a0023918
This document is copyrighted by the American Psychological Association or one of its allied publishers. This article is intended solely for the personal use of the individual user and is not to be disseminated broadly.
Appendix
Table A1 Performance Measures Necessary to Calculate Bayes Factor and Assign Strategy: Individual Subject RT, Standard Deviation, Number of Trials per Condition, Calculated t Value, Calculated Bayes Factor, and Assigned Strategy Category RT (SD)
N
t
Bayes factor
Experiment
SR
NS
Ig
SR
NS
Ig
SR vs. NS
NS vs. Ig
NS vs. SR
NS vs. Ig
E1 E1 E1 E1 E1 E1 E1 E1 E1 E1 E1 E1 E1 E1 E1 E1 E1 E1 E1 E1 E1 E1 E1 E1 E2 Freq Ig E2 Freq Ig E2 Freq Ig E2 Freq Ig E2 Freq Ig E2 Freq Ig E2 Freq Ig E2 Freq Ig E2 Freq Ig E2 Freq Ig E2 Freq Ig E2 Freq Ig E2 Freq Ig E2 Freq Ig E2 Freq Ig E2 Freq Ig E2 Freq Ig E2 Freq Ig
560 (97) 529 (113) 604 (171) 457 (69) 599 (135) 476 (93) 577 (144) 550 (145) 525 (123) 473 (82) 543 (127) 473 (106) 457 (85) 518 (132) 443 (119) 729 (126) 501 (142) 566 (154) 486 (118) 546 (141) 589 (167) 698 (172) 560 (149) 570 (159) 563 (100) 487 (86) 426 (86) 500 (84) 512 (86) 627 (89) 464 (89) 515 (110) 495 (125) 479 (95) 545 (112) 507 (79) 440 (89) 520 (109) 525 (102) 519 (133) 529 (99) 479 (125)
593 (94) 486 (94) 569 (174) 484 (89) 660 (134) 499 (113) 583 (124) 588 (168) 520 (119) 433 (80) 543 (94) 430 (76) 503 (100) 421 (75) 446 (98) 755 (101) 480 (102) 612 (133) 488 (100) 605 (150) 607 (143) 729 (175) 566 (120) 565 (126) 571 (112) 478 (86) 409 (98) 497 (72) 576 (145) 668 (111) 494 (99) 509 (124) 493 (123) 478 (107) 505 (130) 506 (86) 450 (81) 531 (119) 529 (103) 569 (151) 543 (105) 515 (113)
634 (130) 593 (161) 770 (282) 581 (168) 742 (217) 582 (171) 703 (204) 706 (230) 617 (155) 516 (127) 612 (138) 522 (116) 578 (124) 570 (144) 540 (170) 870 (176) 610 (172) 720 (201) 590 (155) 741 (271) 696 (214) 815 (222) 703 (213) 689 (194) 650 (144) 528 (104) 409 (106) 540 (94) 628 (183) 700 (141) 561 (135) 563 (151) 510 (129) 524 (136) 571 (174) 549 (119) 483 (98) 555 (142) 598 (141) 604 (191) 573 (125) 551 (130)
120 122 129 120 118 119 120 122 120 121 119 123 120 123 122 118 121 120 120 117 122 120 120 120 47 49 50 49 46 47 47 49 50 50 53 53 49 51 48 50 49 49
720 720 719 719 720 719 717 719 717 719 717 720 718 720 718 715 715 719 718 718 713 713 720 718 718 720 715 720 718 720 718 719 706 717 720 719 720 718 720 718 720 720
238 234 238 240 238 237 237 239 238 238 232 240 240 237 237 238 236 239 239 235 222 239 239 237 383 384 384 384 384 384 382 384 382 383 384 383 384 384 384 384 383 382
3.57 ⫺4.54 ⫺2.10 3.14 4.56 2.16 0.58 2.33 ⫺0.37 ⫺4.97 0.00 ⫺5.31 4.73 ⫺11.45 0.32 2.68 ⫺1.93 3.41 0.14 3.98 1.25 1.75 0.50 ⫺0.37 0.49 ⫺0.75 ⫺1.18 ⫺0.27 2.95 2.45 2.02 ⫺0.32 ⫺0.09 ⫺0.10 ⫺2.19 ⫺0.09 0.85 0.66 0.25 2.26 0.87 2.13
⫺5.27 ⫺12.45 ⫺13.02 ⫺11.41 ⫺6.93 ⫺8.47 ⫺10.82 ⫺8.53 ⫺10.01 ⫺11.73 ⫺8.58 ⫺13.85 ⫺9.42 ⫺20.47 ⫺10.47 ⫺12.24 ⫺13.95 ⫺9.47 ⫺11.75 ⫺9.64 ⫺7.11 ⫺6.15 ⫺12.34 ⫺11.29 ⫺10.02 ⫺8.61 0.03 ⫺8.38 ⫺5.22 ⫺4.13 ⫺9.39 ⫺6.39 ⫺2.04 ⫺6.14 ⫺7.17 ⫺6.85 ⫺5.83 ⫺2.98 ⫺9.18 ⫺3.31 ⫺4.30 ⫺4.77
1:38 ⬍1:100 1.5:1 1:10 ⬍1:100 1.3:1 11:1 1:1.1 12:1 ⬍1:100 13:1 ⬍1:100 ⬍1:100 ⬍1:100 12:1 1:3 2:1 1:22 13:1 ⬍1:100 6:1 3:1 11:1 12:1 8:1 7:1 4:1 8:1 1:8 1:2 1.2:1 8:1 9:1 9:1 1:1.1 9:1 6:1 7:1 8:1 1:1.3 6:1 1:1.01
⬍1:100 ⬍1:100 ⬍1:100 ⬍1:100 ⬍1:100 ⬍1:100 ⬍1:100 ⬍1:100 ⬍1:100 ⬍1:100 ⬍1:100 ⬍1:100 ⬍1:100 ⬍1:100 ⬍1:100 ⬍1:100 ⬍1:100 ⬍1:100 ⬍1:100 ⬍1:100 ⬍1:100 ⬍1:100 ⬍1:100 ⬍1:100 ⬍1:100 ⬍1:100 20:1 ⬍1:100 ⬍1:100 ⬍1:100 ⬍1:100 ⬍1:100 2:1 ⬍1:100 ⬍1:100 ⬍1:100 ⬍1:100 1:4 ⬍1:100 1:11 ⬍1:100 ⬍1:100
(Appendix continues)
Strategy S⬎D DD⬎ DD⬎ S⬎D S⬎D DD⬎ DD⬎ S⬎D DD⬎ DD⬎ DD⬎ DD⬎ S⬎D DD⬎ DD⬎ S⬎D DD⬎ S⬎D DD⬎ S⬎D DD⬎ DD⬎ DD⬎ DD⬎ DD⬎ DD⬎ ????? DD⬎ S⬎D S⬎D DD⬎ DD⬎ ????? DD⬎ DD⬎ DD⬎ DD⬎ DD⬎ DD⬎ S⬎D DD⬎ S⬎D
S S S S S S S S S S S S S S S S S S S S S S S S S S S S
SELECTIVE STOPPING? MAYBE NOT
471
Appendix (continued)
This document is copyrighted by the American Psychological Association or one of its allied publishers. This article is intended solely for the personal use of the individual user and is not to be disseminated broadly.
RT (SD) Experiment
SR
E2 Freq St E2 Freq St E2 Freq St E2 Freq St E2 Freq St E2 Freq St E2 Freq St E2 Freq St E2 Freq St E2 Freq St E2 Freq St E2 Freq St E2 Freq St E2 Freq St E2 Freq St E2 Freq St E2 Freq St E2 Freq St E3 Freq Ig E3 Freq Ig E3 Freq Ig E3 Freq Ig E3 Freq Ig E3 Freq Ig E3 Freq Ig E3 Freq Ig E3 Freq Ig E3 Freq Ig E3 Freq Ig E3 Freq Ig E3 Freq Ig E3 Freq Ig E3 Freq Ig E3 Freq Ig E3 Freq Ig E3 Freq Ig E3 Freq Ig E3 Freq Ig E3 Freq Ig E3 Freq Ig E3 Freq Ig E3 Freq Ig E3 Freq St E3 Freq St E3 Freq St E3 Freq St E3 Freq St E3 Freq St E3 Freq St E3 Freq St E3 Freq St E3 Freq St E3 Freq St E3 Freq St
461 (118) 633 (157) 648 (218) 504 (120) 724 (227) 493 (105) 555 (109) 607 (186) 477 (127) 596 (171) 483 (104) 437 (83) 472 (131) 839 (318) 395 (109) 649 (99) 855 (274) 503 (159) 511 (97) 602 (130) 607 (107) 592 (130) 653 (221) 458 (98) 445 (109) 577 (141) 534 (111) 519 (102) 522 (99) 566 (203) 577 (124) 590 (149) 467 (88) 521 (151) 511 (124) 520 (143) 459 (112) 512 (144) 516 (166) 469 (69) 481 (120) 526 (82) 506 (105) 666 (193) 675 (107) 944 (254) 655 (265) 474 (94) 411 (96) 674 (149) 615 (128) 495 (107) 537 (107) 743 (261)
NS 483 (104) 688 (175) 790 (281) 556 (129) 791 (213) 542 (120) 617 (167) 680 (212) 457 (103) 643 (164) 506 (113) 496 (130) 488 (116) 975 (325) 382 (83) 675 (101) 986 (290) 490 (114) 544 (107) 689 (150) 647 (112) 613 (184) 597 (173) 455 (102) 425 (75) 638 (148) 548 (84) 499 (117) 508 (93) 679 (187) 558 (106) 593 (129) 420 (89) 499 (115) 535 (90) 495 (102) 394 (62) 494 (98) 446 (86) 445 (86) 487 (106) 494 (109) 545 (104) 723 (164) 696 (121) 1,019 (271) 619 (198) 496 (113) 436 (82) 809 (172) 632 (93) 543 (123) 552 (105) 866 (274)
N Ig 669 (259) 847 (297) 936 (364) 608 (203) 916 (327) 678 (201) 799 (280) 909 (326) 525 (164) 788 (288) 629 (195) 525 (221) 647 (230) 1,009 (327) 524 (216) 680 (145) 109 (349) 739 (367) 601 (153) 806 (263) 711 (109) 674 (184) 643 (200) 544 (169) 482 (119) 682 (178) 652 (148) 563 (162) 576 (149) 758 (208) 550 (116) 632 (161) 516 (157) 545 (148) 617 (138) 549 (147) 458 (99) 522 (121) 506 (121) 493 (104) 573 (169) 659 (185) 628 (178) 831 (316) 780 (170) 1,112 (307) 714 (238) 606 (194) 574 (185) 857 (255) 855 (247) 718 (204) 718 (247) 926 (361)
t
Bayes factor
SR
NS
Ig
SR vs. NS
NS vs. Ig
NS vs. SR
NS vs. Ig
Strategy
192 188 188 190 189 192 190 190 196 189 194 192 192 177 193 190 182 192 23 19 22 22 26 24 23 22 23 23 27 18 23 26 25 25 22 25 24 24 25 26 23 23 89 84 86 80 90 89 88 85 87 88 90 82
720 711 696 664 715 712 697 715 718 719 718 714 719 696 716 697 702 720 327 329 329 330 329 330 330 330 330 328 329 330 329 330 328 330 330 330 330 330 330 330 330 327 330 328 327 330 329 330 329 330 330 329 328 330
89 94 79 78 93 91 91 89 76 95 93 68 96 89 94 70 87 78 173 171 176 173 173 176 169 176 176 175 174 175 176 176 175 176 174 174 176 176 176 175 176 176 44 43 44 43 43 42 40 44 43 43 42 44
2.56 3.84 6.41 4.92 3.76 5.09 4.88 4.29 ⫺2.31 3.47 2.52 5.87 1.63 4.97 ⫺1.85 3.06 5.48 ⫺1.25 1.42 2.46 1.62 0.53 ⫺1.55 ⫺0.15 ⫺1.21 1.87 0.74 ⫺0.78 ⫺0.78 2.48 ⫺0.82 0.13 ⫺2.54 ⫺0.89 1.19 ⫺1.14 ⫺4.63 ⫺0.84 ⫺3.55 ⫺1.41 0.27 ⫺1.34 3.07 2.69 1.45 2.22 ⫺1.41 1.65 2.41 6.62 1.42 3.32 1.15 3.66
⫺12.65 ⫺7.48 ⫺4.24 ⫺3.15 ⫺4.94 ⫺9.21 ⫺8.84 ⫺8.93 ⫺5.11 ⫺7.24 ⫺8.91 ⫺1.63 ⫺10.88 ⫺0.92 ⫺12.04 ⫺0.36 ⫺3.14 ⫺13.27 ⫺4.83 ⫺6.28 ⫺6.22 ⫺3.52 ⫺2.70 ⫺7.32 ⫺6.49 ⫺2.96 ⫺10.04 ⫺5.02 ⫺6.23 ⫺4.31 0.81 ⫺2.93 ⫺8.79 ⫺3.89 ⫺8.06 ⫺4.81 ⫺9.01 ⫺2.79 ⫺6.35 ⫺5.56 ⫺7.03 ⫺12.47 ⫺4.48 ⫺3.56 ⫺4.07 ⫺2.07 ⫺2.87 ⫺5.39 ⫺8.37 ⫺1.64 ⫺11.33 ⫺7.96 ⫺7.82 ⫺1.32
1:1.6 1:90 ⬍1:100 ⬍1:100 1:66 ⬍1:100 ⬍1:100 ⬍1:100 1.1:1 1:24 1:1.5 ⬍1:100 4:1 ⬍1:100 3:1 1:7 ⬍1:100 7:1 2:1 1:3 1.8:1 5:1 2:1 6:1 3:1 1.2:1 5:1 5:1 5:1 1:3 4:1 6:1 1:3 4:1 3:1 3:1 ⬍1:100 4:1 1:53 3:1 6:1 3:1 1:9 1:3 4:1 1:1.1 4:1 3:1 1:1.6 ⬍1:100 4:1 1:20 6:1 1:59
⬍1:100 ⬍1:100 ⬍1:100 1:12 ⬍1:100 ⬍1:100 ⬍1:100 ⬍1:100 ⬍1:100 ⬍1:100 ⬍1:100 3:1 ⬍1:100 7:1 ⬍1:100 10:1 1:11 ⬍1:100 ⬍1:100 ⬍1:100 ⬍1:100 ⬍1:100 ⬍1:100 ⬍1:100 ⬍1:100 ⬍1:100 ⬍1:100 ⬍1:100 ⬍1:100 ⬍1:100 10:1 ⬍1:100 ⬍1:100 ⬍1:100 ⬍1:100 ⬍1:100 ⬍1:100 ⬍1:100 ⬍1:100 ⬍1:100 ⬍1:100 ⬍1:100 ⬍1:100 1:51 ⬍1:100 1.04:1 1:6 ⬍1:100 ⬍1:100 2:1 ⬍1:100 ⬍1:100 ⬍1:100 3:1
S⬎D S⬎D S⬎D S⬎D S⬎D S⬎D S⬎D S⬎D DD⬎S S⬎D S⬎D ID⬎S DD⬎S ID⬎S DD⬎S ID⬎S S⬎D DD⬎S DD⬎S S⬎D DD⬎S DD⬎S DD⬎S DD⬎S DD⬎S DD⬎S DD⬎S DD⬎S DD⬎S S⬎D ???? DD⬎S DD⬎S DD⬎S DD⬎S DD⬎S DD⬎S DD⬎S DD⬎S DD⬎S DD⬎S DD⬎S S⬎D S⬎D DD⬎S ID⬎S DD⬎S DD⬎S S⬎D ID⬎S DD⬎S S⬎D DD⬎S ID⬎S
(Appendix continues)
BISSETT AND LOGAN
472 Appendix (continued)
This document is copyrighted by the American Psychological Association or one of its allied publishers. This article is intended solely for the personal use of the individual user and is not to be disseminated broadly.
RT (SD)
N
t
Bayes factor
Experiment
SR
NS
Ig
SR
NS
Ig
SR vs. NS
NS vs. Ig
NS vs. SR
NS vs. Ig
E3 Freq St E3 Freq St E3 Freq St E3 Freq St E3 Freq St E3 Freq St E3 Freq St E3 Freq St E3 Freq St E3 Freq St E3 Freq St E3 Freq St
582 (105) 628 (118) 442 (128) 639 (181) 591 (85) 533 (129) 418 (83) 579 (111) 481 (87) 447 (84) 485 (106) 476 (114)
611 (119) 684 (158) 464 (115) 750 (196) 653 (104) 525 (108) 403 (60) 658 (128) 543 (105) 465 (96) 538 (133) 528 (132)
693 (200) 784 (192) 636 (233) 829 (279) 735 (188) 639 (210) 512 (155) 736 (190) 667 (185) 536 (149) 633 (214) 639 (239)
90 86 87 83 85 88 90 87 87 89 88 87
328 328 330 326 329 330 330 329 329 330 330 328
44 44 41 43 41 43 43 41 42 44 44 43
2.05 3.05 1.55 4.65 5.11 ⫺0.57 ⫺1.87 5.23 5.05 1.57 3.46 3.35
⫺3.90 ⫺3.82 ⫺7.78 ⫺2.36 ⫺4.24 ⫺5.66 ⫺8.61 ⫺3.45 ⫺6.50 ⫺4.28 ⫺4.07 ⫺4.59
1.4:1 1:8 3:1 ⬍1:100 ⬍1:100 9:1 1.9:1 ⬍1:100 ⬍1:100 3:1 1:30 1:22
⬍1:100 ⬍1:100 ⬍1:100 1:1.8 ⬍1:100 ⬍1:100 ⬍1:100 1:35 ⬍1:100 ⬍1:100 ⬍1:100 ⬍1:100
Strategy DD⬎ S⬎D DD⬎ S⬎D S⬎D DD⬎ DD⬎ S⬎D S⬎D DD⬎ S⬎D S⬎D
S S S S S
Note RT ⫽ reaction time rounded down to the nearest whole number; SD ⫽ within-subject standard deviation; N ⫽ number of nonomission trials in the condition; t ⫽ within-subject two independent-sample t value; Bayes factor ⫽ computed Bayes factor; Strategy ⫽ assigned strategy based upon Bayes factor for the subject; SR ⫽ signal-respond trials; NS ⫽ no-signal trials; Ig ⫽ ignore trials; Freq Ig ⫽ condition with 32% ignore signals and 8% stop signals; Freq St ⫽ condition with 32% stop signals and 8% ignore signals. Each row is a subject or, in the case of Experiment 3, a condition.
Received November 4, 2012 Revision received January 29, 2013 Accepted January 30, 2013 䡲