sensors Communication
Selectivity Enhancement by Using Double-Layer MOX-Based Gas Sensors Prepared by Flame Spray Pyrolysis (FSP) Julia Rebholz 1 , Katharina Grossmann 1 , David Pham 2 , Suman Pokhrel 2 , Lutz Mädler 2 , Udo Weimar 1 and Nicolae Barsan 1, * 1
2
*
Institute of Physical Chemistry, University of Tübingen, Auf der Morgenstelle 15, Tübingen 72076, Germany;
[email protected] (J.R.);
[email protected] (K.G.);
[email protected] (U.W.) IWT Foundation Institute of Materials Science, University of Bremen, Badgasteiner Str. 3, Bremen 28359, Germany;
[email protected] (D.P.);
[email protected] (S.P.);
[email protected] (L.M.) Correspondence:
[email protected]; Tel.: +49-7071-297-8761
Academic Editors: Eduard Llobet and Stella Vallejos Received: 20 July 2016; Accepted: 2 September 2016; Published: 6 September 2016
Abstract: Here we present a novel concept for the selective recognition of different target gases with a multilayer semiconducting metal oxide (SMOX)-based sensor device. Direct current (DC) electrical resistance measurements were performed during exposure to CO and ethanol as single gases and mixtures of highly porous metal oxide double- and single-layer sensors obtained by flame spray pyrolysis. The results show that the calculated resistance ratios of the single- and double-layer sensors are a good indicator for the presence of specific gases in the atmosphere, and can constitute some building blocks for the development of chemical logic devices. Due to the inherent lack of selectivity of SMOX-based gas sensors, such devices could be especially relevant for domestic applications. Keywords: logic device; selectivity; flame spray pyrolysis; gas sensor; double-layer sensor
1. Introduction Recent years witnessed an explosion of the consumer microelectromechanical systems (MEMS) sensor market as the cell phone evolved into a powerful computer and the development of smart devices started. Consequently, for gas sensors based on Semiconducting Metal Oxides (SMOX), these developments open up new application fields such as indoor air quality monitoring in smart buildings or car ventilation, etc., as their use offers many advantages. These include high sensitivity to many toxic or explosive gases, simple measuring technique, the possibility for miniaturization and mass production, low cost, etc. [1,2]. One of their most significant limitations is the lack of selectivity, as the surface of the metal oxide reacts with many different gases, changing the measured electrical resistance. Interfering gases—even if they are only present in trace amounts—and variations in the background level of humidity can significantly change the sensor signal, which leads to uncertainty in the interpretation of sensor data. This is especially a problem in new application fields; for instance, when sensors are integrated into buildings. In a long-term vision, the sensor network should be able to identify the nature and origin of the response in order to act correctly. As an example, the cross-sensitivity between CO and ethanol is a challenge, because it should be clear if the sensor resistance changes due to the presence of a toxic gas or because somebody is just drinking a glass of wine. The previously applied countermeasure is the use of charcoal filters, which are included in the packaging of the sensor element [1]. The method is based on the fact that ethanol or other volatile organic compounds (VOCs) are far more reactive to surface-catalyzed decomposition than Sensors 2016, 16, 1437; doi:10.3390/s16091437
www.mdpi.com/journal/sensors
Sensors 2016, 16, 1437
2 of 9
CO [2]. However, they suffer from saturation effects when the concentration of interfering gases or the exposure time is too high [1], and it will be very difficult to miniaturize them to the extent needed (e.g., for their integration in a smart phone). Other concepts are also applied to achieve selectivity [3]: Fine-tuning of the sensing material and operation conditions [4] and the use of sensor arrays [5,6] or specific filter materials (except charcoal) [7–13]. For the latter, gas detection with multilayer sensors consisting of a sensing layer and a filter layer on top was reported in previous studies. Generally, there are different concepts of how to increase the selectivity in this way: (1) (2)
Physical filters hinder interfering gases to reach the sensing layer. For example, compact films of SiO2 on top of the sensing layer act as molecular sieve for selective H2 detection [8,13]. Chemical filters can either eliminate the interfering gas by catalytic conversion into an inert product (for example, by depositing metallic films such as Pd, Pt, or Rh [10] or porous layers of metal oxides [8] on top of the sensing layer) or can influence the chemical reaction of the analyte in the sensing layer to enhance the desired response. In [7,14,15], an increase of sensitivity to a certain target gas was reported, which was achieved by the presence of a second noble metal-loaded Al2 O3 layer.
Furthermore, recent studies showed that double-layer gas sensors using different combinations of metal oxides can have a positive effect on the gas response [15–17]. In the present study, we focus on a combination of functional layers of metal oxides that show different sensing properties in order to create a device which is able to distinguish between interfering and target gases; in this specific case, ethanol and CO. The investigations show that these multi-layers respond differently to individual target gases or even gas mixtures in comparison to the single layers. The use of the relationship between the resistances of single-layer and double-layer sensors (two single layers combined) opens up the possibility of gaining more information and improving the selectivity. The functional layers are realized by direct thermophoretic deposition of nanoparticles synthesized by flame spray pyrolysis (FSP). FSP is a nanoparticle aerosol synthesis process that offers fast (within minutes) and dry (gas-phase) layer deposition. In comparison to conventional thick film SMOX sensor fabrication—where the deposition of pre-processed powders has to be done in an additional step after material synthesis—highly porous polycrystalline thick film layers can be realized by FSP in just one step [8]. Thus, FSP is a time efficient in situ technique for the direct deposition of the sensing material with the possibility of multi-layer fabrication [7,18–21]. Its flexibility allows for easy doping, and the appropriate choice of precursors and solvents results in a homogeneous distribution of dopants throughout the material. In the past, one drawback of the method was the high baseline resistance, which is related to the extremely high porosity of the layers. However, it was shown in recent studies [21] that by addition of antimony, the baseline resistance can be decreased by up to two orders of magnitude in dry air. Here, for illustration of the concept, the following sensing layers were chosen: 1 wt % Sb–0.01 wt % Pt-SnO2 alone or covered with 3 wt % Pd-SnO2 and 3 wt % Pd-SnO2 alone. Hence, a three sensor array was built and tested using two sensors based on individual single layers and one corresponding to the double layer (layer below//layer on top): 1 wt % Sb–0.01 wt % Pt-SnO2 //3 wt % Pd-SnO2 . 2. Materials and Methods Sensor fabrication and material preparation: Tin 2-ethylhexhanoate (Strem Chemicals, Kehl, Germany, 99.5% pure), platinum acetylacetonate (Alfa Aesar, Ward Hill, MA, USA, 99.9% pure), antimony (III) propoxide (Sigma Aldrich, Munich, Germany, 99.9% pure), and palladium (II) acetylacetonate were used as metallo-organic precursors dissolved in a highly combustible organic solvent such as xylene to make the total metal concentration of 0.5 M. For the synthesis of pure SnO2 , 50 mL of Tin (II) 2-ethylhexanoate precursor diluted (0.5 M by Sn) in xylene was used for spraying. For 3 wt % Pd-SnO2 , 263 mg of palladium (II) acetylacetonate was dissolved in in 50 mL of 0.5 M Sn-precursor for spraying. Similarly, for 1 wt % Sb–0.01 wt % Pt-SnO2 , 0.5 mL of Sb precursor was
Sensors 2016, 16, 1437
3 of 9
mixed with 50 mL of 0.5 M Sn-precursor. It should be noted here that the 0.01% of Pt promoter (0.6 mg Pt(acac)2 per 50 mL of the precursor–solvent combination) is added over 100% Sb-Sn combination. These precursor solutions were combusted using flame spray pyrolysis (FSP) to obtain ultrafine and highly crystalline particles. During combustion, the liquid precursor was supplied at the rate of 5 mL/min using a syringe pump. The precursor was then atomized by a two-phase nozzle with 5 L/min O2 at a constant pressure drop of 1.5 bar at the nozzle tip. The spray is ignited by a supporting CH4 and O2 premixed gases (1.5 L/min, 3.2 L/min) forming a self-sustaining spray flame. The particles are formed by reaction, nucleation, surface growth, coagulation, and coalescence in the spray flame environment and collected on glass fiber filters [22]. The sensing layer was directly in situ deposited onto comb-like structured pre-deposited Pt electrodes (30 µm electrode spacing) with the flame spray. The sensors were fixed on a copper support facing down towards the flame at a height of 25 cm from the nozzle, and the particles were thermophoretically deposited on the sensing area (2.5 mm × 5 mm) of the substrates [19]. For the fabrication of single-layer sensors (1 wt % Sb–0.01 wt % Pt-SnO2 and/or 3 wt % Pd-SnO2 ), the multiple sets of sensors were fabricated using each spray batch. However, for the double-layer sensor fabrication (1 wt % Sb–0.01 wt % Pt-SnO2 //3 wt % Pd-SnO2 ), similar sensors were first coated with 1 wt % Sb–0.01 wt % Pt-SnO2 material followed by spraying 3 wt % Pd-SnO2 material on top of the previously coated sensors. X-ray diffraction and refinement of the patterns: The XRD-pattern of the freshly prepared nanoparticles (1 wt % Sb–0.01 wt % Pt-SnO2 and/or 3 wt % Pd-SnO2 ) were refined using Bremen Rietveld Analysis and Structure Suite (BRASS), followed by extracting the structural parameters. Background, scale factor, unit cell parameters, and Gaussian as well as Lorentzian peak width parameters were simultaneously refined, followed by crystallite size and microstrain analyses. For the pattern refinement, the structural model for SnO2 (ICSD-39173) with space group (P42/MNM) [a = b = 4.7384, c = 3.1881, α = β = γ = 90◦ ] was used. Since the addition of Sb and/or Pt was ≤1%, the refinement was conducted using only the structural model of SnO2 . The quality of Rietveld refinement was evaluated in terms of the usual R factor (Rwp ) and the background corrected residual Rp [23]. A volume-weighted average crystallite size (dXRD ) and the root-mean-square lattice micro strain for each of the promoted and non-promoted SnO2 -based sensing materials were determined from the line-broadening analysis. The instrumental contribution to the peak broadening was taken into account during the full profile fitting using instrumental parameters derived from a fit of standard crystalline LaB6 . Brunauer-Emmett-Teller (BET) measurements: BET measurements were carried out using a Quantachrome NOVA 4000e Autosorb gas sorption system. The powders were placed in a test cell and allowed to degas for 2 h at 200 ◦ C in flowing nitrogen. The BET isotherm measurement using nitrogen as adsorbent at 77 K and relative pressure P/P0 over the range of 0.01–0.99 was considered. From the plot of [(P/P0 )/w(1 − P/P0 )] versus [P/P0 ] ranging between 0.05 and 0.3, straight lines were obtained, with the correlation coefficient being greater than 0.999. The BET surface area measurement is related to an average equivalent primary particle size, given by the equation dBET = 6/(p ·SA) [24], where dBET is the average diameter of a monodisperse particle, SA represents the measured surface area of the powder, and ρ is the theoretical density. Transmission Microscopy (TEM) imaging: For TEM specimen preparation, a small portion of the sample (~1–2 mg) was dispersed in 5 mL of ethanol (AR grade, Strem) in an ultrasonic bath and sonicated for 15 min. A drop from an eye dropper of this dispersion sample was placed on a nickel grid coated with carbon film (Cu grid was not used, as it would interfere with the Cu in the sample during extraction of the quantitative elemental data). The samples were dried in ambient air, and large regions of the sample were scanned before the investigation of the particle morphology. The low- and high-resolution TEM of the sample and the corresponding selected area electron diffractions (SAED) were examined by transmission electron microscopy (TEM) on a FEI Titan 80/300 microscope equipped with a Cs corrector for the objective lens, a Fischione high angle annular dark field detector (HAADF), GATAN post-column imaging filter, and a cold field emission gun operated at an acceleration voltage of 300 kV.
Sensors 2016, 16, 1437 Sensors Sensors 2016, 2016, 16, 16, 1437 1437
4 of 9 4 4 of of 9 9
3. Results Results 3. Results The characterizations characterizations of of the the dry dry particles particles were were conducted conducted to to confirm confirm that that the the particles particles obtained obtained The on the sensor substrates are identical to those collected as powders. The particles obtained from FSP powders. The particles obtained from FSP on the sensor substrates are identical to those collected as powders. were ultrafine and highly crystalline, as shown in Figure were ultrafine ultrafine and and highly highly crystalline, crystalline, as as shown shownin inFigure Figure1.1. 1. were
(upper panel), panel), 11 wt wt % % Sb–0.01 Sb–0.01 wt wt % % Figure Figure 1. 1. The The Rietveld Rietveld analysis analysis of of the the XRD XRD patterns patterns of of pure pure SnO SnO222 (upper 2//3 wt % Pd-SnO 2 (middle panel) and 3 wt % Pd-SnO 2 (lower panel). Pt-SnO //3 wt % Pd-SnO (middle panel) and 3 wt % Pd-SnO (lower panel). 2 2 2 Pt-SnO2//3 wt % Pd-SnO2 (middle panel) and 3 wt % Pd-SnO2 (lower panel).
The particles particles collected collected in in the the filter filter unit unit (very (very similar similar to to those those from from the the sensing sensing substrates) were were sensing substrates) The characterized using using BET BET and and XRD XRD measurements. measurements. The The specific surface areas of of pure pure SnO SnO22,,, 111 wt wt % % characterized The specific specific surface surface areas 2 2/g, Sb–0.01 wt % Pt-SnO 2, and 3 wt % Pd-SnO2 nanoparticles were found to be 96.1, 93.4, and 100.3 m 2 2 Sb–0.01 wt wt % % Pt-SnO Pt-SnO22, and 3 wt % Pd-SnO Pd-SnO22 nanoparticles nanoparticles were were found found to to be be96.1, 96.1,93.4, 93.4,and and100.3 100.3m m /g, /g, Sb–0.01 which are are equivalent crystallite sizes (d of equivalent to 8.9, 9.2, and 8.6 nm, respectively. The crystallite sizes (dXRD XRD of )5.5, 5.5, 5.6, and which equivalent to to 8.9, 8.9,9.2, 9.2,and and8.6 8.6nm, nm,respectively. respectively.The The crystallite sizes (d))XRD of 5.6, 5.5, and 5.6, 5.7 nm nm for pure SnO22,,SnO wt ,% % Sb–0.01 wt % % Pt-SnO Pt-SnO 2, and 3 wt % Pd-SnO2 were derived using Rietveld 5.7 SnO 11 wt wt 2, and 32 ,wt % Pd-SnO 2 were derived Rietveld and 5.7for nmpure for pure wt % Sb–0.01 wt % Pt-SnO and 3 wt % Pd-SnO derived using 2 1 Sb–0.01 2 were using refinement of the XRD patterns. Although the crystallite sizes were slightly lower than the than the the refinement of the XRD patterns. AlthoughAlthough the crystallite sizes were slightly than the than Rietveld refinement of the XRD patterns. the crystallite sizes werelower slightly lower BET primary particle sizes (d BET) of different particles, both the techniques showed similar sizes for BET primary particle sizes (dBET ) of (d different particles,particles, both the techniques showed similar for than the BET primary particle sizes both the techniques showedsizes similar BET ) of different pristine and Sb and/or Pt supported particles. The lowand high-resolution TEM imaging showed pristine Sb and/or supported particles.particles. The low-The andlowhigh-resolution TEM imaging showed sizes for and pristine and SbPtand/or Pt supported and high-resolution TEM imaging highly particles (see highly crystalline crystalline particlesparticles (see Figure Figure 2). showed highly crystalline (see2). Figure 2).
Figure 2. Low-resolution, high-resolution, Fourier-transformed image, and selected area diffraction Figure 2. 2. Low-resolution, Low-resolution, high-resolution, high-resolution, Fourier-transformed Fourier-transformed image, image, and and selected selected area area diffraction diffraction Figure (a–d); and and 11 wt wt % % Sb–0.01 Sb–0.01 wt wt % % Pt-SnO Pt-SnO22 sensing sensing materials materials (e–h). (e–h). pattern of of 33 wt wt % % Pd-SnO Pd-SnO22 (a–d); pattern of 3 wt % Pd-SnO2 2
The The particle particle sizes sizes derived derived from from TEM TEM are are approximately approximately 10 10 nm nm (measured (measured for for at at least least 100 100 The particle sizes derived agree from TEM are approximately 10 nm (measured for at least analysis. 100 particles), particles), which reasonably with the crystallite sizes obtained from Rietveld particles), which reasonably agree with the crystallite sizes obtained from Rietveld analysis. The The which reasonablypatterns agree with the the crystallite sizes obtained from Rietveld analysis. Theofwell-formed well-formed well-formed ring ring patterns of of the nanoparticle nanoparticle also also support support aa highly-crystalline highly-crystalline nature nature of the the sensing sensing ring patterns of the nanoparticle also support a highly-crystalline nature of the sensing materials. materials. The sensors after in situ deposition with 1 wt % Sb–0.01 wt % Pt-SnO 2 covered on the top materials. The sensors after in situ deposition with 1 wt % Sb–0.01 wt % Pt-SnO2 covered on the top The in situ deposition with 1 wt % Sb–0.01 wt % Pt-SnO covered on the top with 3 wt % withsensors 3 wt wt % % after Pd-SnO 2 were analyzed using focused ion beam (FIB) to2determine the layer thickness of with 3 Pd-SnO 2 were analyzed using focused ion beam (FIB) to determine the layer thickness of
Sensors 2016, 16, 1437
5 of 9
Pd-SnO were using focused ion beam (FIB) to determine the layer thickness of the first 22016, Sensors 2016, 16,analyzed 1437 55 of Sensors 16, 1437 of 99 layer (1 wt % Sb–0.01 wt % Pt-SnO2 ), the second layer (3 wt % Pd-SnO2 ), and the total thickness of the the first firstsensing layer (1 (1layer. wt % % Sb–0.01 Sb–0.01 wt wt % % Pt-SnO Pt-SnO22),), the the second second layer layer (3 (3 wt wt % % Pd-SnO combined the layer wt Pd-SnO22), ), and and the the total total thickness ofthe the combined sensing layer. layer covered with 3 wt % Pd-SnO2 and the lower layer The results showed that the upper thickness of combined sensing layer. The results showed that)the the upper upper layer covered covered with wt % 17 Pd-SnO and the (1 results that layer with 33 wt % Pd-SnO and respectively, the lower lower layer layer (1 wt wtthe (1 wt %The Sb–0.01 wtshowed % Pt-SnO thicknesses of ~18 (±1) and (±2) 22µm, while 2 had % Sb–0.01 wt % Pt-SnO 2)) had had thicknesses of ~18 (±1) and 17 (±2) µm, respectively, while the total % Sb–0.01 wt % Pt-SnO 2 thicknesses of ~18 (±1) and 17 (±2) µm, respectively, while the total total thickness of the sensing layer was found to be ~35 (±2) µm (see Figure 3, left panel). The thickness thicknessof ofthe the sensing sensing layer was was found found to to be be ~35 ~35 (±2) (±2) µm µm (see (see Figure Figure 3, 3, left The thickness left panel). panel). The thickness thickness derived from FIB showed layer that the consistent layer thickness is possible using versatile flame spray derived from FIB showed that the consistent layer thickness is possible using versatile flame spray derived from FIB showed that the consistent layer thickness is possible using versatile flame spray pyrolysis. The substrates onto which the sensing layer was deposited are shown in Figure 3. The three pyrolysis. The The substrates substrates onto onto which which the the sensing sensing layer layer was was deposited are are shown Figure The pyrolysis. shown in in during Figure 3. 3. The sensors of the system were measured simultaneously at 300 ◦ Cdeposited operation temperature exposure three sensors of the system were measured simultaneously at 300 °C operation temperature during three sensors of the system were measured simultaneously at 300 °C operation temperature during to 30 min pulses ethanol 90, 170(45, ppm) andppm) CO (20, in dry air (seeair Figure 4). exposure to 30 30 of min pulses (45, of ethanol ethanol 90, 170 170 and50, CO100 (20,ppm) 50, 100 exposure to min pulses of (45, 90, ppm) and CO (20, 50, 100 ppm) ppm) in in dry dry air (see (see Afterwards, 20, 50, and 20, 10050,ppm COppm wasCO exposed in a background of 70 ppm ethanol. The Pt Figure4). 4).Afterwards, Afterwards, and 100 100 was exposed exposed in aa background background of Figure 20, 50, and ppm CO was in of 70 70 ppm ppm ethanol. ethanol. The The electrodes on top of the substrates were connected to an electrometer in order to measure the sensing Pt electrodes electrodes on on top top of of the the substrates substrates were were connected connected to to an an electrometer electrometer in Pt in order order to to measure measure the the layers’ resistance a function the ambient concentration. sensing layers’as resistance as aoffunction of the gas ambient gas concentration. sensing layers’ resistance as a function of the ambient gas concentration.
Figure 3. 3. The The focused ion (FIB) beam (FIB) of a double sensingoflayer Figure focused ion beam image of aimage double sensing layer composed 1 wt %composed Sb–0.01 wt of Figure 3. The focused ion beam (FIB) image of a double sensing layer composed of 1 wt % Sb–0.01 wt 1 wt%%Pt-SnO Sb–0.01 wtwt %% Pt-SnO wt %total Pd-SnO The total was layerfound thickness found to be approximately 2//3 Pd-SnO 2. The layer2 .thickness to bewas approximately 35 (±2) µm 2 //3 % Pt-SnO2//3 wt % Pd-SnO2. The total layer thickness was found to be approximately 35 (±2) µm (Left); Layout the sensor substrates: Interdigitated platinum electrodes with trace/gapwith of 10 trace/gap µm, 30 35 (± 2) µm (Left);ofLayout of the sensor substrates: Interdigitated platinum electrodes (Left); Layout of the sensor substrates: Interdigitated platinum electrodes with trace/gap of 10 µm, 30 and platinum heater on the backside. Heater and conductive pads to the of 10µm, µm, 30 100 µm,µm, andrespectively, 100 µm, respectively, platinum heater on the backside. Heater and conductive µm, and 100 µm, respectively, platinum heater on the backside. Heater and conductive pads to the are passivated (Right). (Right). padselectrodes to the electrodes are passivated electrodes are passivated (Right).
Figure 4. Sensing results at 300 °C in dry air for the system 1 wt % Sb–0.01 wt % Pt-SnO2//3 wt % Pd-SnO2. Figure 4. Sensing results at 300 °C in dry air for the system 1 wt % Sb–0.01 wt % Pt-SnO2//3 wt % Pd-SnO2.
Figure 4. Sensing results at 300 ◦ C in dry air for the system 1 wt % Sb–0.01 wt % Pt-SnO2 //3 wt % Pd-SnO2 .
Sensors 2016, 16, 1437
6 of 9
4. Discussion The results from the measurements performed as described in the experimental section are presented in Figure 4, where the time dependence of the normalized resistances is shown. The normalization factor is the initial baseline value of the sensor resistance. The single-layer sensor doped with Pt and Sb changes its resistance around one order of magnitude during exposure to ethanol, and is also sensitive to CO. Furthermore, there is a resistance decrease when the sensor is exposed to CO in a background of ethanol, which means that ethanol and CO have an additive effect. The 3 wt % Pd-SnO2 -doped sensor has very different sensing properties, as it shows the largest response to ethanol and nearly none to CO. In contrast to the 1 wt % Sb–0.01 wt % Pt-SnO2 , it increases its resistance when measuring CO in a background of ethanol. It seems that due to the presence of CO, less ethanol reacts at the surface to decrease the resistance of the sensor. One reason could be the occupation of reaction partners—most probably oxygen ions—by CO to form carbonates sticking to the surface. Consequently, for the reaction with ethanol, a lower concentration of reaction partners is available to decrease the resistance of the sensor. No spectroscopic evidence for the formation of these carbonates is available for FSP-prepared layers, because it is not possible to record meaningful operando Diffuse Reflectance Infrared Fourier Transform (DRIFT) spectra with the small amount of sensing material deposited directly onto the substrates. Nevertheless, the fact that Pd dramatically modifies the CO surface reaction path and the formation of carbonate species on Pd-doped SnO2 thick film gas sensors obtained by classical wet chemistry preparation techniques was recently presented in [25]. The surface chemical reactions are obviously very different for the two single-layer materials. For the 1 wt % Sb–0.01 wt % Pt-SnO2 , such processes do not dominate, as the CO is still able to release electrons into the conduction band of the semiconductor, and the resistance decreases. When both materials are combined to form a double-layer sensor, the changes in resistance due to gas interaction are somewhere in between the resistances of the single-layer sensors. The presence of the second layer changes the responses to CO and ethanol of the 1 wt % Sb–0.01 wt % Pt-SnO2 -based sensor; namely, it increases the response to ethanol and decreases the response to CO. This means that the presence of the 3 wt % Pd-SnO2 layer activates the layer of SnO2 doped with Pt and Sb when measuring ethanol. The effect cannot be explained by a classical filter function, in which ethanol is converted to CO2 and H2 O in the filter layer and therefore a decreased number of ethanol molecules reach the sensing layer—this effect would decrease the sensor response to ethanol. Instead, a sensitization effect can be seen, which takes place at the interface between the two layers. The influence of Pd doping in FSP layers was studied in [26], where it was found that the dominating effect of Pd is related to the decrease of free charge carriers, while the effect on the surface chemistry is less strong. Therefore, the sensitization effect can most probably be explained by the electronic interaction of the two layers. The response of the double-layer sensor to CO can be explained by the classical filter function: CO is converted to CO2 in the filter layer, and thus a lower amount of CO is detected in the sensing layer. Therefore, the response of the double-layer sensor is lower than the 1 wt % Sb–0.01 wt % Pt-SnO2 sensor. For the measurement of CO in a background of ethanol, the response of the double-layer sensor is very low. The combination of all three sensors in an array can be used for a more complex evaluation: The fact that the double-layer sensor shows values of the resistance/sensor signals in between the two single-layers opens up the following new principle for a logic decision: as an example of the added value provided by the proposed array, a parameter linking the difference between the sensors was used; namely, the resistance ratio of the single-layer sensors and the double-layer sensor: R(single − layer)/R(double − layer) The as-calculated values are presented in Figure 5 for the various test conditions.
(1)
Sensors Sensors2016, 2016,16, 16,1437 1437
77of of99
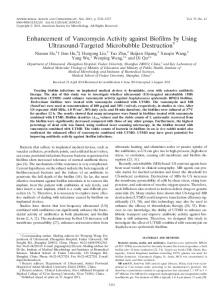
Figure Figure5. 5. Resistance Resistance ratios ratios of of the the single singleand andthe thedouble doublelayers. layers.
Thecomparison comparison of the gas composition behavior of ratios the two ratios shown in Figure 5 The of the gas composition behavior of the two shown in Figure 5 demonstrates demonstrates the capability of the proposed approach: all cases in which there is EtOH will of be the capability of the proposed approach: all cases in which there is EtOH will be signaled by values signaled the ratio by values of the ratio R(1 wt % Sb − 0.01 wt % Pt − SnO2 )/R(double − layer) > 1 (2) R(1 wt % Sb–0.01 wt % Pt-SnO2)/R(double-layer) > 1 (2) and andvalues valuesof ofthe theratio ratio
R(3 wt % Pd − SnO2 )/R(double − layer) < 1 (3) R(3 wt % Pd-SnO2)/R(double-layer) < 1 (3) This fact is only possible because the double-layer sensor shows a mixed response of the two single onlyconsists possible thedemonstrates double-layerthe sensor shows a mixed response the two layersThis thatfact the is array of.because It clearly ability to distinguish whether of ethanol is single layers that the array consists of. It clearly demonstrates the ability to distinguish whether present or not. In the presence of CO only, the ratios show the opposite: ethanol is present or not. In the presence of CO only, the ratios show the opposite: R(1 wtR(1 % Sb wt %wt Pt − (double − layer) < 1 2 ) /R wt−%0.01 Sb–0.01 % SnO Pt-SnO 2)/R(double-layer) < 1
(4) (4)
R(3 wt % Pd − SnO2 )/R(double − layer) > 1. R(3 wt % Pd-SnO2)/R(double-layer) > 1.
(5) (5)
and and On On the the basis basis of of such such an an evaluation, evaluation, aa device device can can be be developed developed which which is is able able to to identify identify the the presence of a certain target gas in a gas mixture by combining the measured resistance ratiowith witha presence of a certain target gas in a gas mixture by combining the measured resistance ratio adefined definedthreshold thresholdvalue. value. For For subsequent subsequent quantification, quantification, it it is is necessary necessary to to use use the the calibration calibration curves curves of of the the singlesingle- or or double-layer sensors. Consequently, the results indicate that devices with combinations of double-layer sensors. Consequently, the results indicate that devices with combinations of different different functional functionallayers layerscan canbe beused usedto toidentify identifythe thepresence presenceof ofdifferent differenttarget targetgases. gases. 5. Conclusions 5. Conclusions DC electrical resistance measurements on combinations of double- and single-layer sensors DC electrical resistance measurements on combinations of double- and single-layer sensors showed that the double-layers respond differently to exposure of CO and ethanol in comparison showed that the double-layers respond differently to exposure of CO and ethanol in comparison to to the corresponding single-layer sensors, of which they consist. This fact was used to identify the the corresponding single-layer sensors, of which they consist. This fact was used to identify the presence of ethanol during CO measurement, which is especially important in domestic applications. presence of ethanol during CO measurement, which is especially important in domestic It was realized by calculating resistance ratios of the single and double-layer sensors. The information applications. It was realized by calculating resistance ratios of the single and double-layer sensors. from the comparison of the different resistance ratios with an appropriate threshold value—1 in the The information from the comparison of the different resistance ratios with an appropriate threshold case of the system (1 wt % Sb–0.01 wt % Pt-SnO2 and/or 3 wt % Pd-SnO2 )—can be used to make value—1 in the case of the system (1 wt % Sb–0.01 wt % Pt-SnO2 and/or 3 wt % Pd-SnO2)—can be logic decisions about the presence of ethanol based on the different combinations of input signals. used to make logic decisions about the presence of ethanol based on the different combinations of The findings could be the basis for more elaborated logic sensor devices using functional sensing input signals. The findings could be the basis for more elaborated logic sensor devices using layers. Therefore, additional material improvement and systematic studies of layer combinations will functional sensing layers. Therefore, additional material improvement and systematic studies of layer combinations will be the subject of future investigations in the direction of chemical logic
Sensors 2016, 16, 1437
8 of 9
be the subject of future investigations in the direction of chemical logic sensor devices, in which logic gates could be directly implemented in the sensing layer’s nanostructure. Acknowledgments: The authors would like to acknowledge DFG support through WE 3662/1-2 and MA 3333/2-1 and Heraeus Sensor Nite for providing the sensor substrates. Author Contributions: L. Mädler, U. Weimar and N. Barsan conceived and designed the experiments. K. Grossmann and D. Pham performed the experiments. N. Barsan, K. Grossmann and J. Rebholz analyzed the data. S. Pokhrel and J. Rebholz wrote the article. Conflicts of Interest: The authors declare no conflict of interest.
References 1. 2. 3. 4. 5. 6. 7. 8. 9. 10. 11.
12. 13. 14.
15. 16. 17. 18.
19.
Ihokura, K.; Watson, J. The Stannic Oxide Gas Sensor Principles and Applications; CRC Press: Boca Raton, FL, USA, 1994. Williams, D.E. Semiconducting oxides as gas-sensitive resistors. Sens. Actuators B Chem. 1999, 57, 1–16. [CrossRef] Bârsan, N.; Schweizer-Berberich, M.; Göpel, W. Fundamental and practical aspects in the design of nanoscaled SnO2 gas sensors: A status report. Fresenius J. Anal. Chem. 1999, 365, 287–304. [CrossRef] Fleischer, M.; Meixner, H. Selectivity in high-temperature operated semiconductor gas-sensors. Sens. Actuators B Chem. 1998, 52, 179–187. [CrossRef] Moore, S.W.; Gardner, J.W.; Hines, E.L.; Göpel, W.; Weimar, U. A modified multilayer perceptron model for gas mixture analysis. Sens. Actuators B Chem. 1993, 16, 344–348. [CrossRef] Gardner, J.W. Detection of vapours and odours from a multisensor array using pattern recognition Part 1. Principal component and cluster analysis. Sens. Actuators B Chem. 1991, 4, 109–115. [CrossRef] Sahm, T.; Rong, W.; Barsan, N.; Mädler, L.; Weimar, U. Sensing of CH4 , CO and ethanol with in situ nanoparticle aerosol-fabricated multilayer sensors. Sens. Actuators B Chem. 2007, 127, 63–68. [CrossRef] Fleischer, M.; Kornely, S.; Weh, T.; Frank, J.; Meixner, H. Selective gas detection with high-temperature operated metal oxides using catalytic filters. Sens. Actuators B Chem. 2000, 69, 205–210. [CrossRef] Cabot, A.; Arbiol, J.; Cornet, A.; Morante, J.R.; Chen, F.; Liu, M. Mesoporous catalytic filters for semiconductor gas sensors. Thin Solid Films 2003, 436, 64–69. [CrossRef] Pijolat, C.; Viricelle, J.P.; Tournier, G.; Montmeat, P. Application of membranes and filtering films for gas sensors improvements. Thin Solid Films 2005, 490, 7–16. [CrossRef] Kwon, C.H.; Yun, D.H.; Hong, H.K.; Kim, S.R.; Lee, K.; Lim, H.Y.; Yoon, K.H. Multi-layered thick-film gas sensor array for selective sensing by catalytic filtering technology. Sens. Actuators B Chem. 2000, 65, 327–330. [CrossRef] Ryzhikov, A.; Labeau, M.; Gaskov, A. Al2 O3 (M = Pt, Ru) catalytic membranes for selective semiconductor gas sensors. Sens. Actuators B Chem. 2005, 109, 91–96. [CrossRef] Tournier, G.; Pijolat, C. Selective filter for SnO2 -based gas sensor: Application to hydrogen trace detection. Sens. Actuators B Chem. 2005, 106, 553–562. [CrossRef] Hubálek, J.; Malysz, K.; Prášek, J.; Vilanova, X.; Ivanov, P.; Llobet, E.; Brezmes, J.; Correig, X.; Svˇerák, Z. Pt-loaded Al2 O3 catalytic filters for screen-printed WO3 sensors highly selective to benzene. Sens. Actuators B Chem. 2004, 101, 277–283. [CrossRef] Su, P.G.; Chen, I.C. Laminating two-layer thick films structure tin oxide-based butane gas sensor operating at low temperature. Sens. Actuators B Chem. 2004, 99, 304–309. [CrossRef] Takao, Y. High ammonia sensitive semiconductor gas sensors with double-layer structure and interface electrodes. J. Electrochem. Soc. 1994, 141, 1028. [CrossRef] Yeh, M.-H.; Hwang, W.-S.; Lee, G.-B.; Lu, Y.-M. Characterization of SnO2 /TiO2 Double-Layer Films as Alcohol Sensing Materials. Mater. Trans. 2004, 45, 3318–3323. [CrossRef] Sahm, T.; Rong, W.; Bârsan, N.; Mädler, L.; Friedlander, S.K.; Weimar, U. Formation of multilayer films for gas sensing by in situ thermophoretic deposition of nanoparticles from aerosol phase. J. Mater. Res. 2007, 22, 850–857. [CrossRef] Sahm, T.; Mädler, L.; Gurlo, A.; Bârsan, N.; Weimar, U.; Roessler, A.; Pratsinis, S.E. High performance porous metal oxide sensors via single step fabrication. In Proceedings of the Eurosensors XIX, Barcelona, Spain, 11–14 September 2005; pp. 850–857.
Sensors 2016, 16, 1437
20.
21.
22. 23. 24. 25.
26.
9 of 9
Mädler, L.; Roessler, A.; Pratsinis, S.E.; Sahm, T.; Gurlo, A.; Barsan, N.; Weimar, U. Direct formation of highly porous gas-sensing films by in situ thermophoretic deposition of flame-made Pt/SnO2 nanoparticles. Sens. Actuators B Chem. 2006, 114, 283–295. [CrossRef] Großmann, K.; Kovács, K.E.; Pham, D.K.; Mädler, L.; Bârsan, N.; Weimar, U. Enhancing performance of FSP SnO2 -based gas sensors through Sb-doping and Pd-functionalization. Sens. Actuators B Chem. 2011, 158, 388–392. [CrossRef] Kemmler, J.; Pokhrel, S.; Mädler, L.; Weimar, U.; Barsan, N. Flame spray pyrolysis for sensing at the nanoscale. Nanotechnology 2013, 24, 442001. [CrossRef] [PubMed] Hill, R.J.; Fischer, R.X. Profile agreement indices in Rietveld and pattern-fitting analysis. J. Appl. Crystallogr. 1990, 23, 462–468. [CrossRef] Pokhrel, S.; Birkenstock, J.; Schowalter, M.; Rosenauer, A.; Mädler, L. Growth of ultrafine single crystalline WO3 nanoparticles using flame spray pyrolysis. Cryst. Growth Des. 2010, 10, 632–639. [CrossRef] Koziej, D.; Barsan, N.; Shimanoe, K.; Yamazoe, N.; Szuber, J.; Weimar, U. Spectroscopic insights into CO sensing of undoped and palladium doped tin dioxide sensors derived from hydrothermally treated tin oxide sol. Sens. Actuators B Chem. 2006, 118, 98–104. [CrossRef] Degler, D.; de Pereira Carvalho, H.W.; Weimar, U.; Barsan, N.; Pham, D.; Mädler, L.; Grunwaldt, J.-D. Structure-function relationships of concentrionally and flame made Pd-doped sensors studied by X-ray absorption spectroscopy and DC-resistance. Sens. Actuators B Chem. 2015, 219, 315–323. [CrossRef] © 2016 by the authors; licensee MDPI, Basel, Switzerland. This article is an open access article distributed under the terms and conditions of the Creative Commons Attribution (CC-BY) license (http://creativecommons.org/licenses/by/4.0/).