Discussion Paper
Selectivity of Big data
The views expressed in this paper are those of the author(s) and do not necessarily reflect the policies of Statistics Netherlands
2014 | 11
Bart Buelens Piet Daas Joep Burger Marco Puts Jan van den Brakel 28 March 2014
Selectivity of Big data Bart Buelens, Piet Daas, Joep Burger, Marco Puts, Jan van den Brakel Data sources referred to as Big data become available for use by NSIs. A major concern when considering if and how these data can be of value, is their potential selectivity. The data generating mechanisms underlying Big data vary widely, but have in common that they are very different from probability sampling, the data collection strategy ordinarily used at NSIs. Assessment of selectivity of Big data sets is generally not straightforward, if at all possible. Some approaches are proposed in this paper. It is argued that the degree to which selectivity – or its assessment – is an issue, depends on the way the data are used for production of statistics. The role Big data can play in that process ranges from minor over supplementary to vital. Methods for inference that are in part or wholly based on Big data need to be developed, with particular attention to their capabilities of dealing with or correcting for selectivity of Big data. This paper elaborates on the current view on these matters at Statistics Netherlands, and concludes with some discussion points for further consideration or research. This paper has been presented at the Statistics Netherlands Advisory Council meeting on 11 Feb. 2014. Keywords: representativeness, selection bias, model-based estimation, algorithmic inference, data science
Selectivity of Big data 2
1. Introduction When Big data are discussed in relation to official statistics, a point of critique often raised is that Big data are collected by mechanisms unrelated to probability sampling, and are therefore not suitable for production of official statistics. The first part of this statement – about Big data collection – is correct. The consequence – that Big data should not be used at NSI’s – is not one the authors of this paper would draw without further consideration. At the core of this critique is the concern that Big data sets are not representative of a population of interest; in other words, that they are selective by nature and therefore yield biased results. In this paper, this concern is addressed. In particular, strategies for assessing selectivity and for inference using selective Big data sources are explored. In the remainder of this introduction, Big data and selectivity are explained, and some examples are given. Assessment strategies are covered in section 2. Section 3 discusses some ideas for inference using potentially selective Big data sources. A discussion follows in section 4.
1.1 Big data Every paper on big data contains its own definition of the phenomenon, although recurring descriptions include the three Vs: volume, velocity and variety, see e.g. Manyika et al. (2011). Volume is what makes the data sets big; meaning: larger than regular systems can handle smoothly, or larger than data sets usually handled. Velocity can refer to the short time lag between the occurrence of an event and it being available in a data set for analysis. It can also refer to the frequency at which data records become available. The most extreme case is a continuous stream of data. The third V, variety, denotes the wide diversity of data sources and formats, ranging from financial transactions to text and video messages. An important additional characteristic in relation to official statistics is that many Big data sources contain records of events not necessarily directly associated with statistical units such as households, persons or enterprises. Table 1 contrasts Big data sources with traditional data sources: sample surveys and administrative registers. Two additional differences are listed. The first is the data generating mechanism. Big data are often a by-product of some process not primarily aimed at data collection, while survey sampling and keeping registers clearly are. Analysis of Big data is therefore often more data-driven than hypothesis-driven. The last difference listed in Table 1 describes coverage of the data source with respect to the population of interest. The most important distinction is between registers and Big data; the former often have nearly complete coverage of the population, while the latter generally do not. It is this last characteristic of Big data that is addressed in this report: incomplete coverage, and the associated risk for Big data to be selective. For some Big data sources, it may even be unclear what the relevant target population is. Table 1. Comparing data sources for official statistics. Data source Volume
Sample survey
Register
Big data
Small
Large
Big
Velocity
Slow
Slow
Fast
Variety
Narrow
Narrow
Wide
Units
Units
Events or units
Generating mechanism
Records
Sample
Administration
Various
Fraction of population
Small
Large, complete
Large, incomplete
Selectivity of Big data 3
A final difference, which is difficult to capture in a table and is therefore omitted from Table 1, is the error budgeting for each of the three data sources. In survey sampling, the concept of Total Survey Error is used to capture all error sources including, amongst others, sampling variance, non-response bias, interviewer effects and measurement errors; see e.g. Groves and Lyberg (2010) for a recent review. Frameworks for assessment of quality of statistics based on administrative registers have been developed, see e.g. Wallgren and Wallgren (2007), chapter 10. For Big data, no comprehensive approaches to error budgeting or quality aspects have emerged yet. It is clear that bias due to selectivity has a role to play in the error accounting of Big data, but there are other aspects to consider. For example, the measuring mechanisms for Big data sources are unlike those used in survey sampling, where through careful questionnaire design and interviewer training the measurement of well-defined constructs is operationalized. While the scope of the present paper is limited to selectivity, the wider context of error budgeting must not be neglected in Big data research programs.
1.2 Selectivity A subset of a finite population is said to be representative of that population with respect to some variable, if the distribution of that variable within the subset is the same as in the population. A subset that is not representative is referred to as selective. Representative subsets are attractive, as they allow for easy, unbiased inference about population quantities, simply by using distributional characteristics of a variable within the subset as estimators for the population equivalents. In probability sampling, every effort is made to obtain a representative sample – or subset – for some target population. The key is developing a survey design which results, in expectation, in a representative sample of the population. This is the corner stone of surveys based on probability samples, and explains why the issue of representativeness is often seen as indispensable in official statistics. Estimation theory for sample surveys hinges on the representativeness assumption and the possibility to quantify the error by using a sample estimate for the unknown population parameter. Methods for correcting minor deviations from representativeness, for example caused by selective nonresponse, have been developed and are in routine use nowadays (Bethlehem et al. 2011). At Statistics Netherlands, the generalised regression estimator (GREG) is such a method frequently used. All classic estimation methods are fundamentally based on the survey design, and are therefore known as design-based methods. When a data set becomes available through some mechanism other than random sampling, there is no guarantee whatsoever that the data are representative, unless they cover the full population of interest. When considering the use of a Big data source for official statistics, an assessment of selectivity needs to be conducted (see section 2).
1.3 Examples of Big data and their selectivity Mobile phone metadata consist of device identifier, date and time of activity on the network (call, text message or data traffic), and location information based on antenna and geographic cell details. Four billion records containing such data are collected each month by one of the three main providers in the Netherlands. Through an intermediary company, Statistics Netherlands has obtained access to aggregates of this data set. Aggregation is done both in the temporal and spatial dimension. The resulting table lists by one-hour intervals the number of activities on the network for all municipalities in the Netherlands. One of the goals is estimating the actual population density in each municipality at a given point in time. This density may differ from the official density, as the latter is based on the Population Register, which contains address information. The data set obtained from mobile phone data is selective
Selectivity of Big data 4
in that it contains data only for customers of one specific provider, and only about people when and where they use their phone. Details of this study can be found in Tennekes and Offermans (2013). A second example is the collection of all publicly available Dutch social media messages. Close to 3 million of such messages are produced on a daily basis. This data set is available for analysis at Statistics Netherlands, again through an intermediary company specialised in the collection and storage of social media messages. One of the potential uses is sentiment analysis of the messages based on the occurrence of terms with positive or negative connotations. The first results indicate a strong correlation between sentiment in social media messages, and the officially published consumer confidence. The latter is based on a survey by Statistics Netherlands. The social media data is selective in the sense that not everybody in the Netherlands posts messages on social media platforms, and that those who do, do so at varying rates, from an occasional message every few weeks to many messages a day. In addition, some accounts are managed by companies rather than by individuals. Daas et al. (2013; 2014) discuss this example in more detail.
Selectivity of Big data 5
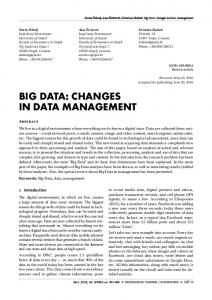
2. Assessing selectivity of Big data An assessment of selectivity of the response of a sample survey is conducted using known background characteristics of the sample units, both of those who responded and of those who did not, see e.g. Schouten et al. (2009). A similar approach can in principle be taken with Big data, although there are some pitfalls. A tentative methodology is shown in the diagram in Figure 1. The first issue is whether the Big data set contains records at event or at unit level. Event level data where the events can be matched to units, are regarded as unit level data in this context. When events cannot be matched to units, it may be the case that background characteristics of the units that generated the events are available, without an actual matching to the units. An example are counts of passing traffic by inductive loops built into the road surface. These loops generate events (one count for each passing vehicle) with no identifying information about the vehicle. The loops are able to measure the length of the wheelbase, allowing for distinguishing between cars and trucks. The wheelbase is a background characteristic of the units that is available at the event level. In such scenario’s, an assessment of selectivity is possible at an aggregated level restricted to the number and level of detail of the available background variables. If Big data are available at the unit level, or can be transformed into that form by linking events to units, it must be assessed whether the units can be identified using identifying information that is also available in registers; for example name, address, date of birth. If such information is available, a thorough assessment of selectivity is possible. Comparative analysis of the distributional characteristics of variables that are available in registers is possible. If no identifying information of the unit level data is available, it may be possible to derive background characteristics from within the Big data source. One example is TweetGenie (Jansen, 2013) which attempts to derive age and gender of twitter users only using their twitter messages. They claim a success rate of 85% estimating gender, and an accuracy of +/- four years in their age estimations. Such an approach is sometimes referred to as profiling: the derivation of background characteristics from the data itself. While not fully accurate, these characteristics can be used for an assessment of selectivity again by comparing distributions within the Big data to those in the population. Sometimes events can be attributed to units, with background characteristics only available at aggregated levels. This allows for at least some assessment of selectivity. An example is the mobile phone data discussed in section 1.3: while units are not identified and no background characteristics of the units (phones) is available, aggregated details of the customers of the provider are available, in particular gender-age distributions, which can be compared to the distribution in the Dutch population. If background characteristics are not available and cannot be derived, a final assessment that can be conducted is comparing Big data statistics with other sources. This is shown at the bottom of the diagram in Figure 1 and applies to both unit and event level Big data. If no other sources are available, an assessment of selectivity is not possible. If there are other sources available that result in statistics that are comparable to those based on the Big data source, a correlation analysis can be conducted, preferably at repeated points in time. To avoid the risk of discovering spurious or false correlations between two time series, cointegration offers a stronger argument. In the context of state space models, two series are cointegrated if they share a common trend. An example is the research into the potential cointegration of the officially published consumer confidence series, and the mood or sentiment derived from social media messages, see section 1.3 and Daas et al. (2014) for more details. In general, the relation between the Big data statistic and the other source – which will often be a traditionally
Selectivity of Big data 6
obtained statistic – may or may not be easily understood. The risk of not fully capturing the relation between the two is clearly higher when only a correlation is established without an explanation or meaningful appreciation of it.
Figure 1. Flow diagram for assessing selectivity of a Big data source.
Selectivity of Big data 7
3. Methods for inference Big data can be used in several ways in the production of official statistics. The degree to which selectivity of Big data poses a problem depends on the way the data are used. Four different uses are distinguished. First, statistics can be solely based on a Big data source: Big data are the single source of data used for the production of some statistic about a population of interest. In this setting, properly assessing selectivity of the data is essential, and, equally important, correcting for selectivity must occur. Correcting for selectivity is achieved through choosing an appropriate method of inference. Buelens et al. (2012) argue that severe deviations from representativeness may be less of a problem when powerful methods of inference are employed, such as model-based and algorithmic methods (Breiman, 2001). Such methods are aimed at predicting parameter values for unobserved units, and are commonly encountered in data mining and machine learning contexts (Hastie et al., 2003). Selecting an appropriate method and verifying its assumptions in specific situations remains challenging. Pseudo-design-based methods exist (Baker et al. 2013), but are limited in what they can achieve in terms of correcting for selectivity, as they are essentially weighted sums of available data and do not attempt to predict unobserved instances. The results will remain biased if specific subpopulations are completely missing in the Big data set. Unfortunately, none of the Big data sources considered so far at Statistics Netherlands contain identifying variables. Consequently, a thorough assessment of (and correction for) selectivity has not been achieved due to the impossibility to link the Big data sources to population registers. Second, Big data can be used as auxiliary data in a procedure primarily based on sample survey data. Statistics based on Big data are not used as such, but merely as a covariate in modelbased estimation techniques applied to survey sample data. The potential gain of this approach is a reduction in size of the sample, and the associated cost reduction and reduction of burden on respondents. This idea is explored in Pratesi et al. (2013), where data from GPS devices is used to measure interconnectivity between geographic areas. The degree to which an area is connected to other areas was found to be a good predictor of poverty. Using small area models, the Big data (GPS tracks) can be used as a predictor for survey-based measurements (poverty). A similar approach is used in Porter et al. (2013). In these scenarios, dealing with selectivity when producing the Big data based estimate is advisable, but is less crucial as only the correlation between the phenomena is exploited. A risk with this approach is that the Big data source could be instable over time, or exhibit sudden changes due to technical upgrades or other unforeseen circumstances. This is typical for secondary data sources and has occasionally been observed in administrative data. Third, aspects of the Big data mechanism can be employed as a data collection strategy in sample surveys. An example is geographic location data collected through GPS devices in smartphones to measure mobility, where only those units are monitored that have been selected by means of a probability sample (Arends et al. 2013). The smartphone and in-built GPS replace the traditional questionnaire, but all elements of survey sampling and associated estimation methods remain applicable. The data set collected in this way is not necessarily Big as such, but a number of properties of typical Big data sets are still present. In this context it is worth mentioning the phrase data science, which seems to become more prevalent than Big data nowadays. Data science covers all methods and techniques typically applicable to Big data, but widens the scope to data more generally (Schutt and O’Neil, 2013). Fourth, Big data may be used regardless of selectivity issues. The claim that the resulting statistics bear relevance to a population other than that covered by the Big data source cannot
Selectivity of Big data 8
and must not be made. Nevertheless, such statistics may be of interest and may enrich the official publications of Statistics Netherlands. An example is Google search behaviour about alternative medicine, a topic not well covered by the Statistics Netherlands Health Survey (Reep and Buelens, 2013). Internet searches are selective in the sense that not everybody of the Dutch population uses the internet, and of those who do, not everybody uses Google as a search engine, and not everybody who looks for information on alternative medicine does so through the internet or Google. Nevertheless, when no claims are made that the statistics apply to a population other than the Google users, the results may complement official health statistics simply as a nice extra. Any publication of such outcomes must clearly state its limitations and assumptions, and must be published in a format that avoids confusion with other statistics. Findings obtained from Big data in this way, through exploratory data analysis or visualisation, could even be consolidated or further investigated through sample survey research.
Selectivity of Big data 9
4. Discussion There are Big data sources that contain information relating to statistics produced by Statistics Netherlands. The question is whether these sources can or should be used, how this can be assessed, and how to use them if possible. The key issue addressed in this paper is selectivity of Big data, which arises from the fact that the data generating mechanism is not random sampling. In attempting to assess selectivity of Big data, the availability of background characteristics of the data is essential. The assessment will be more thorough the more characteristics are available. An additional complication is that many Big data sets contain events, which are not always easy to link to units of some target population. Assessments at aggregated levels seem possible in more situations. Depending on the extent to which selectivity can be assessed, Big data can be used in different ways to produce statistics. Only when the statistics are solely based on a Big data source is an exhaustive assessment of and correction for selectivity indispensable. When selectivity cannot be assessed properly, a safer approach is to incorporate the Big data into a statistical process that is chiefly based on familiar and trusted sources such as surveys or registers. The power of the Big data can be used to reduce costs and response burden, but not necessarily to render an existing survey redundant. In the Statistics Netherlands research plans on Big data, assessment of and dealing with selectivity of Big data is identified as an important topic. Despite the fact that statistical research on Big Data is still in its infancy globally (Glasson et al., 2013), it is remarkable that the topic of selectivity is hardly ever mentioned in important Big Data papers (e.g. Manyika et al, 2011; NAS, 2013). It is probably the strong IT-perspective taken in these papers that has caused their authors to neglect this essential topic. This emphasizes the vital role official statistics – and statistics in general – have to play in the (future) research on Big Data. Topics that can be discussed, considered and researched are the following. Are the methods used to assess selectivity due to nonresponse in sample surveys suitable for use with Big data? Are there other methods than those suggested in Fig.1? Is it a problem that the subpopulation giving rise to a certain Big data source, e.g. the subpopulation of twitter users, is unknown, and that it is dynamic over time? If statistical output based on Big data correlates – or cointegrates – with traditionally obtained outcomes, must there be a sensible/logical/causal explanation? Can the Big data source be used without such explanation? If selectivity of a Big data source remains largely unknown – as may often be the case – which use of that source is there for official statistics? Is lack of (assessment of) representativeness outweighed by reduced costs, absence of response burden, lower measurement error and improved timeliness? Should research into selectivity be widened to include all possible error sources (concept of error budgeting)?
Selectivity of Big data 10
References Arends J., Morren M. Wong F.Y., Roos M. (2013). Eindrapport project SmartER, Programma Impact ICT, Onderzoeksrapport nr. 10. BPA-nr PPM-2013-03-27-JTOH-MMRN-FWNG-MROS, CBS Heerlen. Baker R., Brick J.M., Bates N.A., Battaglia M., Couper M.P., Dever J.A., Gile K.J., Tourangeau R. (2013). Report on the AAPOR Task Force on Non-Probability Sampling. AAPOR report, May. Bethlehem J., Cobben F., Schouten B. (2011). Handbook of nonresponse in household surveys. Wiley. Breiman L. (2001). Statistical modeling: The two cultures. Statistical Science, Vol. 16, No. 3, pp. 199-231. Buelens B., Boonstra H.J., Van den Brakel J., Daas P. (2012). Shifting paradigms in official statistics: from design-based to model-based to algorithmic inference. Discussion paper 201218, Statistics Netherlands, The Hague/Heerlen. Cochran W.G. (1977). Sampling Techniques, third edition. New York: Wiley. Daas P., Puts M.J., Buelens B., van den Hurk P.A.M. (2013). Big Data and Official Statistics. Paper for the 2013 New Techniques and Technologies for Statistics conference, Brussels, Belgium. Daas, P. et al. (2014). Social Media Sentiment and Consumer Confidence. Paper for the Workshop on using Big Data for Forecasting and Statistics, Frankfurt am Main, Germany. Glasson, M., Trepanier, J., Patruno, V., Daas, P., Skaliotis, M., Khan, A. (2013). What does "Big Data" mean for Official Statistics? Paper for the High-Level Group for the Modernization of Statistical Production and Services, United Nations Economic Commission for Europe, March 10. Hastie T., Tibshirani R., Friedman J. (2003). The elements of statistical learning; data mining, inference, and prediction, Second Ed., Springer. Groves, R. M., Lyberg, L. (2010). Total Survey Error: Past, Present, and Future. Public Opinion Quarterly 74(5), pp. 849-879.
Selectivity of Big data 11
Explanation of symbols .
Data not available
*
Provisional figure
**
Revised provisional figure (but not definite)
x
Publication prohibited (confidential figure)
–
Nil
–
(Between two figures) inclusive
0 (0.0)
Less than half of unit concerned
empty cell
Not applicable
2013–2014
2013 to 2014 inclusive
2013/2014
Average for 2013 to 2014 inclusive
2013/’14 2011/’12–2013/’14
Crop year, financial year, school year, etc., beginning in 2013 and ending in 2014 Crop year, financial year, etc., 2011/’12 to 2013/’14 inclusive Due to rounding, some totals may not correspond to the sum of the separate figures.
Publisher Statistics Netherlands Henri Faasdreef 312, 2492 JP The Hague www.cbs.nl Prepress: Statistics Netherlands, Grafimedia Design: Edenspiekermann Information Telephone +31 88 570 70 70, fax +31 70 337 59 94 Via contact form: www.cbs.nl/information Where to order
[email protected] Fax +31 45 570 62 68 © Statistics Netherlands, The Hague/Heerlen 2014. Reproduction is permitted, provided Statistics Netherlands is quoted as the source.
60083 201411 X-10
CBS | Discussion Paper 2014 | 11 12