0090-9556/06/3403-449–456$20.00 DRUG METABOLISM AND DISPOSITION Copyright © 2006 by The American Society for Pharmacology and Experimental Therapeutics DMD 34:449–456, 2006
Vol. 34, No. 3 7369/3091874 Printed in U.S.A.
SELECTIVITY OF SUBSTRATE (TRIFLUOPERAZINE) AND INHIBITOR (AMITRIPTYLINE, ANDROSTERONE, CANRENOIC ACID, HECOGENIN, PHENYLBUTAZONE, QUINIDINE, QUININE, AND SULFINPYRAZONE) “PROBES” FOR HUMAN UDPGLUCURONOSYLTRANSFERASES Verawan Uchaipichat, Peter I. Mackenzie, David J. Elliot, and John O. Miners Department of Clinical Pharmacology, Flinders University and Flinders Medical Centre, Adelaide, Australia Received September 13, 2005; accepted December 19, 2005
ABSTRACT: UGT1A4 (IC50 1.5 M). Using phenylbutazone and quinine as “models,” inhibition kinetics were variously described by competitive and noncompetitive mechanisms. Inhibition of UGT2B7 by quinidine was also investigated further, because the effects of this compound on morphine pharmacokinetics (a known UGT2B7 substrate) have been ascribed to inhibition of P-glycoprotein. Quinidine inhibited human liver microsomal and recombinant UGT2B7, with respective Ki values of 335 ⴞ 128 M and 186 M. In conclusion, TFP and hecogenin represent selective substrate and inhibitor probes for UGT1A4, although the extensive nonselective binding of the former should be taken into account in kinetic studies. Amitriptyline, androsterone, canrenoic acid, hecogenin, phenylbutazone, quinidine, quinine, and sulfinpyrazone are nonselective UGT inhibitors.
Glucuronidation is an important metabolic pathway for the inactivation and elimination of many compounds, including drugs from all therapeutic classes, dietary chemicals, environmental pollutants, and endogenous compounds (e.g., bilirubin, bile acids, hydroxysteroids). The glucuronidation reaction is catalyzed by the enzyme UDP-glucuronosyltransferase (UGT), which facilitates the covalent linkage (conjugation) of glucuronic acid from its cosubstrate UDP-glucuronic acid (UDPGA), typically to substrates with carboxyl, hydroxyl (phenol or aliphatic alcohol), or amine functional groups (Miners and Mackenzie, 1991; Radominska-Pandya et al., 1999; Tukey and Strassburg, 2000; Miners et al., 2004). UGT exists as an enzyme superfamily, and UGT genes have been classified into families and subfamilies based on the sequence identity of the encoded proteins (Mackenzie et al., 1997). To date, 17 human UGT proteins have been identified: UGT 1A1, 1A3, 1A4, 1A5, 1A6, 1A7, 1A8, 1A9, 1A10, 2A1, 2B4, 2B7, 2B10, 2B11, 2B15, 2B17, and
2B28. However, several of these (UGT 1A5, 2B4, 2B10, 2B11, and 2B28) seem to have low or absent activity with xenobiotic substrates. Available evidence suggests that the active UGT enzymes exhibit distinct but overlapping substrate selectivities (Radominska-Pandya et al., 1999; Tukey and Strassburg, 2000; Miners et al., 2004). In addition, the individual forms differ in terms of regulation of expression, and numerous factors (e.g., genetic polymorphism) are known to alter enzyme activity (Miners et al., 2004). Tissue-specific expression is also a feature of UGT; notably, UGT 1A7, 1A8, and 1A10 are expressed only in the gastrointestinal tract, whereas UGT2A1 seems to be largely involved in olfactory signal termination. Given these features of UGTs, in vitro methods for identifying the form(s) responsible for the metabolism of any given drug (i.e., reaction phenotyping) is essential for understanding and predicting factors responsible for altered metabolic clearance in vivo. Reaction phenotyping most commonly employs either human liver microsomes or hepatocytes as the enzyme source, because both contain the various forms relevant to hepatic drug clearance in vivo (Miners et al., 2004). Form-selective inhibitors are pivotal to reaction phenotyping, and the use of cytochrome P450 (P450)-selective inhibitors has proved invaluable for the reaction phenotyping of P450-catalyzed reactions in
This work was supported by a grant from the National Health & Medical Research Council of Australia. Article, publication date, and citation information can be found at http://dmd.aspetjournals.org. doi:10.1124/dmd.105.007369.
ABBREVIATIONS: UGT, UDP-glucuronosyltransferase; AUC, area under the plasma concentration-time curve; AZT, zidovudine, i.e., 3⬘-azido3⬘-deoxythymidine; fuinc, fraction unbound in incubation mixtures; GAZT, 3⬘-azido-3⬘-deoxythymidine 5⬘--D-glucuronide; HEK293, human embryo kidney 293 cells; HLM, human liver microsome; HPLC, high-performance liquid chromatography; 4MU, 4-methylumbelliferone; P450, cytochrome P450; TFP, trifluoperazine; TFPG, trifluoperazine glucuronide; UDPGA, UDP-glucuronic acid. 449
Downloaded from dmd.aspetjournals.org at ASPET Journals on August 22, 2017
Relatively few selective substrate and inhibitor probes have been identified for human UDP-glucuronosyltransferases (UGTs). This work investigated the selectivity of trifluoperazine (TFP), as a substrate, and amitriptyline, androsterone, canrenoic acid, hecogenin, phenylbutazone, quinidine, quinine, and sulfinpyrazone, as inhibitors, for human UGTs. Selectivity was assessed using UGTs 1A1, 1A3, 1A4, 1A6, 1A7, 1A8, 1A9, 1A10, 2B7, and 2B15 expressed in HEK293 cells. TFP was confirmed as a highly selective substrate for UGT1A4. However, TFP bound extensively to both HEK293 lysate and human liver microsomes in a concentration-dependent manner (fuinc 0.20–0.59). When corrected for nonspecific binding, Km values for TFP glucuronidation were similar for both UGT1A4 (4.1 M) and human liver microsomes (6.1 ⴞ 1.2 M) as the enzyme sources. Of the compounds screened as inhibitors, hecogenin, alone, was selective; significant inhibition was observed only for
450
UCHAIPICHAT ET AL.
Materials and Methods Materials. 4MU, 4-methylumbelliferone--D-glucuronide, -glucuronidase (from Escherichia coli), alamethicin (from Trichoderma viride), amitriptyline (hydrochloride salt), androsterone, AZT, canrenoic acid (potassium salt), GAZT (3⬘-azido-3⬘-deoxythymidine 5⬘--D-glucuronide), hecogenin, phenylbutazone, TFP (dihydrochloride salt), trifluoroacetic acid, quinidine (hydrochloride monohydrate salt), quinine (hemisulfate salt hydrate), sulfinpyrazone, UDPGA (trisodium salt), and dialysis cellulose membrane (molecular mass cutoff 12,000 Da) were purchased from Sigma-Aldrich (St. Louis, MO). Solvents and other reagents were of analytical reagent grade. Human Liver Microsomes. Microsomes were prepared from four human livers (HL10, 12, 29, and 40; obtained from the Department of Clinical Pharmacology human liver bank) according to the method of Bowalgaha et al. (2005). Microsomes were activated by preincubation with alamethicin (50 g/mg protein) on ice for 30 min before their use in incubations (Boase and Miners, 2002). Expression of UGT Proteins. UGT 1A1, 1A3, 1A4, 1A6, 1A7, 1A8, 1A9, 1A10, 2B7, and 2B15 cDNAs were stably expressed in a human embryonic kidney cell line (HEK293) as described previously (Sorich et al., 2002; Uchaipichat et al., 2004). Cells were separately transfected with the individual UGT cDNAs and were incubated in Dulbecco’s modified Eagle’s medium, which contained puromycin (1.5 mg/l), 10% fetal calf serum, and penicillin G sodium (100 units/ml)/streptomycin sulfate (100 g/ml), in a humidified incubator with an atmosphere of 5% CO2 at 37°C. After growth to at least 80% confluence, cells were harvested and washed in phosphate-buffered saline. The harvested cells were lysed by sonication using a Heat Systems-Ultrasonics sonicator set at a microtip limit of 4. Cells expressing UGT1A proteins were sonicated with four 2-s “bursts,” each separated by 3 min of cooling on ice. A similar method was applied to UGT2B subfamily enzymes, except that sonication was limited to 1-s bursts. The samples were then centrifuged at 12,000g
for 1 min at 4°C, and the supernatant fraction was separated and stored at ⫺80°C until use. The protein concentration of cell lysates was determined by the method of Lowry (Lowry et al., 1951) using bovine serum albumin as the standard. It should be noted that immunoblotting studies with a commercial UGT1A antibody and a nonselective UGT antibody (raised against a purified mouse Ugt) have demonstrated that UGT is not expressed by untransfected HEK293 cells (Uchaipichat et al., 2004). Moreover, 4MU and TFP glucuronidation activities were below the limits of detection (see below) in control incubations performed with untransfected cells. TFP Glucuronidation Assay. Trifluoperazine glucuronide (TFPG) formation was determined using the method of Uchaipichat et al. (2006). The incubation mixture (200-l total volume) contained 50 mM Tris-HCl buffer (pH 7.4), 5 mM UDPGA, 5 mM MgCl2, activated human liver microsomes (0.1 mg/ml), or UGT1A4 HEK293 cell lysate (0.25 mg/ml), and TFP (5–200 M). Reactions were initiated by the addition of UDPGA, and incubations were performed at 37°C in a shaking water bath for 20 min. The reactions were terminated by the addition of 200 l of 4% acetic acid/96% methanol and then centrifuged at 5000g for 10 min. A 40-l aliquot of the supernatant fraction was injected into the HPLC column. TFPG was quantified by comparison of peak areas to those of a TFP external standard curve prepared over the concentration range 0.2 to 10 M. The lower limit of detection, assessed as 5 times background, was 8 pmol TFPG/incubation. 4MU Glucuronidation Assay. UGT 1A1, 1A3, 1A6, 1A7, 1A8, 1A9, 1A10, 2B7, and 2B15 activities were determined with 4MU as the substrate. 4MU glucuronidation was measured according to a previously published procedure (Miners et al., 1988). In brief, incubations contained 5 mM UDPGA, 5 mM MgCl2, HEK293 cell lysate, phosphate buffer (0.1 M, pH 7.4), and 4MU in a total volume of 0.6 ml. Incubations for each individual enzyme were performed using conditions reported previously by Sorich et al. (2002) for UGT1A1 and Uchaipichat et al. (2004) for UGT 1A3, 1A6, 1A7, 1A8, 1A9, 1A10, 2B7, and 2B15. The lower limit of detection (as defined above) was 30 pmol 4MU glucuronide/incubation. AZT Glucuronidation Assay and Quinidine Inhibition of UGT2B7. GAZT formation was measured using a modification of a previously described method (Boase and Miners, 2002). Incubation mixtures, in a total volume of 200 l, contained 0.1 M phosphate buffer (pH 7.4), 4 mM MgCl2, 5 mM UDPGA, AZT (250, 500, and 750 M for HLMs or 200, 400, and 600 M for UGT2B7), quinidine (0, 100, 200, 300, and 400 M), and activated 1 mg/ml HLMs or HEK293 cell lysate expressing UGT2B7 (1.5 mg/ml). Reactions were initiated by the addition of UDPGA, and incubations were carried out at 37°C in a shaking water bath for 60 min. Reactions were terminated by addition of 24% HClO4 (10 l), and mixtures were centrifuged at 5000g for 10 min. A 30-l aliquot of the supernatant fraction was injected into the HPLC column. HPLC was performed using an Agilent 1100 series (Agilent Technologies, Sydney, NSW, Australia) fitted with a Novapak C18 column (3.9 ⫻ 150 mm, 5 m; Waters, Milford, MA). The mobile phase, 0.12% v/v acetic acid in 10% acetonitrile/water, was delivered at a flow rate of 1.2 ml/min. Column eluant was monitored at UV absorbance 267 nm. Under these conditions, retention times of GAZT and AZT were 3 and 6.2 min, respectively. Concentrations of GAZT in incubation samples were determined by comparison of peak areas to those of GAZT standard curve with concentrations in the range 1 to 20 M. Inhibition of 4MU or TFP Glucuronidation by Drugs and Other Chemicals. Amitriptyline, androsterone, canrenoic acid, hecogenin, phenylbutazone, quinidine, quinine, and sulfinpyrazone were screened as inhibitors of UGT activities using 4MU or TFP as the substrate. 4MU was used as the substrate for the inhibition studies with UGT 1A1, 1A3, 1A6, 1A7, 1A8, 1A9, 1A10, 2B7, and 2B15, whereas TFP was used as the substrate for UGT1A4. Incubations with 4MU were performed at the concentration corresponding to the apparent Km or S50 value of each enzyme (Sorich et al., 2002; Uchaipichat et al., 2004). Concentrations of amitriptyline, phenylbutazone, quinidine, quinine, and sulfinpyrazone used in screening experiments were 0, 10, 100, 500, and 1000 M. The concentrations of hecogenin used for inhibition screening were 0, 1, 10, 100, and 200 M, whereas concentrations of androsterone and canrenoic acid were 0, 1, 10, 100 and 500 M. Negative controls for the 4MU assay contained each putative inhibitor and substrate (i.e., 4MU) without UDPGA, whereas negative controls for TFP assay contained inhibitor and
Downloaded from dmd.aspetjournals.org at ASPET Journals on August 22, 2017
human tissues (Miners et al., 1994; Clarke, 1998; Venkatakrishnan et al., 2001). In contrast to P450, the availability of UGT form-selective inhibitors is limited, although selective substrates have been identified for several UGTs (Miners et al., 2004). Consequently, reaction phenotyping of UGT substrates has most commonly involved screening for activity by recombinant enzymes, which is a time-consuming process and may yield ambiguous data (Miners et al., 2004). In this study, we characterized the selectivity of amitriptyline, androsterone, canrenoic acid, hecogenin, phenylbutazone, quinidine, quinine, and sulfinpyrazone as inhibitors of human UGTs. There is evidence to suggest that these compounds may inhibit xenobiotic glucuronidation in vitro and/or in vivo (Ventafridda et al., 1987; Yue et al., 1990; Resetar et al., 1991; Rajaonarison et al., 1992; Kirkwood et al., 1998; Egfjord et al., 1999) or may be substrates for human UGTs in vitro and/or in vivo (Green and Tephly, 1996; Coffman et al., 1998; Gall et al., 1999; Mirghani et al., 2003). Quinidine is of further interest because it is used as an inhibitor of P-glycoprotein in vivo to assess the role of this transporter in drug bioavailability. Indeed, inhibition of P-glycoprotein-mediated transport has been proposed as the mechanism for the increase in the area under the plasma concentration-time curve (AUC) of morphine (Kharasch et al., 2003), a drug metabolized predominantly by UGT2B7-catalyzed glucuronidation, in subjects coadministered quinidine. Effects of the putative inhibitors on UGT 1A1, 1A3, 1A6, 1A7, 1A8, 1A9, 1A10, 2B7, and 2B15 were investigated using the nonselective substrate 4-methylumbelliferone (4MU) as the “probe”. Since UGT1A4 exhibits negligible activity toward 4MU (Uchaipichat et al., 2004), trifluoperazine (TFP) was characterized as a specific probe substrate for this enzyme and subsequently used in the UGT1A4 inhibition studies. In addition, the inhibition kinetics of quinidine on human liver microsomal and recombinant UGT2B7 was further investigated using zidovudine (3⬘-azido-2⬘,3⬘-dideoxythymidine, AZT) as the substrate.
451
UGT SUBSTRATE AND INHIBITOR PROBES
Results Binding of TFP to Human Liver Microsomes and HEK293 Cell Lysate. To assess the impact of nonspecific binding to incubation constituents on TFP glucuronidation kinetics, the fraction unbound of TFP in incubation mixtures (fuinc) was determined as the drug con-
TABLE 1 Nonspecific binding of trifluoperazine to HLMs and HEK293 cell lysate Fraction Unbound (fuinc)a
关TFP兴
10 M 30 M 60 M 100 M 200 M
HLMs (0.1 mg/ml)
HEK293 Cell Lysate (0.25 mg/ml)
0.21 0.26 0.42 0.49 0.59
0.20 N.D. 0.44 0.50 0.57
N.D., not determined a Each value represents the mean from duplicate samples.
centration in the buffer compartment (free drug concentration) divided by the drug concentration in the HLM or HEK293 cell lysate compartment (total drug concentration). With both enzyme sources, fuinc was dependent on TFP concentration. As shown in Table 1, the fuinc values of TFP for mixtures containing HLMs and HEK293 cell lysate increased with increasing TFP concentration. Over the concentration range 10 to 200 M, the extent of TFP binding to both enzyme sources decreased from approximately 80% to 41%. Because of the concentration-dependent binding, TFP concentrations in incubation mixtures were corrected for nonspecific binding and data were analyzed according to both the free and added TFP concentration. TFP Glucuronidation Kinetics by Human Liver Microsomes and UGT1A4 HEK293 Cell Lysate. TFP (50 and 250 M) was screened for metabolism by all UGTs investigated here at a HEK293 lysate protein concentration of 0.25 mg/ml and an incubation time of 20 min. Activity was observed only with UGT1A4 (limit of detection 1.6 pmol/min 䡠 mg). Rates of TFP glucuronidation by UGT1A4 were 350 and 224 pmol/min 䡠 mg protein at substrate concentrations of 50 and 250 M, respectively. Subsequently, the kinetics of TFP glucuronidation by UGT1A4 were characterized over the substrate concentration range 5 to 200 M. Kinetic parameters for TFP glucuronidation by HLMs and UGT1A4 are shown in Table 2. TFP glucuronidation kinetics by both enzyme sources were best described by a substrate inhibition model (Fig. 1). Based on added TFP concentrations, Km values were 61 ⫾ 22 M and 39 M with HLMs and UGT1A4 as the enzyme sources, respectively. The Ksi values were approximately 2.3-fold (for HLMs) and 5.2-fold (for UGT1A4) higher than the Km values. Vmax values for TFP glucuronidation by HLMs and UGT1A4 were 965 ⫾ 180 and 789 pmol/min 䡠 mg protein, respectively. When corrected for nonspecific binding, the Km values for HLMs (6.1 ⫾ 1.2 M) and UGT1A4 (4.1 M) were in good agreement (Table 2). Using the corrected substrate concentrations, Ksi values were 35- to 70-fold higher than Km (Table 2). The mean derived Vmax values were marginally lower for HLMs and UGT1A4 (43% and 36%, respectively), compared with those determined on the basis of added substrate concentration. Inhibition of UGT Isoform Activities. The effects of amitriptyline, androsterone, canrenoic acid, hecogenin, phenylbutazone, quinidine, quinine, and sulfinpyrazone on UGT activities were investigated using 4MU or TFP as the substrate. 4MU was used as the substrate for the inhibition studies with UGT 1A1, 1A3, 1A6, 1A7, 1A8, 1A9, 1A10, 2B7, and 2B15, whereas TFP was used as the substrate for UGT1A4. As shown in Fig. 2, hecogenin was a highly selective inhibitor of UGT1A4. The IC50 value for hecogenin inhibition of UGT1A4 was 1.5 M (Fig. 2D; Table 3). Hecogenin inhibition of UGT1A4 ranged from 40% at 1 M to 87% at 200 M, whereas inhibition of other UGT activities was less than 15%. With the exception of hecogenin, all compounds generally exhibited nonselective inhibition of UGT activities (Fig. 2; Table 3), although a degree of selectivity was observed for some compounds.
Downloaded from dmd.aspetjournals.org at ASPET Journals on August 22, 2017
UDPGA (without substrate). Amitriptyline and quinidine (available as salts) were dissolved in water, but androsterone, canrenoic acid, phenylbutazone, quinine, sulfinpyrazone, and hecogenin required addition of an organic solvent, which was selected on the basis of known effect on enzyme activity (Uchaipichat et al., 2004). Up to 2% methanol (v/v) was selected for incubations with all UGTs except UGT 1A6 and 2B15. Incubations with these enzymes contained 1% methanol (v/v) for the dissolution of androsterone, canrenoic acid, phenylbutazone, quinine, and hecogenin, whereas 1% dimethyl sulfoxide (v/v) was used for incubations containing sulfinpyrazone. Control incubations contained the same concentration of organic solvent. Subsequent experiments that determined inhibitor constants (Ki) for selected compounds included four inhibitor concentrations at each of three substrate concentrations. The Ki values of phenylbutazone and quinine were investigated for those enzymes exhibiting Michaelis-Menten 4MU glucuronidation kinetics (viz. UGT 1A1, 1A6, 1A7, and 1A10) and for UGT1A9 (“weak” substrate inhibition). In addition, AZT was used as the substrate for the determination of the Ki value for quinidine inhibition of human liver microsomal (HL 10, 12, 29, and 40) and recombinant UGT2B7. Nonspecific Binding of TFP to Human Liver Microsomes and HEK293 Cell Lysate. Nonspecific binding of TFP to human liver microsomes or HEK293 lysate was investigated using the equilibrium dialysis method of McLure et al. (2000). In brief, one side of the dialysis apparatus contained TFP (10, 30, 60, 100, or 200 M), pooled human liver microsomes (n ⫽ 4) (0.1 mg/ml), or HEK293 cell lysate (0.25 mg/ml), and Tris-HCl buffer (50 mM, pH 7.4), whereas the other compartment contained Tris-HCl buffer alone. The dialysis cell assembly was immersed in a water bath maintained at 37°C and rotated at 12 rpm for 3 h. Control experiments were also performed with buffer or pooled human liver microsomes (0.1 mg/ml) or HEK293 cell lysate (0.25 mg/ml) on both sides of the dialysis cell at high (200 M) and low (10 M) TFP concentrations to ensure that equilibrium was attained. The contents of each compartment (200 l) were collected, treated with 200 l of 4% (v/v) acetic acid in methanol, vortex mixed, and centrifuged (5000g for 10 min). A 5-l aliquot of the supernatant fraction was analyzed by HPLC. The HPLC system and conditions were essentially identical to those described previously for the measurement of TFPG (Uchaipichat et al., 2005), except that the mobile phase (50% mobile phase A/50% mobile phase B) was delivered isocratically at a flow rate of 1 ml/min. Under these conditions, TFP eluted at 3.3 min. Standards in the concentration range 10 to 200 M were prepared in Tris-HCl buffer (50 mM, pH 7.4) and treated in the same manner as dialysis samples. The TFP concentrations of dialysis samples were determined by comparison of peak areas with those of the standard curve. Within-day assay imprecision was assessed by measuring TFP (10 or 200 M) in five replicate samples containing buffer and pooled human liver microsomes (0.1 mg/ml) (from HL 10, 12, 29, and 40). Coefficients of variation in all cases were less than 4%. Data Analysis. Kinetic constants for TFP glucuronidation by liver microsomes or recombinant UGT1A4 were obtained by fitting experimental data to the Michaelis-Menten and substrate inhibition equations using Enzfitter (Biosoft, Cambridge, UK). The Michaelis-Menten equation is v ⫽ (Vmax ⫻[S])/(Km ⫹ [S]), where v is the rate of reaction, Vmax is the maximum velocity, Km is the Michaelis constant (substrate concentration at 0.5 Vmax), and [S] is the substrate concentration. Substrate inhibition (Houston and Kenworthy, 2000) is given as v ⫽ Vmax/[1 ⫹ (Km/[S]) ⫹ ([S]/Ksi)], where Ksi is the constant describing the substrate inhibition interaction. Apparent Ki values were calculated by nonlinear regression analysis using Enzfitter software (Biosoft, Cambridge, UK) and determined by fitting experimental data to the expressions for competitive, noncompetitive, and mixed inhibition models. Goodness of fit to kinetic and inhibition models was assessed from the F statistic, r2 values, parameter standard error estimates, and 95% confidence intervals. The IC50 values were similarly determined by nonlinear regression analysis using Enzfitter. Kinetic constants and IC50 values are reported as the value ⫾ standard error of the parameter estimate.
452
UCHAIPICHAT ET AL. TABLE 2 Kinetic constants for trifluoperazine glucuronidation by alamethicin-treated human liver microsomes and by UGT1A4
For all data, best fit was to the substrate inhibition model. Data are presented as mean ⫾ standard error of parameter fit. Km
Ksi
M
HL10 HL12 HL29 HL40 Mean ⴞ S.D. UGT1A4 a
84 ⫾ 1.1 (7.6 ⫾ 0.1)a 51 ⫾ 1 (6.0 ⫾ 0.2) 77 ⫾ 1.9 (6.2 ⫾ 0.1) 35 ⫾ 0.5 (4.7 ⫾ 0.3) 61 ⴞ 22 (6.1 ⴞ 1.2) 39 ⫾ 3.5 (4.1 ⫾ 0.04)
Vmax pmol/min 䡠 mg protein
65 ⫾ 1.2 (105 ⫾ 2) 122 ⫾ 3.6 (158 ⫾ 6.4) 84 ⫾ 2.4 (164 ⫾ 4.5) 287 ⫾ 6.5 (417 ⫾ 54) 140 ⴞ 101 (211 ⴞ 140) 206 ⫾ 25 (285 ⫾ 3.5)
820 ⫾ 5.9 (394 ⫾ 2) 1180 ⫾ 11 (721 ⫾ 7.1) 1048 ⫾ 16 (487 ⫾ 3.2) 815 ⫾ 5.7 (578 ⫾ 13) 965 ⴞ 180 (545 ⴞ 139) 789 ⫾ 43 (508 ⫾ 1.1)
Data in parentheses are kinetic parameters corrected for nonspecific binding.
Apart from UGT1A4, phenylbutazone and sulfinpyrazone exhibited greater inhibition of UGT1A family enzymes compared with UGT2B family enzymes (Fig. 2, E and H). The IC50 values for inhibition of the UGT1A family enzymes ranged from 10 to 290 M, whereas the IC50 values for UGT2B enzymes were approximately 400 to 2900 M (Table 3). Interestingly, androsterone activated UGT1A8 activity (12– 68%; Fig. 2B) whereas quinidine activated UGT1A3 activity (31– 38%; Fig. 2F). While screening quinine inhibition of 4MU glucuronidation by UGT isoforms, we observed that a soluble compound(s) present in the liquid scintillation glass vials (Chase Scientific Glass Inc., Rockwood, TN), which were used for storing the quinine stock solution in methanol, was a highly selective inhibitor of UGT1A7 activity. Regardless of the quinine concentration added, UGT1A7 activity was almost completely abolished by the solution prepared in these vials. The effect of a methanolic extract prepared from the vials on 4MU glucuronidation by UGT1A7 was further investigated. UGT1A7 was inhibited by 80% by the methanolic extract (2% v/v final concentration of methanol in incubation mixture), whereas the methanolic extract from acid-washed vials had a negligible effect on enzyme
activity. Methanolic extracts from other brands of vials had little or no effect on UGT1A7 and other UGT activities. Inhibition Kinetics of Phenylbutazone and Quinine. Using phenylbutazone and quinine as “models,” the inhibition kinetics were characterized for those enzymes exhibiting Michaelis-Menten 4MU glucuronidation kinetics (viz. UGT 1A1, 1A6, 1A7, and 1A10) and for UGT1A9 (“weak” substrate inhibition) (Sorich et al., 2002; Uchaipichat et al., 2004). Data were consistent with noncompetitive inhibition, except for the inhibition of UGT1A1 by both drugs and quinine inhibition of UGT1A10 (all competitive inhibition) (Fig. 3; Table 4). Quinine inhibition of UGT 1A6 and 1A9 was not characterized kinetically because of the low degree of inhibition, whereas phenylbutazone inhibition of UGT1A6 was not adequately fitted to any of the inhibition models. The Ki values for inhibition by phenylbutazone and quinine ranged from 3.9 M (UGT1A7) to 272 M (UGT1A1) and 384 M (UGT1A1) to 784 M (UGT1A7), respectively. Quinidine Inhibition of AZT Glucuronidation by Human Liver Microsomes and UGT2B7. The kinetics of quinidine inhibition of AZT glucuronidation by human liver microsomes and recombinant UGT2B7 was investigated. Quinidine was a competitive inhibitor of
Downloaded from dmd.aspetjournals.org at ASPET Journals on August 22, 2017
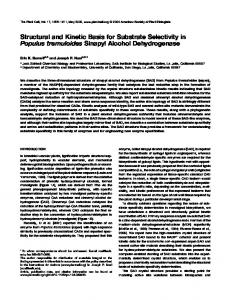
FIG. 1. Representative kinetic plots [rate (v) versus [S] and Eadie-Hofstee] for trifluoperazine glucuronidation by human liver microsomes and UGT1A4. A and B, TFP glucuronidation by alamethicin-treated microsomes (HL40). C and D, TFP glucuronidation by UGT1A4.
UGT SUBSTRATE AND INHIBITOR PROBES
453
Downloaded from dmd.aspetjournals.org at ASPET Journals on August 22, 2017 FIG. 2. The effects of amitriptyline (A), androsterone (B), canrenoic acid (C), hecogenin (D), phenylbutazone (E), quinidine (F), quinine (G), and sulfinpyrazone (H) on the activities of human UGTs. TFP (40 M) was used as substrate for the inhibition studies with UGT1A4, whereas 4MU was used as the substrate for all other isoforms. Concentrations of 4MU corresponded to the known Km or S50 for each UGT. Panels to the right show inhibitor concentrations. Each bar represents the mean percentage activity relative to control from duplicate measurements.
454
UCHAIPICHAT ET AL. TABLE 3
IC50 values for inhibition of human UDP-glucuronosyltransferases by amitriptyline, androsterone, canrenoic acid, hecogenin, phenylbutazone, quinidine, quinine, and sulfinpyrazone UGT
IC50b
a
Amitriptyline
Androsterone
Canrenoic Acid
Hecogenin
Phenylbutazone
Quinidine
Quinine
Sulfinpyrazone
861 ⫾ 7 388 ⫾ 41 1355 ⫾ 56 3290 ⫾ 240 970 ⫾ 69 977 ⫾ 17 ⬎5000 717 ⫾ 18 322 ⫾ 11 212 ⫾ 4
46 ⫾ 1.6 267 ⫾ 4 651 ⫾ 13 187 ⫾ 11 16 ⫾ 2 158 ⫾ 1 11 ⫾ 0.7 58 ⫾ 0.6 2741 ⫾ 45 402 ⫾ 9
M
1A1 1A3 1A4 1A6 1A7 1A8 1A9 1A10 2B7 2B15
1345 ⫾ 37 1120 ⫾ 22 856 ⫾ 24 152 ⫾ 4 355 ⫾ 22 111 ⫾ 10 443 ⫾ 6 153 ⫾ 10 129 ⫾ 4 72 ⫾ 0.4
125 ⫾ 6 65 ⫾ 31 106 ⫾ 5 N.D.c N.D.c N.D.d 7 ⫾ 4.2 102 ⫾ 4 16 ⫾ 4 48 ⫾ 3
372 ⫾ 1 1387 ⫾ 27 503 ⫾ 24 545 ⫾ 20 693 ⫾ 30 362 ⫾ 4 1205 ⫾ 53 318 ⫾ 9 707 ⫾ 25 249 ⫾ 4
N.D.c N.D.c 1.5 ⫾ 0.1 N.D.c N.D.c N.D.c N.D.c N.D.c N.D.c N.D.c
294 ⫾ 4 266 ⫾ 8 1227 ⫾ 95 10 ⫾ 6 11 ⫾ 1.5 40 ⫾ 1.6 13 ⫾ 0.2 48 ⫾ 1.8 2962 ⫾ 727 394 ⫾ 6
776 ⫾ 14 N.D.d 1619 ⫾ 17 2515 ⫾ 480 507 ⫾ 10 551 ⫾ 13 278 ⫾ 20 536 ⫾ 2 159 ⫾ 21 133 ⫾ 14
FIG. 3. Representative Dixon plots for phenylbutazone and quinine inhibition. Phenylbutazone inhibition of UGT1A1 (A) and UGT1A9 (B), and quinine inhibition of UGT1A1 (C) and UGT1A7 (D) is shown.
AZT glucuronidation by alamethicin-activated human liver microsomes and UGT2B7 (Fig. 4). The respective Ki values were 335 ⫾ 128 M (mean ⫾ S.D.) and 186 M. Discussion Human UGT comprises an enzyme “superfamily.” Compared with other drug-metabolizing enzymes, the substrate selectivity of the individual UGTs is poorly understood, due largely to the limited availability of isoform-selective inhibitors (Miners et al., 2004). Selective inhibitors allow identification of the enzyme(s) responsible for the metabolism of any given compound by human liver microsomes (“reaction phenotyping”) (Miners et al., 1994; Clarke, 1998; Venkatakrishnan et al., 2001). This study was performed to characterize the selectivity of inhibition of 10 human UGTs by eight compounds:
amitriptyline, androsterone, canrenoic acid, hecogenin, phenylbutazone, quinidine, quinine, and sulfinpyrazone. Inhibition was assessed using the nonselective UGT substrate 4MU for all enzymes except UGT1A4. TFP was characterized in this study as a “specific” substrate of UGT1A4 and used for inhibition studies of this enzyme. Hecogenin was demonstrated to be a selective inhibitor of UGT1A4. All other compounds were nonselective inhibitors, although phenylbutazone and sulfinpyrazone exhibited “relative” selectivity for UGT1A subfamily enzymes. TFP is a tertiary amine which has been reported previously as a substrate of UGT1A4 (Green and Tephly, 1996), and recently, it has been proposed that this compound is a selective substrate for UGT1A4, although the kinetics of inhibition were not characterized (Ghosal et al., 2004; Di Marco et al., 2005). The present study
Downloaded from dmd.aspetjournals.org at ASPET Journals on August 22, 2017
a Basal control activities of UGT 1A1, 1A3, 1A4, 1A6, 1A7, 1A8, 1A9, 1A10, 2B7, and 2B15 at the substrate concentrations used (see Materials and Methods) were 65, 400, 300, 70,000, 15,000, 2800, 3000, 5300, 70, and 15 pmol/min 䡠 mg, respectively. b Data are presented as mean ⫾ standard error of parameter fit. c N.D., not determined due to low degree of inhibition (IC50 ⬎ 200 M). d N.D., not determined due to enzyme activation.
UGT SUBSTRATE AND INHIBITOR PROBES TABLE 4 Inhibitor constants for phenylbutazone and quinine inhibition of 4-methylumbelliferone glucuronidation by human UGTs Kia,b UGT Phenylbutazone
Quinine
M
1A1 1A6 1A7 1A9 1A10
272 ⫾ 8.6 N.F. 3.9 ⫾ 0.3 5.7 ⫾ 0.2 12 ⫾ 0.4
384 ⫾ 6.8 N.D. 784 ⫾ 3.5 N.D. 492 ⫾ 31
N.D., not determined due to low degree of inhibition (IC50 ⬎ 1 mM); N.F., data were not consistent with competitive, noncompetitive, or mixed inhibition models. a Noncompetitive inhibition, except for phenylbutazone inhibition of UGT1A1 (competitive inhibition) and quinine inhibition of UGT 1A1 and 1A10 (competitive inhibition). b Values are Ki ⫾ standard error of parameter fit.
confirmed that, of the 10 human UGT enzymes investigated here, only UGT1A4 glucuronidated TFP. TFP glucuronidation by HLMs and recombinant UGT1A4 both exhibited substrate inhibition, with similar Km values (approximately 5 M) based on free concentration. The TFP glucuronidation kinetics reported here contrast with results re-
ported by BD Gentest (http://www.bdbiosciences.com/discovery_ labware/gentest/products/pdf/1A4_AAPS_S01T056R1.pdf), which were fitted to the Michaelis-Menten equation (despite kinetic plots resembling substrate inhibition). It is noteworthy that it was shown that TFP bound extensively to HLMs and HEK293 cell lysate in a concentration-dependent manner. Even at the low protein concentrations used here (0.1 mg/ml HLMs and 0.25 mg/ml cell lysate), binding to these enzyme sources ranged from 41% to 80%. This is consistent with previous studies indicating that nonspecific binding to human liver microsomes may be substantial (and saturable) for lipophilic basic compounds (Obach, 1999; McLure et al., 2000; Austin et al., 2002). Interestingly, in this study, we found that TFP also binds to HEK293 cell lysate to the same extent as to human liver microsomes. The apparent Km of TFP determined on the basis of the free concentration was 10-fold lower than that determined from added concentration. Hecogenin exhibited highly selective inhibition of UGT1A4 and therefore represents a useful tool for the reaction phenotyping of human liver microsomal xenobiotic glucuronidation by this enzyme. These data are consistent with information provided by BD Gentest (http://www.bdbiosciences.com/discovery_labware/gentest/products/ pdf/1A4_AAPS_S01T056R1.pdf). Apart from TFP, we have also demonstrated that hecogenin (10 M) essentially abolishes UGT1A4catalyzed lamotrigine N2-glucuronidation (A. Rowland, P. I. Mackenzie, J. A. Williams, and J. O. Miners, manuscript in preparation), indicating that inhibition is unlikely to be substrate-dependent. Because TFP glucuronidation by UGT1A4 does not follow MichaelisMenten kinetics, further experiments to pursue the mechanism and inhibition constant were not conducted here. However, competitive inhibition might be expected since hecogenin is a known substrate of UGT1A4 (Green and Tephly, 1996). It has been reported previously that phenylbutazone and sulfinpyrazone, which are both C-glucuronidated in humans (Dieterle et al., 1975; Aarbakke, 1978), inhibit the glucuronidation of AZT in vitro (Resetar et al., 1991; Rajaonarison et al., 1992). The present study confirmed that phenylbutazone and sulfinpyrazone inhibited UGT2B7, the enzyme responsible for AZT glucuronidation. However, these compounds additionally inhibited UGT 1A1, 1A3, 1A4, 1A6, 1A7, 1A8, 1A9, 1A10, and 2B15, although a degree of selectivity was also observed. Phenylbutazone and sulfinpyrazone exhibited preferential inhibition of UGT1A family enzymes (except UGT1A4). Apparent Ki values for phenylbutazone inhibition of UGT 1A1, 1A7, 1A9, and 1A10 ranged from 3.9 to 272 M. The Ki value for phenylbutazone inhibition of AZT glucuronidation (a known substrate of UGT2B7) by HLMs was reported previously as 1.4 mM (Resetar et al., 1991). Amitriptyline, canrenoic acid, quinidine, and quinine were similarly nonselective inhibitors of UGTs. These results are consistent with previously published data that demonstrated inhibition of xenobiotic glucuronidation in vitro and/or in vivo (Ventafridda et al., 1987; Yue et al., 1990; Resetar et al., 1991; Rajaonarison et al., 1992; Kirkwood et al., 1998; Egfjord et al., 1999). Inhibition by androsterone was also screened in this study, since it is apparently a selective substrate for UGT2B7 (Jin et al., 1997; Coffman et al., 1998; Gall et al., 1999). Although androsterone was a reasonably potent inhibitor of UGT2B7 (about 80% inhibition at 100 M), it also inhibited UGT 1A1, 1A3, 1A4, 1A9, 1A10, and 2B15. In contrast, androsterone activated UGT1A8 activity. Overall, these data demonstrate that amitriptyline, androsterone, canrenoic acid, quinidine, and quinine are nonselective UGT inhibitors and, thus, have little potential for UGT reaction phenotyping. However, the current findings indicate that the drugs listed above may potentially contribute to inhibitory interactions in vivo. It should be noted in this regard that glucuronidation kinetic parameters measured using human liver micro-
Downloaded from dmd.aspetjournals.org at ASPET Journals on August 22, 2017
FIG. 4. Representative Dixon plots for quinidine inhibition of zidovudine (AZT) glucuronidation by alamethicin-activated human liver microsomes (HL40; A) and UGT2B7 (B).
455
456
UCHAIPICHAT ET AL.
References Aarbakke J (1978) Clinical pharmacokinetics of phenylbutazone. Clin Pharmacokinet 3:369 – 380. Austin RP, Barton P, Cockroft SL, Wenlock MC, and Riley RJ (2002) The influence of nonspecific microsomal binding on apparent intrinsic clearance and its prediction from physicochemical properties. Drug Metab Dispos 30:1497–1503. Boase S and Miners JO (2002) In vitro-in vivo correlations for drugs eliminated by glucuronidation: investigations with the model substrate zidovudine. Br J Clin Pharmacol 54:493–503. Bowalgaha K, Elliot DJ, Mackenzie PI, Knights KM, Swedmark S, and Miners JO (2005) S-Naproxen and desmethylnaproxen glucuronidation by human liver microsomes and recombinant human UDP-glucuronosyltransferases (UGT): role of UGT2B7 in the elimination of naproxen. Br J Clin Pharmacol 60:423– 433. Clarke SE (1998) In vitro assessment of human cytochrome P450. Xenobiotica 28:1167–1202. Coffman BL, King CD, Rios GR, and Tephly TR (1998) The glucuronidation of opioids, other xenobiotics and androgens by human UGT2B7Y(268) and UGT2B7H(268). Drug Metab Dispos 26:73–77.
Court MH, Krishnaswamy S, Hao Q, Duan SX, Patten CJ, Von Moltke LL, and Greenblatt DJ (2003) Evaluation of 3⬘-azido-3⬘-deoxythymidine, morphine and codeine as probe substrates for UDP-glucuronosyltransferase 2B7 (UGT2B7) in human liver microsomes: specificity and influence of the UGT2B7*2 polymorphism. Drug Metab Dispos 31:1125–1133. Dieterle W, Faigle JW, Mory H, Richter WJ, and Theobald W (1975) Biotransformation and pharmacokinetics of sulfinpyrazone (Anturan) in man. Eur J Clin Pharmacol 9:135–145. Di Marco A, D’Antoni M, Attaccalite S, Carotenuto P, and Laufer R (2005) Determination of drug glucuronidation and UDP-glucuronosyltransferase selectivity using a 96-well radiometric assay. Drug Metab Dispos 33:812– 819. Egfjord M, Dahl HB, Kayser C, and Blaehr H (1999) Aldosterone metabolism in cultures of rat renal cortical and medullary cells. Scand J Clin Lab Investig 59:107–113. Gall WE, Zawada G, Mojarrabi B, Tephly TR, Green MD, Coffman BL, Mackenzie PI, and Radominska-Pandya A (1999) Differential glucuronidation of bile acids, androgens and estrogens by human UGT1A3 and 2B7. J Steroid Biochem Mol Biol 70:101–108. Ghosal A, Hapangama N, Yuan Y, Achanfuo-Yeboah J, Iannucci R, Chowdhury S, Alton K, Patrick JE, and Zbaida S (2004) Identification of human UDP-glucuronosyltransferase enzyme(s) responsible for the glucuronidation of posaconazole (Noxafil). Drug Metab Dispos 32:267–271. Green MD and Tephly TR (1996) Glucuronidation of amines and hydroxylated xenobiotics and endobiotics catalyzed by expressed human UGT1.4 protein. Drug Metab Dispos 24:356 –363. Houston JB and Kenworthy KE (2000) In vitro-in vivo scaling of CYP kinetic data not consistent with the classical Michaelis-Menten model. Drug Metab Dispos 28:246 –254. Jin CJ, Mackenzie PI, and Miners JO (1997) The regio- and stereo-selectivity of C19 and C21 hydroxysteroid glucuronidation by UGT2B7 and UGT2B11. Arch Biochem Biophys 341:207–211. Kharasch ED, Hoffer C, Whittington D, and Sheffels P (2003) Role of P-glycoprotein in the intestinal absorption and clinical effects of morphine. Clin Pharmacol Ther 74:543–554. Kirkwood LC, Nation RL, and Somogyi AA (1998) Glucuronidation of dihydrocodeine by human liver microsomes and the effect of inhibitors. Clin Exp Pharmacol Physiol 25:266 –270. Lowry OH, Rosebrough NJ, Farr AL, and Randall RL (1951) Protein measurement with the Folin phenol reagent. J Biol Chem 193:265–275. Mackenzie PI, Owens IS, Burchell B, Bock KW, Bairoch A, Belanger A, Fournel-Gigleux S, Green M, Hum DW, Iyanagi T, et al. (1997) The UDP glycosyltransferase gene superfamily: recommended nomenclature update based on evolutionary divergence. Pharmacogenetics 7:255–269. McLure JA, Miners JO, and Birkett DJ (2000) Nonspecific binding of drugs to human liver microsomes. Br J Clin Pharmacol 49:453– 461. Miners JO, Lillywhite KJ, Matthews AP, Jones ME, and Birkett DJ (1988) Kinetic and inhibitor studies of 4-methylumbelliferone and 1-naphthol glucuronidation in human liver microsomes. Biochem Pharmacol 37:665– 671. Miners JO and Mackenzie PI (1991) Drug glucuronidation in humans. Pharmacol Ther 51:347–369. Miners JO, Smith PA, Sorich MJ, McKinnon RA, and Mackenzie PI (2004) Predicting human drug glucuronidation parameters: application of in vitro and in silico modeling approaches. Annu Rev Pharmacol Toxicol 44:1–25. Miners JO, Veronese ME, and Birkett DJ (1994) In vitro approaches for the prediction of human drug metabolism. Annu Rep Med Chem 29:307–316. Mirghani RA, Hellgren U, Bertilsson L, Gustafsson LL, and Ericsson O (2003) Metabolism and elimination of quinine in healthy volunteers. Eur J Clin Pharmacol 59:423– 427. Obach RS (1999) Prediction of human clearance of twenty-nine drugs from hepatic microsomal intrinsic clearance data: an examination of in vitro half-life approach and nonspecific binding to microsomes. Drug Metab Dispos 27:1350 –1359. Radominska-Pandya A, Czernik PJ, Little JM, Battaglia E, and Mackenzie PI (1999) Structural and functional studies of UDP-glucuronosyltransferases. Drug Metab Rev 31:817– 899. Rajaonarison JF, Lacarelle B, Catalin J, Placidi M, and Rahmani R (1992) 3⬘-Azido-3⬘deoxythymidine drug interactions. Screening for inhibitors in human liver microsomes. Drug Metab Dispos 20:578 –584. Resetar A, Minick D, and Spector T (1991) Glucuronidation of 3⬘-azido-3⬘-deoxythymidine catalyzed by human liver UDP-glucuronosyltransferase. Significance of nucleoside hydrophobicity and inhibition by xenobiotics. Biochem Pharmacol 42:559 –568. Sorich MJ, Smith PA, McKinnon RA, and Miners JO (2002) Pharmacophore and quantitative structure activity relationship modelling of UDP-glucuronosyltransferase 1A1 (UGT1A1) substrates. Pharmacogenetics 12:635– 645. Stone AN, Mackenzie PI, Galetin A, Houston JB, and Miners JO (2003) Isoform selectivity and kinetics of morphine 3- and 6-glucuronidation by human udp-glucuronosyltransferases: evidence for atypical glucuronidation kinetics by UGT2B7 [erratum in Drug Metab Dispos (2003) 31:1541]. Drug Metab Dispos 31:1086 –1089. Tukey RH and Strassburg CP (2000) Human UDP-glucuronosyltransferases: metabolism, expression and disease. Annu Rev Pharmacol Toxicol 40:581– 616. Uchaipichat V, Mackenzie PI, Guo XH, Gardener-Stephen D, Galetin A, Houston JB, and Miners JO (2004) Human UDP-glucuronosyltransferases: isoform selectivity and kinetics of 4-methylumbelliferone and 1-naphthol glucuronidation, effects of organic solvents and inhibition by diclofenac and probenecid. Drug Metab Dispos 32:413– 423. Uchaipichat V, Winner LK, Mackenzie PI, Elliot DJ, Williams JA, and Miners JO (2006) Quantitative prediction of in vivo inhibitory interactions involving glucuronidated drugs from in vitro data: the effect of fluconazole on zidovudine glucuronidation. Br J Clin Pharmacol, in press. Venkatakrishnan K, Von Moltke LL, and Greenblatt DJ (2001) Human drug metabolism and the cytochromes P450: application and relevance of in vitro models. J Clin Pharmacol 41:1149–1179. Ventafridda V, Ripamonti C, De Conno F, Bianchi M, Pazzuconi F, and Panerai AE (1987) Antidepressants increase bioavailability of morphine in cancer patients. Lancet 1:1204. Woosley RL and Shand DG (1978) Pharmacokinetics of antiarrhythmic drugs. Am J Cardiol 41:986 –995. Yue Q, von Bahr C, Odar-Cederlof I, and Sawe J (1990) Glucuronidation of codeine and morphine in human liver and kidney microsomes: effect of inhibitors. Pharmacol Toxicol 66:221–226.
Address correspondence to: Professor John O. Miners, Department of Clinical Pharmacology, Flinders Medical Centre, Bedford Park, SA 5042, Australia. E-mail:
[email protected]
Downloaded from dmd.aspetjournals.org at ASPET Journals on August 22, 2017
somes as the enzyme source generally underpredict clearance and the extent of inhibitory interactions in vivo by an order of magnitude (Boase and Miners, 2002; Uchaipichat et al., 2005). For example, although the IC50 for amitriptyline inhibition of UGT2B7 measured here was relatively high (129 M), the AUC and elimination half-life of the UGT2B7 substrate morphine were reported to increase by 86% and 69%, respectively, in patients coadministered amitriptyline (50 mg/day) (Ventafridda et al., 1987). The inhibition kinetics of AZT glucuronidation, catalyzed by human liver microsomal and recombinant UGT2B7, by quinidine was further investigated. Quinidine is used as a P-glycoprotein inhibitor, and it has been reported recently (Kharasch et al., 2003) that quinidine increased the apparent oral clearance of morphine, a known selective substrate of UGT2B7 (Court et al., 2003; Stone et al., 2003). In the present study, quinidine competitively inhibited AZT glucuronidation by HLMs and UGT2B7, with respective Ki values of 335 and 186 M. Although these concentrations are higher than the quinidine therapeutic plasma concentration range (2–5 g/ml, equivalent to 6 –15 M) (Woosley and Shand, 1978), in vitro data tend to underestimate inhibition of drug glucuronidation in vivo (as noted above). Thus, inhibition of morphine first pass extraction may contribute, at least in part, to the quinidine-morphine interaction in vivo. The present study found that a methanol-soluble compound(s) in a particular brand of liquid scintillation glass vials was a highly selective inhibitor of UGT1A7. The samples from these and acid washed (as a control) glass vials were further analyzed using liquid chromatography/ mass spectrometry. Spectra from both samples were similar, except for the presence of polyethylene glycol (possibly used as a detergent in the production process) and three (as yet unidentified) compounds with mass to charge ratios of 294, 240, and 214. These observations provide a warning that some compounds present in glassware used for performing drug metabolism studies in vitro may inhibit enzyme activity. There is evidence for multiple substrate binding sites within the active site of a number of UGTs (Stone et al., 2003; Uchaipichat et al., 2004). To gain further insight into substrate-inhibitor interactions, the mechanism of phenylbutazone and quinine inhibition of UGT 1A1, 1A6, 1A7, 1A9, and 1A10 was investigated. Notably, phenylbutazone inhibition of UGT 1A7, 1A9, and 1A10 and quinine inhibition of UGT1A7 were best described by the noncompetitive model, which may suggest distinct binding sites for substrate and inhibitor in these enzymes. In summary, TFP was confirmed as a selective probe substrate of UGT1A4, whereas hecogenin was confirmed as a highly selective inhibitor on this enzyme. Thus, TFP and hecogenin represent useful tools for the reaction phenotyping of UGT1A4 substrates. There is a possibility that amitriptyline, canrenoic acid, phenylbutazone, quinidine, quinine, and sulfinpyrazone may inhibit the metabolism of coadministered glucuronidated drugs. In particular, quinidine also has the capacity to inhibit a number of human UGTs when used as a P-glycoprotein inhibitor in vivo.