November 1, 2010 / Vol. 35, No. 21 / OPTICS LETTERS
3649
Self-compression controlled by the chirp of the input pulse O. Varela,1,2,* B. Alonso,2 I. J. Sola,2 J. San Román,2 A. Zaïr,2 C. Méndez,1,2 and L. Roso1,2 1
2
Centro de Láseres Pulsados, CLPU, E-37008, Salamanca, Spain Departmento de Física Aplicada, Facultad de Ciencias, Universidad de Salamanca, E-37008, Salamanca, Spain *Corresponding author:
[email protected] Received July 28, 2010; revised October 2, 2010; accepted October 4, 2010; posted October 7, 2010 (Doc. ID 132483); published October 26, 2010
Self-compressed (SC) pulses have been achieved through the filamentation process in air without any additional dispersion compensation, using the input pulse chirp as the control parameter. For any studied input pulse energy (3–5 mJ), we have found two opposite sign input group-delay dispersion values for which SC pulses can be achieved systematically. In addition, we have observed that the energy coupled into the inner core of the filament is always of the order of 20% of the total input pulse energy, which opens the way to a scalable technique to obtain intense short pulses directly from the filamentation process. © 2010 Optical Society of America OCIS codes: 320.5520, 190.7110.
Filamentation in gases has been used over the past decade to achieve ultrashort pulses [1] as an alternative to the gas-filled hollow-fiber postcompression technique [2]. In practice, both schemes usually need additional systems to compensate for the residual output dispersion (gratings and chirped mirrors). However, theoretical studies have been carried out to find conditions to avoid this necessity of reaching the so-called self-compression regime and in order to provide more compact systems and maintain high throughput energies [3–7]. Nowadays, this self-compression regime is explained as an asymmetric temporal pulse splitting that occurs during collapse [6,7], in which the temporal delayed pulse takes most of the energy. Self-compressed (SC) pulses have been reported in experiments based on filamentation in gases [8–12] and also using a hollow fiber [13]. In most cases they have been obtained by adjusting conventional parameters such as the input energy and the pressure in the gas cell [8–10]. There are also recent works in which the input chirp influence on filamentation has been analyzed [1,14], where SC pulses have been observed for particular input chirped pulses [11,12], addressing the question of the input chirp implication on the selfcompression process. It is well known that the input chirp plays an important role in the filamentation process, because it changes the basic properties of the pulses, such as the temporal duration and the peak power, affecting the filament length or the number of refocusing events [15]. These results suggest that the input chirp could be used to control the output temporal pulse width obtained after nonlinear propagation. In this Letter we experimentally demonstrate that the input pulse group-delay dispersion (GDD) can be easily used to adjust the nonlinear interaction to obtain SC pulses after a self-guiding propagation in air. The experimental procedure consisted of measuring the output temporal structure while changing the input GDD for a fixed input energy. We used a Spectra-Physics CPA Ti:sapphire laser system delivering 9 nm spectral width pulses centered at 795 nm, corresponding to a Fourier-limited 100 fs pulse duration, at a repetition rate of 10 Hz and with energies up to 5 mJ after a 6 mm circular aperture selection. The same circular spatial selec0146-9592/10/213649-03$15.00/0
tion was done in all the experiments, achieving the most symmetric spatial energy distribution to optimize the selfguiding phenomenon and to avoid possible effects on the temporal output [16]. This selection was focused in air with a f ¼ 1:5 m lens. The input pulse energy was finely controlled with a half-wave plate and a linear polarizer located before the compressor. Finally, the GDD of the input pulses was adjusted by changing the distance between the gratings of the laser compressor. For each input energy–GDD case, we measured the temporal intensity and phase of the input pulses (with a 50–500 fs range SHG-FROG) and also the temporal profile of the central mode of the output beam generated (with a 10–40 fs range SPIDER, APE, Inc.). Following the criteria established in Zaïr et al. [17], SPIDER and output energy measurements was done at 3 m from the nominal focus, after inner core selection (around 3 mm diameter aperture) of the spatial mode, which was of excellent quality (see inset photographs in Figs. 1 and 2). Then, we did a systematic study on a broad range of input energy–GDD values, similarly to what was done in [18] studying the time domain behavior. Within this study, some particular energy–GDD combinations presented a dramatic temporal reduction of the output pulse duration, being quite close to their Fourier limits. As shown in Table 1, pulses of 20–30 fs temporal width, with an accuracy of 2–3 fs, were obtained for particular input GDD values in the range of 3–5 mJ. We obtained two opposite sign input GDD values (from the FROG measurements) for which SC pulses were achieved, maintaining 20% of energy transmission in the output selection. These two GDD values for each of the input pulse energy studied correspond to two different values of input peak power, one for the positive chirped pulse and the other for the negative. All the input pulse powers are in the range of 6–10 times the critical power as in air (3 GW). Also, it is important to remark that under a rigorous analysis, these output pulses are not fully Fourier limited, as shown in the fifth column of Table 1. The structures of the SC pulses for 3 and 5 mJ input energy are presented in Figs. 1 and 2, respectively. In each figure, subplots (a) and (b) show a comparison between the measured input temporal profile (blue dashed © 2010 Optical Society of America
3650
OPTICS LETTERS / Vol. 35, No. 21 / November 1, 2010
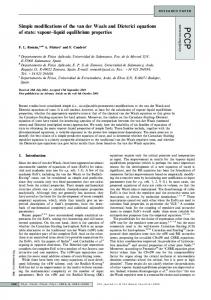
Fig. 1. (Color online) Temporal intensity profile of the input (blue dashed curve) and output (color shaded area) pulses measured for 3 mJ input energy: for (a) the positive input GDD case and (b) the negative input GDD. The different colors on the shaded area represent the different wavelengths (instantaneous wavelength), and the solid black curves represent the Fourier limit of the output pulse. The spatial output profile is shown in the inset for each case. Spectral intensity (solid curve) and phase (dashed curve) of the input [black (blue online)] and output [gray (red online)] pulses obtained for (c) the positive input GDD case and (d) the negative input GDD pulses.
curve), the SC output pulse (color shaded area), and its Fourier limit (black solid curve) for cases with positive and negative input GDD, respectively. The color-filled areas represent the instantaneous frequency of the SC pulses, calculated from the retrieved output spectral phase, with the color-wavelength equivalence shown in the top color bar. Subplots (c) and (d) represent the spectral intensity (solid curve) and phase (dashed curve) of the input [black curves (blue online)] and the output pulses [gray curves (red online)], for the positive and negative input GDD cases, respectively. As can be observed, both figures present very similar temporal and spectral structures, demonstrating that the input chirp is a very useful tuning parameter to achieve SC pulses. Moreover, although the use of a different sign of the input chirp produces changes on filamentation [15], our results show that a different input chirp sign does not prevent the achievement of the self-compression regime. On the other hand, we have found that different input pulse peak powers are necessary to obtain SC pulses depending on the input chirp sign, as we commented before. Also, small differences were observed between the SC pulses obtained for a different input chirp sign, as we will discuss later. The temporal structure of the SC pulses always consisted of a main temporal peak, very similar to its Fourier limit (Figs. 1 and 2). The instantaneous frequency obtained for the main temporal peak is slightly redshifted from the central wavelength of the input spectrum, and it is very close to the center of gravity of the output spectrum (see the sixth column of Table 1). A spiky structure of satellite pulses appeared before and after it, with the red frequencies in the front part of the pulse and the blue ones in the rear part, thus presenting a general positive GDD structure. To characterize this phase structure, we developed a complete study of the output spectral phases, revealing that high dispersion orders were playing an important role, while the GDD and third-order dispersion (TOD) were quasi-compensated.
In fact, a small variation of any of the coefficients obtained from the polynomial fit of the retrieved spectral phase yields a dramatic change in the temporal reconstruction, destroying the isolated temporal peak pulse structure. Therefore, a further compensation of the residual output phase would be very complicated using standard techniques of phase compensation owing to the importance of the later-mentioned high dispersion orders. Nevertheless, the temporal widths of the SC pulses were very close to their Fourier limits, resulting in a very short pulse in comparison with the input chirped pulses used. The reduction of the pulse durations was dramatic, with compression rates of 4–6 from the Fourier limit of the input pulses, and almost 10 from the real input chirped pulses. Our general conclusions are absolutely compatible with similar results reported in argon and discussed very recently by Akturk and co-workers, where the selfcompression of positive chirped input pulses was observed [12]. In general, SC pulses obtained in previous works in argon presented a general positive GDD structure with a main temporal peak composed by the bluish part of the spectrum close to the center of gravity of their blueshifted broadened spectra [9,12]. The different spectral composition between the SC pulses obtained in our experiment in air and those obtained in previous works in argon, the former being redshifted and the latter blueshifted, is related to the presence of the Raman–Kerr component in air. In fact, the most relevant spectral characteristic of our results is the presence of important modulations and a larger Raman redshift in the output spectra obtained. Very similar spectral structures were obtained recently in previous studies of the self-focusing effect in air [19], which reveals that self-phase modulation dominates the spectral broadening over plasma effect in our self-compression process. In addition, our results confirm the delayed Raman effect as the dominant air nonlinearity for pulses >100 fs [20], determining the frequency composition of the SC pulses.
Fig. 2. (Color online) Same plots as in Fig. 1 for an input pulse with 5 mJ energy.
November 1, 2010 / Vol. 35, No. 21 / OPTICS LETTERS Table 1. Parameters of the Input Chirped Pulses and the Output Measured Pulsesa Input Pulses
Output Pulses
E in (mJ)
GDD (fs2 )
Δt (fs)
P (GW)
3
1842 −2405 821 −3694 1778 −4011
161 170 122 246 153 240
18.6 17.6 32.7 16.2 33.1 20.1
4 5
Δt (fs) (FT) 24 28 21 26 22 25
(18) (20) (16) (20) (13) (18)
λ (nm)b 818 811 813 813 814 809
(810) (813) (815) (820) (815) (817)
E out (mJ) 0.6 0.8 1
a GDD (second column) corresponds to the second coefficient of a polynomial phase fit of the input SHG-FROG measurements. FT (fifth column) is the Fourier transform limit of the output measured pulses to be compared to the real temporal width measurements. Δt in the third and sixth columns is the temporal duration of the pulses (FWHM). b Left and right columns represent the center of gravity of the output spectrum and the central wavelength λ of the main temporal peak (shown inside parentheses), respectively.
The main difference between the results observed with opposite signs of the input chirp can be noted in the slightly less spectral broadening obtained with negative than with positive GDD, in agreement with the observations reported by Park et al. [14]. The positive chirping nature of the Kerr effect contributes to increased spectral broadening for positive chirped pulses. Nevertheless, contrary to the conclusions exposed in the work cited before, we found similar output pulse widths with an identical temporal structure for both signs of the input GDD, suggesting that the self-compression mechanism is basically the same, being feasible to achieve similar SC pulses for positive and negative input GDD. The lower compression rate for negative input GDD pulses reported by Park and co-workers could be explained owing to the use of shorter input pulses, for which the control of the input GDD is much more difficult. In addition, the input GDD values used by Park were the same for both signs of the input chirp, while our results show that the best SC pulse appeared for larger absolute values of negative GDD than for the positive cases. Moreover, we should mention that for all the input energies studied, the positive input chirp cases appeared at higher input peak powers, which also affects the spectral broadening. Finally, we should comment again that this technique is limited to pulses with a quite Gaussian spectrum profile and low enough TOD, for which a change of the input GDD only induces a change on the temporal width of the pulses and not on the structure of the temporal profile. In conclusion, we have demonstrated that the input chirp can be used to tailor nonlinear propagation to achieve ultrashort SC pulses through filamentation in air. For a fixed input energy, we have found two opposite sign input chirp values that allow us to obtain the SC pulses, demonstrating that although the sign of the input chirp produces changes in the properties of both the input and output SC pulses, it does not prevent us from reaching the self-compression regime. Moreover, all the SC pulses maintained 20% of the input energy coupled
3651
into the single filament mode, opening the possibility for extending this technique to higher energies. In addition, a complete analysis of the instantaneous wavelength structure shows that the SC pulses presented a positive chirp nature. An analysis of the residual output phase revealed the existence of high dispersion orders that could make difficult a further compression using standard phase compensation systems. We acknowledge support from the Centro de Láseres Pulsados, the Spanish Ministerio de Ciencia e Innovación (MICINN) through the Consolider Program SAUUL (CSD2007-00013), research project FIS2009-09522 from Junta de Castilla y León through the Program for Groups of Excellence (GR27), and from the European Commission Seventh Framework Program (LASERLABEUROPE, grant 228334). I. J. S. acknowledges the support of the “Ramon y Cajal” grant program from the Spanish MICINN. We acknowledge the L. Bañares group for lending us the SHG-FROG. References 1. C. P. Hauri, A. Guandalini, P. Eckle, W. Kornelis, J. Biegert, and U. Keller, Opt. Express 13, 7541 (2005). 2. M. Nisoli, S. De Silvestri, and O. Svelto, Appl. Phys. Lett. 68, 2793 (1996). 3. L. Berge and A. Couairon, Phys. Rev. Lett. 86, 1003 (2001). 4. A. Couairon, M. Franco, A. Mysyrowicz, J. Biegert, and U. Keller, Opt. Lett. 30, 2657 (2005). 5. L. Berge and S. Skupin, Phys. Rev. Lett. 100, 113902 (2008). 6. M. Mlejnek, E. M. Wright, and J. V. Moloney, Opt. Lett. 23, 382 (1998). 7. C. Brée, A. Demircan, S. Skupin, L. Berge, and G. Steinmeyer, Opt. Express 17, 16429 (2009). 8. G. Stibenz, N. Zhavoronkov, and G. Steinmeyer, Opt. Lett. 31, 274 (2006). 9. S. Skupin, G. Stibenz, L. Berge, F. Lederer, T. Sokollik, M. Schnürer, N. Zhavoronkov, and G. Steinmeyer, Phys. Rev. E 74, 056604 (2006). 10. E. Schulz, T. Binhammer, D. S. Steingrube, S. Rausch, M. Kovacev, and U. Morgner, Appl. Phys. B 95, 269 (2009). 11. J. Liu, X. Chen, J. Liu, Y. Zhu, Y. Leng, J. Dai, R. Li, and Z. Xu, Opt. Express 14, 979 (2006). 12. S. Akturk, A. Couairon, M. Franco, and A. Mysyrowicz, Opt. Express 16, 17626 (2008). 13. N. L. Wagner, E. A. Gibson, T. Popmintchev, I. P. Christov, M. M. Murnane, and H. C. Kapteyn, Phys. Rev. Lett. 93, 173902 (2004). 14. J. Park, J.-H. Lee, and C. H. Nam, Opt. Express 16, 4465 (2008). 15. J. I. S. Golubtsov, V. P. Kandidov, and O. G. Kosareva, Quantum Electron. 33, 525 (2003). 16. N. Zhavoronkov, J. Opt. A 11, 125201 (2009). 17. A. Zaïr, A. Guandalini, F. Schapper, M. Holler, J. Biegert, L. Gallmann, A. Couairon, M. Franco, A. Mysyrowicz, and U. Keller, Opt. Express 15, 5394 (2008). 18. B. Alonso, O. Varela, I. J. Sola, J. San Román, A. Zaïr, C. Méndez, and L. Roso, Appl. Phys. B 101, 15 (2010). 19. A. C. Bernstein, J.-C. Diels, T. S. Luk, T. R. Nelson, A. McPherson, and S. M. Cameron, Opt. Lett. 28, 2354 (2003). 20. S. Varma, Y.-H. Chen, and H. M. Milchberg, Phys. Rev. Lett. 101, 205001 (2008).