Robotics and Autonomous Systems 60 (2012) 1377–1388
Contents lists available at SciVerse ScienceDirect
Robotics and Autonomous Systems journal homepage: www.elsevier.com/locate/robot
Self-learning classification of radar features for scene understanding Giulio Reina a,∗ , Annalisa Milella b , James Underwood c a
University of Salento, Department of Engineering for Innovation, via Arnesano, I-73100 Lecce, Italy
b
Institute of Intelligent Systems for Automation, National Research Council, via G. Amendola 122/D, I-70126 Bari, Italy
c
Australian Centre for Field Robotics, University of Sydney, Rose Street Building (J04), Sydney, NSW 2006, Australia
article
info
Article history: Available online 4 April 2012 Keywords: Field robotics Radar-based perception Self-learning classifier
abstract Autonomous driving is a challenging problem in mobile robotics, particularly when the domain is unstructured, as in an outdoor setting. In addition, field scenarios are often characterized by low visibility as well, due to changes in lighting conditions, weather phenomena including fog, rain, snow and hail, or the presence of dust clouds and smoke. Thus, advanced perception systems are primarily required for an off-road robot to sense and understand its environment recognizing artificial and natural structures, topology, vegetation and paths, while ensuring, at the same time, robustness under compromised visibility. In this paper the use of millimeter-wave radar is proposed as a possible solution for allweather off-road perception. A self-learning approach is developed to train a classifier for radar image interpretation and autonomous navigation. The proposed classifier features two main stages: an adaptive training stage and a classification stage. During the training stage, the system automatically learns to associate the appearance of radar data with class labels. Then, it makes predictions based on past observations. The training set is continuously updated online using the latest radar readings, thus making it feasible to use the system for long range and long duration navigation, over changing environments. Experimental results, obtained with an unmanned ground vehicle operating in a rural environment, are presented to validate this approach. A quantitative comparison with laser data is also included showing good range accuracy and mapping ability as well. Finally, conclusions are drawn on the utility of millimeter-wave radar as a robotic sensor for persistent and accurate perception in natural scenarios. © 2012 Elsevier B.V. All rights reserved.
1. Introduction Research in mobile robotics aims to develop technologies that allow vehicles to travel longer distances with limited human supervision. If robotic vehicles could reliably and robustly drive through unknown terrain toward a given location, the implications would be of great importance for many applications including exploration and reconnaissance (both on Earth and extra-terrestrially), search and rescue operations, and driving safety (e.g., development of automatic obstacle avoidance systems). Some notable examples can be found in the literature. On Mars, two robotic rovers have been exploring and collecting data since 2004. The Mars Rovers, however, are carefully monitored and controlled; they cannot be considered as fully autonomous [1]. Another prominent example is the 2005 DARPA Grand Challenge [2], which featured fully autonomous vehicles racing over a 212-km desert course. Nevertheless, the Grand Challenge required vehicles to drive autonomously from waypoint to waypoint along a desert
∗
Corresponding author. E-mail address:
[email protected] (G. Reina).
0921-8890/$ – see front matter © 2012 Elsevier B.V. All rights reserved. doi:10.1016/j.robot.2012.03.002
road: an arguably easier task than off-road navigation through arbitrary terrain. Although autonomous navigation has inspired decades of research, it still remains an open and active field of investigation. One of the critical challenges is accurate and robust scene understanding to perform many important tasks, including environment segmentation and classification, mapping and identification of terrain regions that can be safely traversed. One additional problem connected with autonomy in field scenarios is that visibility conditions are often poor. Day/night cycles change illumination conditions. Weather phenomena such as fog, rain, snow and hail impede visual perception. Dust clouds rise in excavation sites, and agricultural fields, and they are expected during planetary exploration. Smoke also compromises visibility in fire emergencies and disaster sites. Laser and vision are common imaging techniques affected by these conditions [3]. Sonar is not affected by visibility restrictions. However, it is considered of limited utility for field robots due to high atmospheric attenuation, noise, and reflections by specular surfaces. While laser scanners and cameras may have difficulties sensing in dusty environments, radar operates at a wavelength that penetrates dust and other visual obscurants and it can be successfully used as a complementary sensor to conventional range devices. Furthermore, radar can provide information
1378
G. Reina et al. / Robotics and Autonomous Systems 60 (2012) 1377–1388
of distributed and multiple targets that appear in a single observation, whereas other range sensors are generally limited to one target return per emission, although multi-peak and last-peak-based lasers solve this problem to some extent, and are becoming more common. Nevertheless, radar has shortcomings as well, such as large footprint, specularity effects, and limited range resolution, all of which may result in poor environmental survey or difficulty in interpretation. In this research, we propose the use of millimeterwave (MMW) radar for accurate and persistent perception of the environment. Scene understanding has been one of the goals of imaging sensor systems in general and particularly of computer vision for decades. Recently, the application of statistical learning has given rise to new interest in this field [4]. Statistically trained models have an advantage over deterministic, hand-tuned systems, especially when the complexity of the model exceeds the capabilities of human experts, as is the case with robust scene analysis. This paper presents an adaptive self-learning classifier using radar data. First, the system automatically learns to associate the appearance of radar data with class labels during a training stage. Then, it makes predictions based on past observations classifying new data into two broad categories, namely ground and non-ground. The ground class corresponds to returns from the terrain, whereas the non-ground class corresponds to all other returns, including sensor misreading and reflections from above-ground objects (i.e., obstacles) or from occluded areas. Since the characteristics of the ground may change geographically and over time, the system is continuously retrained in every scan: new automatically labeled data are added to the ground model replacing the oldest labels in order to incorporate changes in the ground appearance. The radar-based classifier leads to the following main advantages: (a) enabling technology for all visibility-condition navigation systems, (b) self-learning training of the classifier, where the radar allows the vehicle to automatically acquire a set of ground samples, eliminating the need for time-consuming manual labeling, (c) continuous updating of the system during the vehicle’s operation, thus making it adaptive and feasible for long range and long duration navigation applications, and (d) accuracy improvement in range estimation for enhanced environment mapping. In this investigation, a mechanically scanned MMW radar, designed for perception and navigation in low visibility conditions, is employed. Although the sensor is custom built at the Australian Centre for Field Robotics (ACFR), it is similar in performance to other commercially available systems.1 It is a 95-GHz frequencymodulated continuous wave (FMCW) MMW radar that reports the amplitude of echoes at ranges between 1 and 120 m. The wavelength is λ = 3 mm, and the 3-dB beamwidth is about 3.0 deg in elevation and azimuth. The antenna scans across the angular range of 360 deg at a scan frequency of about 3 Hz. The range raw resolution is about 0.32 m at 20 m [5]. The radar is integrated with the CAS Outdoor Research Demonstrator (CORD): an eightwheel, skid-steering all-terrain unmanned ground vehicle (UGV) (see Fig. 1), which has been employed for the testing and the field validation of the system. The robot’s sensor suite is completed by four 2D SICK laser range scanners, a mono-charge-coupled device (CCD) color camera, a thermal infrared camera, and a real-time kinematic/differential global positioning system/ inertial navigation system (RTK DGPS/INS) unit that provides accurate pose estimation of the vehicle. The remainder of the paper is organized as follows. Section 2 reports related research in the field, whereas basic principles of radar sensing are recalled in Section 3. The proposed radar-based classifier is described in detail in Section 4. In Section 5, the system is validated in field tests performed with the CORD UGV. Section 6 concludes this paper.
1 For example, http://www.nav-tech.com/Industrial%20Sensors2.htm.
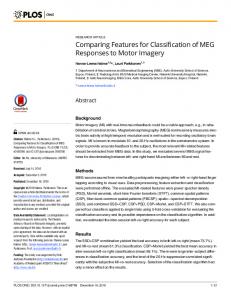
Fig. 1. The CORD UGV employed in this research. The sensor suite is visible, attached to a rigid frame.
2. Previous work Considerable progress has been made in recent years in designing autonomous, navigation systems for unstructured environments [6]. Progress has also been made in high-level scene analysis systems [7,8]. In this section, research is organized by its learning strategy: deterministic (no learning), supervised, and self-supervised. Estimating the traversability of the surrounding terrain constitutes an important part of the navigation problem, and deterministic solutions have been proposed by many, [9–11], where some features of the terrain including slope, roughness, or discontinuities are analyzed to segment the traversable regions from the obstacles. In addition, some visual cues such as color, shape and height above the ground have also been employed for segmentation in [12,13]. However, these techniques assume that the characteristics of obstacles and traversable regions are fixed, and therefore they cannot easily adapt to changing environments. Without learning, such systems are constrained to a limited range of predefined environments. A number of systems that incorporate supervised learning methods have also been proposed, many of them in the automotive field and for structured environments (road-following). These include ALVINN (Autonomous Land Vehicle in a Neural Network) by Pomerlau [14], MANIAC (Multiple ALVINN Network In Autonomous Control) by Jochem et al. [13], and the system proposed by LeCun et al. [15]. ALVINN trained a neural network to follow roads and was successfully deployed at highway speed in light traffic. MANIAC was also a neural net-based road-following navigation system. LeCun used end-to-end learning to map visual input to steering angles, producing a system that could avoid obstacles in off-road settings, but did not have the capability to navigate to a goal or map its surroundings. Many other systems have been proposed in recent years that include supervised classification [16,17]. These systems were trained offline using hand-labeled data, thus limiting the scope of their expertise to environments seen during training. Dima et al. [18] recognized this problem and proposed using active learning to limit the amount of labeled data in a mobile robot navigation system. Only recently, selfsupervised systems have been developed that reduce or eliminate the need for hand-labeled training data, thus gaining flexibility in unknown environments. With self-supervision, a reliable module that determines traversability can provide labels for inputs to another classifier. Using this paradigm, a classifier can be trained online using data from the reliable sensor (such as laser or vision). An example can be found in Milella et al. [19], where a visual classifier was trained by radar-driven labels. Brooks and
G. Reina et al. / Robotics and Autonomous Systems 60 (2012) 1377–1388
Iagnemma [20] proposed a self-supervised framework that predicts the mechanical properties of distant terrain based on a previously-learned association with visual appearance. Selfsupervised learning helped win the 2005 DARPA Grand Challenge: the winning approach used a probabilistic model to identify road surface based on color information extracted immediately ahead of the vehicle as it drives [2]. Stavens and Thrun [21] used self-supervision to train a terrain roughness predictor. An online self-supervised learning was used to train a lidarbased navigation system to predict the location of a loadbearing surface in the presence of vegetation [22]. Recently Kim et al. [23] proposed an autonomous off-road navigation system that estimates traversability in an unstructured, unknown outdoor environment. In this paper, a self-learning classifier using radar features is proposed for scene segmentation. A set of radar features for ground identification is introduced; then, these features are used to classify the scene into ground and non-ground regions. In order to automatically train the classifier, a self-learning approach is adopted, where the system is able to construct the ground model, using radar information only. A ground model updating procedure is also implemented to continuously re-train the classifier, so that variations in ground type and appearance can be taken into account. While a lot of work has been done in the context of scene classification using laser and vision systems, relatively limited research has been devoted to investigate explicitly millimeterwave radar for short-range perception and three-dimensional terrain mapping. For example, in previous research a millimeterwave radar-based navigation system detected and matched artificial beacons for localization in a two-dimensional scan [24]. Pulsed radar with a narrow beam and high sampling rate produced dense three-dimensional terrain maps [25]. However, the resulting sensor size is excessive for most robotic applications. Millimeterwave radar has been used on a large AGV for cargo handling [26]; the radar is scanned horizontally, and measures range and bearing to a set of trihedral aluminum reflectors. The reflectors may be covered by a polarizing grating to enable discrimination from other objects. Radar capability was demonstrated in an Arctic environment [27] and for mining applications [28]. Mullane et al. [29] used a MMW radar for occupancy mapping within a probabilistic framework. The ability of radar to perceive the environment in low visibility conditions was demonstrated in numerous papers, for example in [30,31]. This aspect is not explicitly considered in the context of this paper. 3. Radar-based perception Current development of short range radar imaging is an active research area. MMW radar scanning is generally performed mechanically in 2D sweeps with a resolution that is typically limited to 1–3 deg in azimuth and elevation, and 0.25 m in range, as determined by the antenna aperture and available bandwidth. Higher angular resolution can only be obtained with inconveniently large antenna apertures, and downrange resolution has hardware limitations, although interpolation techniques have been applied to improve it for point targets. This makes it difficult to generate elevation maps since objects of different heights are illuminated at the same time and it prevents the use of geometric or shape algorithms, such as those commonly used with lasers. In general, the ‘‘alternate’’ image of the scene provided by the radar may be difficult to interpret because its modality, resolution, and perspective are very different from visual images. Furthermore, radar propagation to some extent and particularly scattering is different from those of optical-based sensors, such as laser, stereo, or sonar; thus existing sensor models are inadequate. For example,
1379
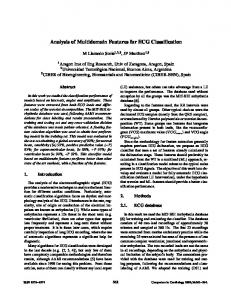
Fig. 2. A millimeter-wave radar mounted on a robot with a fixed nodding angle can be used to survey the surrounding environment.
laser sensors most commonly return the range to the first, last or highest intensity target detected along the beam. Due to the highly collimated beam emission, this corresponds to a small, precisely located region of occupied space in the environment. In contrast, radar provides the reflected power amplitude along the beam, i.e., a single return contains information from multiple targets, mainly due to the wider beamwidth (about 2–3 deg compared with 0.1 deg for the laser). Due to the larger beamwidth, radar returns must be interpreted as arising from the interaction of the beam with a finite but relatively large region of the environment. Returned images represent the convolution of the environment with the emission, so it is more complicated to infer the structure of the environment from the return. In the proposed configuration, the radar is directed at the front of the vehicle with a constant nodding angle to produce a grazing angle γ of about 11 deg, so that the center of the beam intersects the ground at a look-ahead distance of approximately 11.4 m in front of the vehicle, as shown in the explanatory scheme of Fig. 2. The origin of the beam at the center of the antenna is O. The proximal and distal borders of the footprint area illuminated by the divergence beam are denoted with A and B, respectively. The height of the beam origin with respect to the ground plane is h, the slant range of the radar bore sight is R0 , and the scan angle is α . In such a configuration, with a single sweep of 360 deg, the sensor produces an intensity map or radar image of the environment in front of the robot. As an example, a radar image, acquired from a large, relatively flat area, is shown in Fig. 3. The abscissas in Fig. 3(a) represent the scan angle with an effective horizontal field of view (HFOV) of about 120 deg. The ordinates represent the range measured by the sensor. Amplitude values above the noise level suggest the presence of objects with significant reflectivity or radar cross section, e.g. a large object that is not very reflective such as the ground will show up, or a small highly reflective object such as a corner reflector will also show up. Amplitude close to or below the noise level generally corresponds to the absence of objects. In this configuration, a radar image can be thought of as composed of a foreground and a background. The background is produced by the ground echo, i.e., the intensity return scattered back from the portion of terrain that is illuminated by the sensor beam. The ground echo typically appears as a high-intensity parabolic sector (see Fig. 3(a)). Radar observations belonging to the background show a wide pulse produced by the high incident angle to the surface. Conversely, obstacles present in the foreground appear as high-intensity narrow pulses. The ability to automatically identify radar data pertaining to the ground and to obstacles present in a scene and project them onto the vehicle
1380
G. Reina et al. / Robotics and Autonomous Systems 60 (2012) 1377–1388
Fig. 3. A sample radar image acquired from a large, flat area: scan angle-range image (a). Camera image approximately colocated with the radar (b). Note the rich information content of the radar map due to its ability to sample reflectivity at multiple ranges for a single scan angle. Please refer to the online version of the paper for a color view of the radar image.
Fig. 4. Simulated power return of the ground echo for a given scan angle: the following parameters were adopted in the simulation: k = 70 dB, R0 = 11.3 m, h = 2.2 m, γ = 11 deg.
body frame would result in an enabling technology for all visibilitycondition navigation systems. In previous research by the authors, a theoretical physics-based model of the ground echo was developed along with a method to automatically extract the background from radar images based on an edge-detection strategy. Following this approach, the portion of the radar signal acquired at a given scan angle pertaining to the background can be isolated and compared against the theoretical model to assess its membership confidence to the ground or nonground class, as explained later in the paper. We recall the important properties of the model and refer the reader to [31] for more details. The power return of the ground echo for a given scan angle can be expressed as a function of the range R Pr (R) = k
G(R, R0 )
2
cos γ
(1)
where k is a constant quantity, R0 is the slant range, G is the antenna gain (usually modeled as Gaussian) and γ is the grazing angle, as explained in Fig. 2. Fig. 4 shows a simulated wide pulse of the ground return using (1). 4. Self-learning classification In the following, ‘‘self-learning classification’’ refers to automatic training of a radar-based ground classifier. Whereas in a traditional (i.e. manually) supervised classifier a human user provides labeled training examples for each class of interest, in a self-learning framework these training examples are automatically
produced. In the context of this paper, a self-learning approach is proposed based on a rolling training set. The training set is automatically initialized at the beginning of the robot’s operation via a bootstrapping approach and progressively updated. In every newly-acquired radar scan, the latest training set is used to train the classifier. The task is that of generalizing from training data to unseen situations to identify single new observations as ground or non-ground. Initially, the rover has no knowledge of the relationship between ground appearance and the ground class. The only underlying assumption to initialize the training set is that the vehicle starts its operation from an area free of obstacles, so that the radar initially ‘‘looks’’ at ground only. Features can be extracted from background returns and associated with the ground class. Pairs of ground class labels and associated radar features are stored in memory. When sufficient data is accumulated, the radarbased ground classifier can be trained, and ground labels are related with radar properties. This allows the system to predict the presence of ground in successive scenes based on past observations. Such a classification task is generally difficult as the ground echo is affected by a number of factors that are not easily measured and change over time, including the type of terrain surface, topology, etc. This suggests that an adaptive approach is necessary in which the image interpretation changes as the vehicle moves and conditions vary. To this aim, the model (i.e., the training set) is continuously updated using the most recent radar readings. Selflearning systems eliminate the need for hand-labeled training data, thus gaining flexibility in unknown environments. Not only is the burden of hand-labeling data relieved, but the system can robustly adapt to changing environments on-the-fly. 4.1. Radar features The appearance of ground is constructed upon a set of intensity and shape features that are obtained by fitting the ground model expressed by Eq. (1) to radar data. The underlying hypothesis is that a good match between the parametric model and the experimental data attests to a high likelihood of ground. Conversely, a poor goodness of fit suggests low likelihood due, for example, to the presence of an obstacle, or highly irregular or occluded terrain. We recall that Pr (R) is a function defined by the parameters R0 and k. k can be interpreted as the power return at the slant range R0 and it is chosen as the first feature defining the ground appearance. Both parameters R0 and k can be estimated by data fitting for the given scan angle. A non-linear least squares approach using the Gauss–Newton–Marquardt method is adopted for data fitting. Output from the fitting process are the updated parameters R0 and k, as well as an estimate of the goodness of fit. The coefficient of efficiency was found to be well suited for this application [32], and
G. Reina et al. / Robotics and Autonomous Systems 60 (2012) 1377–1388
1381
Fig. 5. Feature generation by model fitting: (a) good fit with high confidence in ground, (b) poor fit with low confidence in ground, (c) seemingly good fit with a high value of shape factor.
it is chosen as the second feature for our model
(t − y)2 E =1− (t − t¯)2
(2)
t being the data point, t¯ the mean of the observations, and y the output from the regression model. E ranges from −∞ to 1, as the best possible value. Typical results are shown in Fig. 5. Specifically, in Fig. 5(a), the model matches very well the experimental data with a high coefficient of efficiency E = 0.98 and k = 74.89 dB, thus attesting to high confidence of ground. Conversely, Fig. 5(b) shows an example where the goodness of fit is poor (E < 0); for this case a low confidence in ground echo is expected. Nevertheless, relying on these two features only may be misleading in some cases. Fig. 5(c) shows an example where a radar observation appears as a ground label due to the high coefficient of efficiency (E = 0.91), when there is actually no ground return. In order to solve this issue, a shape factor can be defined as
I0 − Iend I
S =
(3)
0
where I0 and Iend are the initial and final intensity value of the ground echo. Our hypothesis is that a normal ground echo should have similar initial and final intensities due to the physical interaction between the radar emission and the ground. A high value of S (for example S = 80.7% in Fig. 5(c)) indicates a discrepancy and suggests low confidence that the signal is an actual ground echo. In summary, three main features define the ground model: the intensity associated with the slant range, k, the goodness of fit, E,
and the shape factor, S. This set of features expresses our physical understanding of the problem and we believe that it is a good descriptor of the ground appearance. However, this feature set is not unique and new features may be conceived and implemented to further improve the model. In previous work [33], similar features were used in a form of logical ‘‘expert system’’, with manually tuned thresholds to classify ground returns. In this work, they are used within a self-learning classification framework. 4.2. Algorithm description The ground modeling problem is formulated as a one-class classifier [34]. One-class classification techniques are particularly useful in the case of two-class classification problems where one class, referred to as the target class, is well-sampled, while the other class, named the outlier class, is under-samples or difficult to model. This is the case for our application where most of the radar background readings are reflected by ground with sparse instances of non-ground. Typically, the objective of a one classclassifier is that of constructing a decision boundary that separates the instances of the target class from all other possible objects. In our case, ground samples constitute the target class, while nonground samples are regarded as the outlier class. Nevertheless, in open rural environments non-ground samples are typically sparse; in addition, the variation of all possible non-ground classes is unlimited. That makes it difficult to model the non-ground class, whereas, although it changes geographically and over time, the ground class is generally less variable than random objects. Furthermore, our objective is that of building a model of the ground. Therefore, it is reasonable to formulate the problem as a distribution modeling one, where the distribution to estimate is
1382
G. Reina et al. / Robotics and Autonomous Systems 60 (2012) 1377–1388
the ground class. Specifically, we adopt a multivariate Gaussian distribution to model positive ground samples. A Mahalanobis distance-based classifier [35] can be applied to estimate the membership likelihood of a given observation to the ground class following an outlier detection strategy. Looking at the Mahalanobis distance (MhD) and its distribution, it is possible to predict if this radar reading has an extremely low probability of belonging to ground and may be suspected to be an outlier. Let Xt be an n × m data table representing a sample of xi vectors with i = 1, 2, . . . , n, each characterized by m traits (scalar features, m = 3 in our case): Xt = {x1 , . . . , xn }. These vectors constitute the training set at a given time t. If we compute the sample mean µt and the sample covariance Σt of the data in Xt , we can denote the ground model at this time as Mt (µt , Σt ), where µt describes the location, and Σt the scale (shape) of the distribution. Then, in the next radar scan acquired at time t + 1, the single new observation z can be classified by estimating its squared Mahalanobis distance from the ground model: Fig. 6. Output of the radar-based classifier for a sample scan.
d2 = (z − µt )Σt−1 (z − µt )t .
(4)
Assuming that the vectors xi are independent and have Gaussian distribution, it can be proved that the squared Mahalanobis distance is asymptotically distributed as the m degrees of freedom chi-square distribution χm2 . Then, we can use the quantile β of the m degrees of freedom chi-square distribution as the delimiter (cutoff) for outlying observations. Let β denote a constant probability level: 0 < β < 1. Let us denote χm2 ;β the appropriate quantile of the distribution. Then, it holds p(d2 ≥ χm2 ;β ) = 1 − β
(5) 2
which means that values of d greater than (or equal to) the value
χm2 ;β appear with a probability equal to 1 − β . Now we define the cutoff for the Mahalonobis distance as Lβ =
χm2 ;β .
(6)
Any radar observation with Mahalanobis distance d satisfying the inequality d ≥ Lβ may be suspected to be an outlier. In other words, the pattern is an outlier, i.e. defined as a non-ground observation, if d2 is greater than a threshold, which is computed as the β quantile χm2 ;β of the m degrees of freedom chi-square distribution. At the beginning of the robot’s operation, the training set is initialized under the assumption that the vehicle starts from an area free of obstacles, so that the radar ‘‘looks’’ at ground only. Successively, the ground model is updated as the vehicle moves: new ground feature vectors labeled in the most recent radar scans are incorporated, replacing an equal number of the oldest ground instances. The size of the rolling window is kept constant (i.e., n = 250 in our case). If we denote with Zt +1 = {z1 , z2 , . . . , zl } the set of l ground-labeled returns classified at time t + 1, then the training set for the next radar scan is obtained as Xt +1 = {(xl+1 , . . . , xn ), Zt +1 }.
(7)
As an example, Fig. 6 shows how the classifier works in a sample radar scan where we assume β = 0.992. The model of ground appearance is built upon the most recent rolling training set (marked by black dots) and represented in Fig. 6 by a gray Gaussian ellipsoid. The radar returns acquired in the current scan are classified based on their MhD. Outlined circles denote groundlabeled readings; non-ground labels are denoted by black crosses. Note that for the reader’s sake, only the plane E − k of the 3D feature space is shown. 5. Experimental results In this section, experimental results are presented to validate our approach for scene segmentation using radar data. The system was integrated with the CORD UGV (see Fig. 1) and tested in
Fig. 7. Aerial view of the Marulan test field with overlaid path followed by the UGV during the experiment.
a rural environment at the University of Sydney’s test facility near Marulan, NSW, Australia. Fig. 7 shows a low resolution aerial view of the test field featuring three wooden buildings: one long building stands on the southern side, whereas two smaller ones are on the northern side of the area. Two stationary cars are also present on the eastern side and south-western side, respectively. The whole area is bounded by a fence and is characterized by relatively flat ground with sparse low grass. During the experiment, the CORD vehicle was remotely driven with an average speed of about 0.5 m/s and a maximum value of 1.5 m/s. Variable yaw rates were achieved with a maximum of 1.12 rad/s (64 deg/s) and roll and pitch angles of up to 4 deg. The RTK DGPS/INS unit and a high-precision 2D SICK laser range scanner provided the ground truth with an average standard deviation per point of approximately 0.053 m (more details can be found in [36]). The full data set is public and available online [37]. The path followed by the robot is overlaid over the aerial image of Fig. 7 as estimated by the onboard RTK DGPS-INS unit. It resulted in a total distance of 170 m traveled in about 5 min. 5.1. Scene segmentation Figs. 8–12 show some typical results obtained from the classifier during the experiment. It should be noted that the system is conceived to classify data that belong to the radar image background. In addition, obstacles present in the foreground can also be detected and ranged independently as high-intensity peaks. Fig. 8 refers to the bootstrapping process during which the ground model is initialized. The robot starts its operations from an area
G. Reina et al. / Robotics and Autonomous Systems 60 (2012) 1377–1388
1383
b
a
c
Fig. 8. Bootstrapping process to build the initial model of the ground class: (a) training examples in the radar image marked by black points (green points in the online version of the paper), (b) projected over the camera image, (c) and on the laser-generated map. Note that in this stage the HFOV of the radar is reduced to 90 deg to enforce the assumption of returns scattered back from the ground. (For interpretation of the references to colour in this figure legend, the reader is referred to the web version of this article.)
Fig. 9. Results obtained from the radar-based classifier for a scenario delimited by two lateral buildings and a frontal car: (a) output of the system, (b) results overlaid on the camera image, (c) and on the laser-generated ground-truth map. Note that the map is referred to the vehicle reference frame. Black (green) dot: classified ground. Black cross: classified non-ground. Black (red) triangle: foreground obstacle. (For interpretation of the references to colour in this figure legend, the reader is referred to the web version of this article.)
1384
G. Reina et al. / Robotics and Autonomous Systems 60 (2012) 1377–1388
Fig. 10. Results obtained from the radar-based classifier for a scenario where the robot faces the long wooden building: (a) output of the system, (b) results overlaid on the camera image, (c) and on the laser-generated ground-truth map. Black cross: classified non-ground. Black (red) triangle: foreground obstacle. Note that no ground was classified in this particular scan. (For interpretation of the references to colour in this figure legend, the reader is referred to the web version of this article.)
Fig. 11. Results obtained from the classifier for a scenario where one of the small buildings stands to the right of the robot: (a) output of the classifier, (b) results overlaid on the camera image, (c) and on the laser-generated ground-truth map. Black (green) dot: classified ground. Black cross: classified non-ground. Black (red) triangle: foreground obstacle. (For interpretation of the references to colour in this figure legend, the reader is referred to the web version of this article.)
G. Reina et al. / Robotics and Autonomous Systems 60 (2012) 1377–1388
1385
Fig. 12. Results obtained from the classifier for a scenario with a car to the left of the robot: (a) output of the system, (b) results overlaid on the camera image, (c) and on the laser-generated ground-truth map. Black (green) dot: classified ground. Black cross: classified non-ground. Black (red) triangle: foreground obstacle. (For interpretation of the references to colour in this figure legend, the reader is referred to the web version of this article.)
that is clear of obstacles. Radar observations belonging to the background can be reasonably used as good training examples for the first model of ground (Fig. 8(a)). The same training ground points are projected over the image plane of the camera, which is approximately collocated with the radar and over the lasergenerated map in Fig. 8(b) and (c), respectively, for visualization purposes. The classifier is initialized by acquiring a few scans (s = 8, in our case) during a 3-s window. After the training stage, the radar-based classifier can be used to predict the presence of ground in successive scans. As an example, Fig. 9 refers to the instant T1 = 47 s when the vehicle moves toward the eastern area of the path, which is delimited by two lateral buildings with a car in front of the robot. Fig. 9(a) shows the radar intensity image overlaid with the results obtained from the radar-based classifier. Ground labels are denoted by black dots (or by green dots in the online version of the paper), a black cross marks non-ground, and obstacles detected in the foreground as high-intensity narrow pulses are denoted by a black (red) triangle. In Fig. 9(b), the results are projected over the image plane of the camera for visualization purposes only. Note that only the observations common to the field of view of both sensors are shown. Finally, a comparison with the laser-generated ground truth is provided in Fig. 9(c), which demonstrates the effectiveness of the proposed approach for ground segmentation. As can be seen from these figures, the classifier correctly detects the frontal obstacle and the side walls. The terrain surrounding the car is also successfully identified. Fig. 10 shows a different scenario at time T2 = 54 s where the robot faces the long building occluding the whole field of view of the radar. The classifier successfully flags the presence of the obstructing wall returning no ground labels from the background. A similar scene is shown in Fig. 11 at time T3 = 172 s, when the radar field of view is partially obstructed
by one of the small buildings. The classifier correctly detects the presence of the large obstacle to the right and of ground to the left. Finally, Fig. 12 shows a scenario at time T4 = 210 s with a stationary car to the left of the robot. The system is successful in labeling the ground and the obstacles present in the scene. Overall, the radar-based classifier was tested over 778 radar images, each containing 63 azimuth observations for a total of 48,960 classifications. In order to provide a quantitative evaluation of the system performance, we measured the true positive and false positive rates of the classifier for the radar observations that fall within the camera field of view and that we can handlabel by visual inspection (i.e., ground truth). A Receiver Operating Characteristic (ROC) curve was constructed by adjusting the cutoff value for terrain detection (i.e., by varying the β -quantile value in the range [0; 1], see Section 4.2). The ROC curve for the proposed classifier is shown in Fig. 13 denoted by a black line. It plots the true positive rate (the fraction of ground patches which were correctly classified as ground) on the y-axis against the false positive rate (the fraction of non-ground samples, which were erroneously classified as ground by the system) on the x-axis. A diagonal line at 45° (shown by a black dash–dotted line in Fig. 13), known as the line of chance, would result from a classifier which allocated observations randomly. In order to establish the optimal threshold value or cutpoint for the Mahalanobis distance-based classifier, we can use the ROC curve. In general, a good cutpoint is one which produces a large true positive rate and a low false positive rate. An intuitive method, therefore, is to maximize their difference according to what is usually referred to as the Youden index [38], which can be interpreted as choosing the point on the ROC curve with the largest vertical distance from the diagonal line of chance. This approach assumes that true positive rate and false positive rate are
1386
G. Reina et al. / Robotics and Autonomous Systems 60 (2012) 1377–1388 gt
ground truth map Pi . To this aim, a previously proposed method for segmentation of laser data (GP-INSAC; [7]) was applied to the ground-truth map to extract the true ground and true obstacles. Since the laser-generated map is available as a regularly-sampled grid with square cells of 0.3 m where the center of the grid represents the average height of the cell points, a mean square error in the elevation can be defined as
Ez =
Fig. 13. ROC curve for the radar-based classifier. Solid black line: adaptive algorithm. Gray dashed line: static algorithm. Black dash–dotted line: line of chance.
equally important, weighting evenly the algorithm’s performance on positive and negative examples. For this reason, the Youden index was preferred over other alternatives, for example, the F -score that is a composite measure which benefits algorithms with higher sensitivity and challenges algorithms with higher specificity [39]. In our system, the point of maximum difference between the true positive rate and the false positive rate is reached at β = 0.992, and it corresponds to a true positive rate of 88.0% and a false positive rate of 11.9%. For this point, the overall accuracy, i.e. the fraction of correct detections with respect to the total number of classifications, is of 87.8%. The performance of a ground classifier greatly depends on the accuracy of the model adopted for the ground. The best choice of ground model is tightly connected with the environmental conditions in which the system is used. For example, a ‘‘static model’’, built upon the initial geometric and intensity properties of the ground, could soon fail or give poor results because of changes in ground properties during vehicle travel. Here, an adaptive approach is proposed that allows the ground model to be updated online. In every scan the radar-labeled observations are added to the model replacing an equal number of oldest readings in order to adapt the system to the latest properties of terrain and to ensure robustness to changing environments. To evaluate the efficacy of the model adaptability, a static model was also constructed, whereby the initial appearance model built during the bootstrapping process was fixed and not further modified. The advantage of using an adaptive learning approach with respect to a batch training system can be shown by comparison with the ROC curve of the classifier without the ground model update. The ground model was constructed at the beginning of the sequence, and was never updated. The ROC curve of the ‘‘static’’ classifier is denoted by a gray dashed line in Fig. 13. The comparison between the two implementations can be performed in terms of the total area under the curve (AUC). The larger the AUC, the better the overall performance of the test to correctly identify ground and non-ground observations. Therefore, the adaptive algorithm outperforms the static one, and the curve is closer to the perfect discrimination. 5.2. Mapping The accuracy of the radar-based classifier in mapping the surrounding environment was assessed through comparison with the ground-truth laser data. It should be recalled from Section 3 that when a single radar observation i is successfully labeled as ground, an estimate of its range distance R0,i is also returned by the fitting process. When combined with the localization estimation of the vehicle, this provides a 3D georeferenced position for the labeled point Pi that can be compared to the closest neighbor of the
g
1
g
(Pz ,i − Pzgt,i )2 .
(8)
i=1
In this experiment, the radar ground classifier system detected ground returns in g = 29, 757 observations with an error of Ez = 0.055 m and an associated variance of σz = 0.003 m2 . If the value of R0 is measured conventionally referring to the intensity peak of the radar observation, the error grows to Ez = 0.281 m and σz = 0.221 m2 , respectively. The obstacles present in the foreground of the radar image can also be ranged by referring to the peak of the associated narrow pulse. The accuracy of the system in measuring the position of foreground obstacles can be evaluated as well by comparison with the nearest datum in the true laser obstacle map. A mean square error can be defined this time as
o 1 Exy = (Px,i − Pxgt,i )2 + (Py,i − Pygt,i )2 . o
(9)
i=1
The system measured o = 4817 foreground obstacles with an error of Exy = 0.045 m and a variance of σxy = 0.0014 m2 , respectively. For a complete overview of the system performance, the results obtained from the system over the entire experiment are used to build a map of the environment, as shown in Fig. 14(a). The ground labeled-observations and the foreground obstacles are denoted by grayscale dots colored according to the elevation (or by green and red dots, respectively, in the online version of the paper). The path followed by the robot is also shown by a solid black line. Fig. 14(b) depicts the same data after a post-processing step applying a Delaunay triangulation. Finally, in Fig. 14(c) the laser-generated map is shown for comparison using the same color scale and Delaunay triangulation. This figure demonstrates that the system is capable of providing a clear understanding of the environment, suitable for robotic applications including scene interpretation and autonomous navigation. 6. Conclusions In this paper, a self-learning classifier was described for scene segmentation by an autonomous vehicle using MMW radar. Experimental results obtained using an UGV in a natural scenario validated the proposed approach showing good classification performance with a true positive rate of 88.0% and a false positive rate of 11.9%. In addition, the system provided range estimation of the ground-labeled data with 0.055-m accuracy, which is a considerable improvement over the reference of 0.281 m obtained following the standard highest intensity-based approach. Overall, the radar-based classifier led to the following main advantages: (a) enabling technology for all-visibility condition navigation systems, (b) self-learning training of the classifier, where the radar allows the vehicle to automatically acquire a set of ground samples, eliminating the need for time-consuming manual labeling, (c) continuous updating of the system during the vehicle’s operation, thus making it adaptive and feasible for long range and long duration navigation applications, and (d) accuracy improvement in range estimation. This technique can be successfully applied to enhance perception for autonomous off-road vehicles in natural scenarios or more generally for ground-based MMW radar terrain sensing applications.
G. Reina et al. / Robotics and Autonomous Systems 60 (2012) 1377–1388
Fig. 14. Classification results for the entire experiment: (a) radar-generated map, shown as raw data obtained from the classifier. Grey (green) point: classified ground. Black (red) point: foreground obstacle. (b) Same radar data after Delaunay triangulation, (c) laser-generated ground-truth map after Delaunay triangulation. (For interpretation of the references to colour in this figure legend, the reader is referred to the web version of this article.)
Acknowledgments The authors are grateful to the Australian Department of Education, Employment and Workplace Relations for supporting the project through the 2010 Endeavour Research Fellowship 1745_2010. The authors would like also to thank the National Research Council, Italy, for supporting this work under the CNR 2010 Short Term Mobility program. This research was undertaken through the Centre for Intelligent Mobile Systems (CIMS), and was funded by BAE Systems as part of an ongoing partnership with the University of Sydney. The financial support of the ERA-NET ICT-AGRI through the grant Ambient Awareness for Autonomous Agricultural Vehicles (QUAD-AV) is also gratefully acknowledged. References [1] C. Leger, R. Deen, R. Bonitz, Remote image analysis for Mars exploration rover mobility and manipulation operations, in: Proceedings of IEEE Conference on Systems, Man, and Cybernetics, 2005. [2] S. Thrun, M. Montemerlo, H. Dahlkamp, et al., Stanley: the robot that won the DARPA Grand Challenge, Journal of Field Robotics 23 (9) (2006) 661–692. [3] N. Vandapel, S. Moorehead, W. Whittaker, R. Chatila, R. Murrieta-Cid, Preliminary results on the use of stereo, color cameras and laser sensors in Antarctica, in: Proceedings of the International Symposium on Experimental Robotics, 1999.
1387
[4] T. Hastie, R. Tibshirani, J. Friedman, The Elements of Statistical Learning, Springer, 2003. [5] G. Brooker, R. Hennessey, M. Bishop, C. Lobsey, H. Durrant-Whyte, D. Birch, High-resolution millimeter-wave radar systems for visualization of unstructured outdoor environments, Journal of Field Robotics 23 (10) (2006) 891–912. [6] M. Buehler, K. Iagnemma, S. Singh, The 2005 DARPA Grand Challenge, Springer, 2007. [7] B. Douillard, J. Underwood, K. Kuntz, V. Vlaskine, A. Quadros, P. Morton, A. Frenkel, On the segmentation of 3-D lidar point clouds, in: IEEE International Conference on Robotics and Automation, 2011. [8] G. Reina, G. Ishigami, K. Nagatani, K. Yoshida, Odometry correction using visual slip-angle estimation for planetary exploration rovers, Advanced Robotics 24 (3) (2010) 359–385. [9] A. Huertas, L. Matthies, A. Rankin, Stereo-based tree traversability analysis for autonomous off-road navigation, in: Workshop of Applications of Computer Vision, 2005. [10] R. Pagnot, P. Grandjea, Fast cross country navigation on fair terrains, in: IEEE International Conference on Robotics and Automation, 1995, pp. 2593–2598. [11] S. Singh, R. Simmons, T. Smith, A. Stentz, V. Verma, A. Yahja, K. Schwehr, Recent progress in local and global traversability for planetary rovers, in: IEEE International Conference on Robotics and Automation, 2000, pp. 1194–1200. [12] G. DeSouza, A. Kak, Vision for mobile robot navigation: a survey, IEEE Transactions on Pattern Analysis and Machine Intelligence 24 (2) (2002) 237–267. [13] T. Jocherm, T. Pomerleau, C. Thorpe, Vision-based neural network road and intersection detection and traversal, in: IEEE/RSJ International Conference on Intelligent Robots and Systems, 1995. [14] D. Pomerleau, ALVINN: an autonomous land vehicle in a neural network, in: Advances in Neural Information Processing Systems, Morgan Kaufmann, 1989. [15] Y. LeCun, F.J. Huang, L. Bottou, Learning methods for generic object recognition with invariance to pose and lighting, in: Conference on Computer Vision and Pattern Recognition, vol. 2, 2004, pp. 97–104. [16] R. Manduchi, A. Castano, A. Talukder, L. Matthies, Obstacle detection and terrain classification for autonomous off-road navigation, Autonomous Robot 18 (2003) 81–102. [17] T. Hong, T. Chang, C. Rasmussen, M. Shneier, Road detection and tracking for autonomous mobile robots, in: Proceedings of SPIE Aerosense Conference, 2002, pp. 1194–1200. [18] N. Dima, N. Vandapel, M. Hebert, Classifier fusion for outdoor obstacle detection, in: International Conference on Robotics and Automation (ICRA), 2004. [19] A. Milella, G. Reina, J. Underwood, B. Douillard, Combining radar and vision for self-supervised ground segmentation in outdoor environments, in: Intelligent Robots and Systems (IROS), 2011 IEEE/RSJ International Conference on, 2011, pp. 255–260. [20] C. Brooks, K. Iagnemma, Self-supervised terrain classification for planetary rovers, in: Proceedings of NASA Science Technology Conference, 2007. [21] D. Stavens, S. Thrun, A self-supervised terrain roughness estimator for offroad autonomous driving, in: Proceedings of Conference on Uncertainty in AI (UAI), 2006, pp. 255–260. [22] C. Wellington, A. Stentz, Online adaptive rough-terrain navigation in vegetation, in: Proceedings of International Conference on Robotics and Automation, 2004. [23] D. Kim, J. Sun, S.M. Oh, J.M. Rehg, A. Bobick, Traversibility classification using unsupervised on-line visual learning for outdoor robot navigation, in: Proceedings of International Conference on Robotics and Automation, 2006. [24] S. Clark, H.F. Durrant-Whyte, The design of a high performance mm w radar system for autonomous land vehicle navigation, in: International Conference Field and Service Robotics, Sydney, Australia, 1997. [25] S. Boehmke, J. Bares, E. Mutschler, K. Lay, A high speed 3D radar scanner for automation, in: IEEE International Conference on Robotics and Automation, Leuven, Belgium, 1998. [26] H. Durrant-Whyte, An autonomous guided vehicle for cargo handling applications, International Journal on Robotics Research 15 (5) (2002) 407–441. [27] A. Foessel-Bunting, S. Chheda, D. Apostolopoulos, Short-range millimeterwave radar perception in a polar environment, in: International Conference on Field and Service Robotics, Leuven, Belgium, 1999. [28] G. Brooker, R. Hennessey, M. Bishop, C. Lobsey, E. Widzyk-Capehart, Seeing through dust and water vapor: millimeter wave radar sensors for mining applications, Journal of Field Robotics 24 (7) (2007) 527–557. [29] J. Mullane, D.M. Adams, W.S. Wijesoma, Robotic mapping using measurement likelihood filtering, Journal of Hydrology 10 (3) (2006) 282–290. [30] T. Peynot, J. Underwood, S. Scheding, Towards reliable perception for unmanned ground vehicles in challenging conditions, in: IEEE/RSJ International Conference on Intelligent Robots and Systems, St Louis, MO, USA, 2009. [31] G. Reina, J. Underwood, G. Brooker, H. Durrant-Whyte, Radar-based perception for autonomous outdoor vehicles, Journal of Field Robotics 28 (6) (2011) 894–913. [32] J. Nash, J. Sutcliffe, River flow forecasting through conceptual models part 1: a discussion of principles, International Journal on Robotics Research 28 (2) (2009) 172–190. [33] G. Reina, J. Underwood, G. Brooker, Short-range radar perception in outdoor environments, in: Towards Autonomous Robotics Systems (TAROS), 2011, pp. 265–276.
1388
G. Reina et al. / Robotics and Autonomous Systems 60 (2012) 1377–1388
[34] D. Tax, One-class classification, concept learning in the absence of counter examples, Ph.D. Thesis, Delft University of Technology, Delft, Netherlands, 2001. [35] E. Duda, P. Hart, D. Stork, Pattern Classification, second ed., Wiley, 2001. [36] J.P. Underwood, A. Hill, T. Peynot, S.J. Scheding, Error modeling and calibration of exteroceptive sensors for accurate mapping applications, Journal of Field Robotics 27 (1) (2010) 2–20. [37] T. Peynot, S. Scheding, S. Terho, The Marulan data sets: multi-sensor perception in natural environment with challenging conditions, International Journal of Robotics Research (IJRR) 29 (13) (2010) 1602–1607. [38] J.A. Hanley, B.J. McNeil, The meaning and use of the area under a receiver operating characteristic (ROC) curve, Radiology 143 (1982) 29–36. [39] M. Sokolova, N. Japkowicz, S. Szpakowicz, Beyond accuracy, F -score and ROC: a family of discriminant measures for performance evaluation, AI 2006: Advances in Artificial Intelligence (2006) 1015–1021.
Giulio Reina received the Laurea degree and the Research Doctorate degree from the Politecnico of Bari, Italy in 2000 and 2004 respectively, both in Mechanical Engineering. From 2002 to 2003, he worked at the University of Michigan Mobile Robotics Laboratory as a Visiting Scholar. In 2007, he was awarded a Japanese Society for Promotion of Science (JSPS) fellowship for a one-year research at the Space Robotics Laboratory of the Tohoku University, Sendai, Japan. In 2010, Dr. Reina was also selected to receive an Endeavour Research Fellowship at the Australian Centre for Field Robotics of the University of Sydney, Australia. Currently, he is an Assistant Professor in Applied Mechanics with the Department of Engineering for Innovation of the University of Salento,
Lecce, Italy. His research interests include mobile robotics for planetary exploration, mobility and localization on rough-terrain, computer vision applied to robotics, and agricultural robotics. Annalisa Milella received the Laurea (summa cum laude) and the Research Doctorate degrees from the Politecnico of Bari, Italy, in 2002 and 2006, respectively, both in Mechanical Engineering. In 2005, she was a visiting Ph.D. student at the EPFL Autonomous Systems Laboratory. In 2010, she worked as a visiting scholar at the Australian Centre for Field Robotics (ACFR), University of Sydney. From 2006 to 2009, she worked as a Postdoctoral Researcher at the Institute of Intelligent Systems for Automation (ISSIA), National Research Council (CNR), Bari, Italy. Currently, she is a Researcher at ISSIA. Her research interests include computer vision applied to robotics and intelligent systems, selflocalization methods, and agricultural robotics.
James Underwood is a researcher at the University of Sydney in the School of Aerospace, Mechanical and Mechatronic Engineering and is the Director of the Centre for Intelligent Mobile Systems at the Australian Centre for Field Robotics. He obtained his Ph.D. in 2009 at the University of Sydney, researching in the area of robust ground based perception. His current research areas include perception systems for complex outdoor environments and sensor fusion with an emphasis on combining multiple sensing modalities.