power state Rambus DRAM (RDRAM) [2] and Fully-Buffered DIMM (FB-DIMM). [3] that provide the ability to transition individual memory modules to low-power.
Self-Optimization of Performance-per-Watt for Interleaved Memory Systems Bithika Khargharia1, Salim Hariri1 and Mazin S. Yousif 2 1 University of Arizona, Tucson, AZ, USA email: bithika_k @ece.arizona.edu 2 Intel Corporation, Hillsboro, OR, USA
Abstract - With the increased complexity of platforms coupled with data centers’ servers sprawl, power consumption is reaching unsustainable limits. Memory is an important target for platform-level energy efficiency, where most power management techniques use multiple power state DRAM devices to transition them to low-power states when they are “sufficiently” idle. However, fully-interleaved memory in highperformance servers presents a research challenge to the memory power management problem. Due to data striping across all memory modules, memory accesses are distributed in a manner that considerably reduces the idleness of memory modules to warrant transitions to low-power states. In this paper we introduce a novel technique for dynamic memory interleaving that is adaptive to incoming workload in a manner that reduces memory energy consumption while maintaining the performance at an acceptable level. We use optimization theory to formulate and solve the powerperformance management problem. We use dynamic cache line migration techniques to increase the idleness of memory modules by consolidating the application’s working-set on a minimal set of ranks. Our technique yields energy saving of about 48.8 % (26.7 kJ) compared to traditional techniques measured at 4.5%. It delivers the maximum performance-per-watt during all phases of the application execution with a maximum performance-per-watt improvement of 88.48%. 1.
Introduction
With the increased computing demand coupled with server sprawl in data centers, power consumption is reaching unsustainable limits. Memory is a major consumer of the overall system energy [1]. Recently, researchers [1,4,5] have explored multipower state Rambus DRAM (RDRAM) [2] and Fully-Buffered DIMM (FB-DIMM) [3] that provide the ability to transition individual memory modules to low-power modes. Since memory is often configured to handle peak performance, it is possible to save power and simultaneously maintain performance by allocating the required memory to applications at runtime and moving the un-needed memory capacity to low power states. However, existing techniques fall short when applied to servers with interleaved memory sub-systems. Interleaving does not offer much opportunity for energy saving because memory accesses are symmetrically distributed across all memory modules and thus providing less opportunity for idleness. For example, we ran SPECjbb2005 [6] on our server with fully-interleaved (16-way) memory and observed that the memory was idle for less than 5% of the total runtime of SPECjbb2005. Applying existing power management techniques [1,4,5] to this memory sub-system would
yield only 4.5% total saving. We also ran SPECjbb2005 with smaller degree of interleaving (12-way) and noticed little impact on performance but the idleness of few memory modules increased long enough to yield energy saving of 25% (14.7 kJ). This demonstrated an opportunity to reduce power and maintain performance by dynamically scaling the degree of interleaving to adapt to the application’s memory requirements. This requires us to detect the application’s memory requirements at runtime and appropriately reconfigure the degree of interleaving such that we can maximize the server’s performance-per-watt. In this paper, we propose a dynamic interleaving technique that intelligently interleaves data across selected memory modules and thereby increases the idle period for the remaining modules. Hence the other memory modules can transition to the really low-power states and can remain in that state for longer periods of time. This delivers more performance by expending the same amount of energy. We model the memory sub-system as a set of states and transitions. A state represents a specific memory configuration and is defined by a fixed base power consumption and a variable end-to-end memory access delay. Whenever, the application memory requirement changes and/or the delay exceeds a threshold value, a Data Migration Manager (DMM) within the Memory Controller (MC) determines a target state among all possible system states that consumes the minimum power and yet maintains the delay. It searches for this target state by solving an efficient performance-per-watt optimization problem. Inorder to reconfigure the interleaving to the desired degree as required by the target state, the DMM migrates the application’s working set to the memory configuration in the target state. It works in collaboration with a local Power Manager (PM) per memory module that can implement any finegrained power management technique to transition memory modules to low-power states based on their idleness. The rest of the paper is organized as follows. In Section 2, we present a motivational example for our research approach. Section 3 discusses related work. In Sections 4, we discuss the power and performance model for the memory sub-system. Section 5 discusses the MC model for performance-per-watt management. In Section 6 we discuss some results and finally conclude in Section 7. 2.
Motivational Example
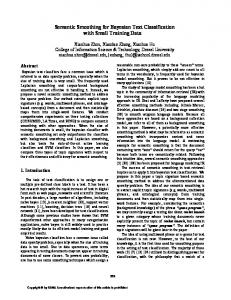
Let us consider a memory sub-system with 8 memory modules as shown in Figure 1 where each module is individually power-managed. Let us consider two time instants t i and t i +1 during the application execution such that the application requires
ni pages at t i and ni +1 pages at t i +1 to achieve the maximum hit ratio. If we consider a sequential page allocation scheme [1], pages are allocated to one memory module completely filling it up before going to the next module. Hence, if ni +1 < ni , we can save power by transitioning the modules, that contain the unused ( ni - ni +1 ) pages, into a low-power state. However with full-interleaving, a single page would be striped across all memory modules. Consequently, the ni +1 pages would occupy all the modules. Hence there are no memory modules with unused pages that can be transitioned to a low-power state. We propose to create the opportunity for power
saving in fully-interleaved memory by dynamically varying the degree of interleaving without hurting performance. For the example shown in Figure 1, we reduce the degree of interleaving from 8-way to 4-way by migrating the data from 8 to 4 modules. In this manner we can transition the remaining 4 modules to a low-power state. However, reducing the degree of interleaving also reduces the parallelization in memory accesses which in turn may impact delay. In our scheme, before we reconfigure the interleaving we ensure that this impact on delay is within acceptable bounds. One way of reducing the impact on delay is to migrate the data in a manner that exploits any unique characteristics of the underlying memory architecture. For example in Figure 1 the memory modules in ‘block A’ can be accessed in parallel to those in ‘block B’ (similar to our experimental server unit). Figure 1 shows two different migration strategies. In strategy I, data is migrated onto memory modules A1 and A2 in block A and B1 and B2 in block B. However in strategy II data is migrated onto memory modules A1, A2, A3, A4 all in the same memory block A. Naturally strategy II would have a higher impact on delay compared to strategy I because it did not exercise both the blocks. Since cache lines with very high spatial reference affinity would lie within the same block, they would experience sequential access pattern as compared to strategy I where they can be accessed in parallel. Since most programs demonstrate a high spatial locality of reference, this would lead to a significant reduction in the parallelism of accesses for strategy II and hence severely impact delay. We have experimentally verified this observation where we noticed a 5.72% drop in SPECjbb2005 performance for migration strategy II. Block A
I Block A A1 A2 A3 A4
A1
A2
A3
Block B
A4
B1
B2
B3
5.3W at 0% access B4
Block B
2.8ms
active
suspend .389W
5ms
125ns
A1 A2 A3 A4
A1
A2
A3
A4
B1
II
B2
B3
B4
standby 2W
offline 0W
Fig 1. Data migration strategies 3.
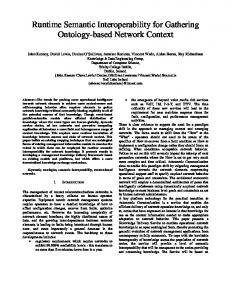
Fig 2. FB-DIMM power states
Related Work
Researchers have exploited hardware features such as multiple power states RDRAMs and FB-DIMMs for dynamic power management of the memory subsystem. Delaluz et al. proposed various threshold predictors to determine the maximum amount of time that a memory module must remain idle before it is transitioned into a low power state [8]. Fan et al. investigated MC policies in cachebased systems and concluded that the simple policy of immediately transitioning the DRAM chip to a lower power state as soon as it becomes idle is superior compared to more sophisticated policies that try to predict the idle time [4]. Researchers have also looked at co-operative hardware-software schemes for memory power management. Lebeck et al. studied page allocation techniques to cluster the application’s pages onto a minimum number of memory modules thereby increasing the idleness for the other modules [1]. Zhou et al. used such page allocation schemes combined with the page Miss Ratio Curve metric to determine the optimal memory size that would give the maximum hit ratio for the application [5]. Delaluz et al. proposed a scheduler-based
policy that used prior knowledge of memory modules used by a specific process to allocate the same memory modules the next time the process is scheduled [9]. Huang et al. built on this idea to develop Power-Aware Virtual Memory [PAVM] where the OS and the MC communicate to enhance memory energy savings through leveraging NUMA memory infrastructure to reduce energy consumption on a per-process basis [10]. Delaluz et al. [11] migrated arrays in multi-bank memory based on temporal locality to consolidate the arrays on a small set of banks. There has also been a plethora of work that addresses memory power management while maintaining performance. Li et al. [13] proposed a Performance-directed Dynamic (PD) algorithm that dynamically adjusts the thresholds for transitioning devices to low-power states, based on available slack and recent workload characteristics. A departure to this approach is provided by the work of Diniz et al. [14] that shows that limiting power is as effective an energy-conservation approach as techniques explicitly designed for performance-aware energy conservation. Our scheme differs from these techniques because we address power/performance management of interleaved memory sub-systems where current techniques cannot be applied. We use migration to dynamically reduce the size of the interleaving in order to reduce power while maintaining performance. Our scheme incorporates knowledge about the underlying memory architecture in performing migrations. Our scheme is application and OS agnostic because it is closer to the hardware. 4.
Memory Power and Performance Model
We consider FB-DIMM as our memory model which is popular in highperformance servers because of its reliability, speed and density features. An FBDIMM packages multiple DDR DRAM devices and an Active Memory Buffer (AMB) in a single module. The AMB is responsible for buffering and transferring data serially between DRAM devices on the FB-DIMM and the MC. Figure 3 shows the model of our memory sub-system. It is based on the architecture found in Intel Xeon series servers. It consists of multiple branches where each branch consists of multiple channels, each Rank 0 Rank 1 Rank 0 Rank 1 Rank 0 Rank 1 Rank 0 Rank 1 channel contains FBDIMM 1 FBDIMM 2 FBDIMM 3 FBDIMM 4 multiple FB-DIMMs and Channel A Channel B each FB-DIMM contains multiple ranks. Ranks Branch 0 Branch 1 on separate branches can Autonomic Memory Controller be accessed in parallel. Data Migration Manager Ranks on separate channels can be Power Power .. . Power Manager Manager Manager accessed in lock-step. FSB 0 FSB 1 Ranks within the same channel can be accessed Fig 3. Memory sub-system model sequentially. The number of DRAM devices accessed simultaneously to service a single memory request defines a rank. In our model we consider a rank as the smallest unit for power management.
An FB-DIMM includes four power states – active, standby, suspend and offline as shown in Figure 2. Memory requests are serviced only in the active power state. A state that consumes less power also has a high reactivation time. The AMB brings in another set of challenges for memory power management because it consumes power even when the FB-DIMM is idle in order to maintain the data transfer link between the MC and neighboring FB-DIMMs on the channel. We model the performance of the memory sub-system in terms of end-to-end delay d . It is defined as the time from the instant the request arrives at the MC to the time when the data becomes available at the MC. 5.
Memory Controller Model for Performance-per-Watt Management
In this Section we first discuss how we can track the dynamic memory requirements of the application. We then discuss the impact of a specific memory configuration on the delay. This information is used by the MC to search for a target memory configuration (state) that gives the maximum performance-per-watt among all possible memory configurations (state). 5.1. Dynamic tracking of application memory requirement The DMM uses the MRC metric [5] to predict the dynamic memory requirements of the application. Let us consider that during epoch ti , memory of size of n (pages) is in an active power state. Let us assume that we measured the number of hits going to each page and pages are maintained in a strict LRU [7] order where the most recently referenced page is moved to the head of the LRU list. Now, the contents of a memory of size n pages are a subset of the contents of a memory of size n + 1 pages or larger due to the inclusion property of LRU. Using this property we can calculate the MRC for any memory size of m pages where m wR > wZ, wB >(wD+wR) etc. Hence, a cache line pair across separate branches Bi and Bj gives a higher SLA compared to that across separate ranks (wB >wR). We now combine these two metrics in order to weigh the impact of one placement strategy over another in terms of their combined impact on the delay. We do this with the aid of the conflict metric ∆ψ given by equation (3). 1 ... (3) ∆ψ ( s ) = SLAmin ( s) * SRAmin ( s )
Let us consider two placement strategies that use different memory sizes. We compute the minimum SRA given the minimum SLA for each placement strategy. From Equation (3) the strategy that has the smallest SLA and smallest SRA for that SLA has a higher ∆ψ indicating a higher impact on delay. Similarly, for two placement strategies that use the same memory size (number of ranks) but different memory configuration (physical location of ranks) we compute minimum SLA for adjacent cache line pair (minimum SRA) for each strategy. Since the minimum SRA is fixed for both the strategies, in this case the strategy that gives the smaller SLA has a higher ∆ψ indicating a higher impact on delay. For example, each migration strategy of Figure 1 has the same memory size but different memory configuration. Now, for strategy II, SLA for minimum SRA is wD but for strategy I it is wB. Since wB > wD ∆ψ for strategy II is higher than that for I. This explains the drop in performance for SPECjbb2005 for strategy II. Hence we always favor the migration strategy that has the smallest value of ∆ψ ( s ) . 5.3. Formulating management
the
optimization
problem
for
performance-per-watt
We formulate our adaptive interleaving technique as a performance-per-watt maximization problem. 1 Maximize ppwt = such that d k * ek ... (4) 1.nk * sr >= N ws * s p i
2.d min ≤ d k ≤ d max
Ns
3.∑ x jk = 1 k :1
4. ∨ x jk = 0 |1
where, ppwti is the performance-per-watt during interval the
energy
consumed
during
t i , d k is the delay and ek is
target
state
sk
where
Ns
ek =
∑ (c
jk
* τ trans jk + p a * n k * t obs ) * x jk is the sum of the transition energy
k :1
consumed ( c jk
*τ trans jk ) and the energy consumed in the target state ( pa * nk * tobs ),
N s : total number of system states, c jk : power consumed in state transition and
τ trans : time taken for state transition, [d min , d max ] : the threshold delay range, x jk : jk
decision variable for transition from state
s j to sk , sr : size per rank. The state sk
represents a specific memory configuration given by the number and physical location of the ranks in the ‘active’ power state. It is defined by two tuple - fixed base power consumption p k and variable end-to-end delay d k . The first constraint in Equation 4 states that the target state should have enough memory to hold all the Nws pages. The second constraint states that in the target state, delay should stay within the threshold range. The third constraint states that the optimization problem leads to only one decision. The decision variable corresponding to that is 1 and the rest are 0. The fourth constraint states that the decision variable is a 0-1 integer. Analysis of Transition Overhead: The transition overhead c * τ trans is the energy spent during state transition. We factor this overhead into the objective function to identify state transitions that would give the smallest overhead among all possible transitions. We also account for the impact of the transition time τ trans on delay. Owing to constraint 2 Equation 4, this prevents state transitions when
τ trans
is too
high. Hence this reduces the frequency of state transitions and thereby maintains the algorithm sensitivity to workload changes, within acceptable bounds. The transition time is expressed as τ trans = τ m + τ p where τ p denotes the rank power state transition time (see Figure 2) and τ m denotes the data migration time. Since ranks can transition in parallel τ p is essentially the rank reactivation time. τ m is a sum of the rank read time, data transfer time on the link(s), rank write time and the time taken to update a hardware indirection data structure that routes accesses to migrated data blocks. Note that τ m is directly proportional to the amount of data being migrated. We call this the migration data Μ . In our case, Μ is the predicted application working set ( N ws ). Hence, maintaining the working set in memory not only reduces memory over-provisioning but also reduces migration overhead.
Migration Energy: The energy consumed during migration expressed as
c *τ trans
can be
c * τ trans = n k * p t * τ p + p m * τ m where p t is the transition power
consumed by a rank and p m is the power consumed in the memory sub-system during data migration. p m can be expressed as a sum of the buffer power, base FB-DIMM power, DRAM refresh power, read power, link power and write power. We assume a close-page policy which is energy-efficient for interleaved memory. Hence we do not account for the energy spent in accessing open pages during migration. 6.
Experimental Results
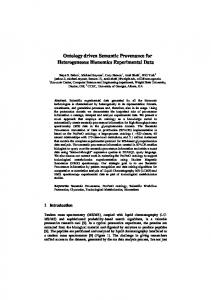
Our test-bed consists of a server with Intel Xeon processors and 5000 series chipset. It has memory architecture similar to that shown in Figure 3. It consists of two branches, two channels per branch, two FB-DIMMs per channel and two ranks per FB-DIMM. The server can support a total of 8 FB-DIMMs or 16 ranks in total. We studied the performance-per-watt for the SPECjbb2005 on our server unit. SPECjbb2005 emulates a 3-tier client/server system with emphasis on the mid-tier business logic engine. It gives the performance of the system in a throughput measure called BOPS (business operations per second). Current server technology does not support dynamic memory interleaving. To get around this problem we emulated dynamic interleaving by manually reconfiguring the memory sub-system as required. Every reconfiguration required a system restart. 6.1. Analysis of Performance-per-watt Improvement for SPECjbb2005 Our algorithm monitored the MRC for SPECjbb2005 as described in Section 5.2 .It also monitored the average end-to-end delay by using chipset performance counters per rank. It used these parameters to trigger a search for an optimal state as discussed in section 5.3. We then manually reconfigured the memory sub-system to this optimal configuration and restarted the system. We repeated this process until the application execution was complete. At the end of each phase that required a memory reconfiguration, we recorded the BOPS and the power consumed by the system. Note that sometimes the algorithm returned a memory configuration that could not be configured in hardware without changing the configuration registers in the MC. For example, since the channels were configured to work in lock-step we always needed to populate FB-DIMMs as a pair, one on each channel. Hence we could only work with even-numbered FB-DIMMs. In such cases the algorithm returned a second sub-optimal solution that gave a smaller performance-per-watt compared to the optimal solution and we reconfigured the memory sub-system accordingly. Figure 4 shows the temporal variation of optimal and sub-optimal states given by our algorithm. In order to compare the performance-per-watt improvement given by our algorithm, at the end of each epoch that required a reconfiguration, we reconfigured the memory not only to that desired by our algorithm but also to all other possible memory configurations allowed by the hardware. We ran SPECjbb2005 on each of these configurations and recorded the BOPS as well as the power consumed. Figure 5 shows the temporal variation of performance-per-watt (BOPS/Joules) for each such
18 16 14 12 10 8 6 4 2 0
200 Performance/Watt (BOPS/Joules)
System State (Active Ranks)
configuration. We observed that our algorithm always determined the memory configuration (configuration IV in Figure 5) that gave the maximum performanceper-watt among all possible configurations with the maximum improvement in performance-per-watt recorded at 88.48%. 150 100 50 0 0 0
200
400
600
800
1000
200
400
1200
600
800
1000
1200
Time (s)
Time (s) Optimal State
Sub-optimal State(IV-8 Ranks, 2 Branches)
Fig. 4: Optimal and sub-optimal states
PPW (I-16 Ranks)
PPW (II-12 Ranks)
PPW (III-8 Ranks, 1 Branch)
PPW (IV-8 Ranks, 2 Branches)
Fig. 5: Performance-per-watt comparison
On the same server we ran SPECjbb2005 and measured the idle durations between memory accesses to each rank by using chipset counters. With a thresholdbased power management algorithm, where we transition the rank to a low-power suspend state when it is “sufficiently” idle to break-even, we got an energy saving of 4.47% (189.6 J). This compares to about 48.8% (26.7 kJ) energy saving with our technique. 6.2. Algorithm Adaptivity to Workload SPECjbb2005 launches an additional warehouse at the end of each observation epoch that executes randomly selected business operations from an in-memory database of operations. Instead of computing the MRC, our algorithm used the benchmark’s heap usage at the end of each warehouse to predict the memory requirements of SPECjbb2005. This is because it was not possible to measure the number of hits per page accurately from the OS to compute the MRC. However as can be seen from Figure 5, this approximate approach still gave the memory configurations with the maximum improvement in performance-per-watt among all possible configurations. We also instrumented the linux kernel to index the memory pages starting at the head of the LRU active list until it was equal in size to the heap used. This is the working set for SPECjbb2005 and comprises the migration data Μ that is to be dynamically interleaved on the memory configuration given by our algorithm. Figure 8 plots these pages as a percentage of the total pages in the LRU active list. As expected, this graph varies inversely as the percentage of overprovisioned memory as plotted in Figure 6. Figure 7 plots the memory size (in ranks) that is predicted to be required by SPECjbb2005 as discussed in Section 5.2. The ‘actual ranks’ in Figure 7 is the ceiling value of the ‘calculated ranks’. By comparing Figures 6 and 7 we see that the memory size varies inversely with over-provisioned heap as expected. Also notice that the optimal and sub-optimal ranks computed by our algorithm (Figure 4]) are always higher than the ‘calculated ranks’ of Figure 7. This is because consolidating the working set on these ‘calculated ranks’ maintains the application memory
requirements but significantly increases the delay. Hence it violates the delay constraint which makes these states infeasible. Calculated & Actual Ranks
80 70 60 50 40 30 20 10 0 10
100
1000
6 5 4 3 2 1 0
10000
0
200
400
600
Time (s) Warehouse
800
1000
1200
Time (s)
Percent Overprovisioned
Calculated (Ranks)
Fig. 6: Dynamic heap usage of SPECjbb2005
Actual (Ranks)
Fig. 7 Variation of SPECjbb2005 working set) pages (memory ranks)
Also note from Figure 6 that around 600 sec into the application execution, the over-provisioning reduces close to 30%. As can be seen from Figure 4, it is around this time that the algorithm increases the memory size from 4 to 6 ranks in anticipation of a heavy workload arrival phase. However when the over-provisioning increases around 800 sec the algorithm maintains the same memory size (6 ranks). At about 1000 sec, when the over-provisioning further increases, the algorithm reduces the memory size from 6 ranks back to 4 ranks. The algorithm has a tendency to latch on to previous memory configurations. It initiates reconfigurations only when significant over-provisioning is detected. It works conservatively because it accounts for the overhead involved in state transitions. This is discussed in the following section. 6.3.
Analysis of Migration Overhead
Figure 8 plots the migration overhead (in milli seconds) associated with the migration data Μ for SPECjbb2005. This overhead has been computed for solution IV in Figure 5 that gives the maximum performance-per-watt. Notice that the overhead is very small at the end of the first SPECjbb2005 warehouse because the migration data is small enough and the state transition decision being evaluated was to go from 16 to 8 ranks. Consequently, as we see from Figure 4, the algorithm allowed this state transition. However, at the other warehouses the transition overhead increased considerably as Μ increased and the transition decision to be evaluated 80000
80
300 250
60
200 150
40
100
20
50 0
0 0
2
4
6
8
10
Warehouses Data Migration Overhead (ms)
SPEC JBB BOPS
100
350
Percent Pages in Memory
Expected Data Migration Overhead (ms)
400
70000 60000 50000 40000 30000 20000 10000 0 1
2
3
4
5
6
7
8
Warehouses Percent Pages
BOPS (without SLA,SRA)
BOPS(with SLA,SRA)
Fig. 8 Migration overhead Fig. 9 Comparison of migration strategy was to migrate from 8 to 4 ranks. The algorithm did not allow this state transition and
instead it paid the overhead one time and maintained the memory configuration at a steady state with 8 ranks distributed across two branches. 6.4. Impact of migration strategies on SPECjbb2005 performance Figure 5 shows the performance-per-watt obtained for two solutions (III-8 ranks, 1 branch & IV-8 ranks, 2 branches). Note that these two solutions have the same number of ranks but different physical location in the memory hierarchy. However solution IV provides a higher performance-per-watt compared to solution III. Figure 9 plots the BOPS measured at the end of each warehouse for both these solutions. Solution III gives a performance drop of 5.72% for SPECjbb2005 when compared to solution IV. Our algorithm is able to effectively identify this with the aid of the temporal affinity prediction technique discussed in Section 5.2.2 and chooses solution IV over solution III thus giving the maximum performance-per-watt. 7.
Conclusion
In this paper, we presented a technique to optimize the performance-per-watt of a fully-interleaved memory sub-system. Our approach yielded an energy saving of about 48.8 % (26.7 kJ) compared to traditional techniques measured at 4.5%. It gave a transition overhead of about 18.6 ms leading to energy saving of 1.44kJ per ms of transition overhead time and a maximum performance-per-watt improvement of 88.48%. We are currently validating our results on different memory traces and studying the algorithm scalability, adaptivity and sensitivity to threshold values. We are applying data mining and rule learning techniques to implement an efficient real-time version of our algorithm that significantly reduces the runtime complexity of the algorithm. We are also extending our technique to servers running multiple applications. 8.
References
1. 2. 3. 4. 5.
A. R. Lebeck et al. “Power aware page allocation”. Proc. ASPLOS-9, 2000. Rambus, RDRAM, 1999. http://www.rambus.com. DDR2 FBDIMM Technical Product Specifications. X. Fan et al. “Memory controller policies for dram power management”, Proc. ISLPED, 2001. P. Zhou, et al., “Dynamic tracking of page miss ratio curve for memory management”, In Proc. ASPLOS-11, 2004. SPECjbb2005, http://www.spec.org/jbb2005/docs/WhitePaper.html. D Bovet and M Cesati. Understanding the Linux Kernel, O’Reilly, 2002. V. Delaluz et al. “Hardware and Software Techniques for Controlling DRAM Power Modes,” IEEE Trans. Computers, vol. 50, no. 11, pp. 1154-1173, Nov. 2001. V. Delaluz et al. “Scheduler-Based DRAM Energy Management,” Proc. DAC-39, 2002. H. Huang et al. “Design and Implementation of Power-Aware Virtual Memory,” Proc. USENIX Technical Conference, pp.57-70, 2003. Delaluz et al., “Automatic Data Migration for Reducing Energy Consumption in Multi-Bank Memory Systems,” Proc. 39th Design Automation Conf., ACM Press, 2002, pp. 213-218. D. Wang et al., "DRAMsim: A memory-system simulator”, SIGARCH Computer Architecture News, vol. 33, no. 4, pp. 100-107. Sept. 2005. Li et al., Performance-directed energy management for main memory and disks, Proc. ASPLOS-11, 2004, Boston, MA, USA Diniz et al., Limiting the power consumption of main memory, Proc. ISCA-34, 2007, San Diego, California, USA.
6. 7. 8. 9. 10. 11. 12. 13. 14.