tracking software such as 2d3's Boujou [1] to reconstruct a camera path and some ... by a perceptual measure expression that ranks different candidate regions.
Semi-automated Placement of Annotations in Videos Vineet Thanedar and Tobias Hollerer ¨ Department of Computer Science, University of California, Santa Barbara vineet, holl�@cs.ucsb.edu
ABSTRACT In this paper, we present a framework for the insertion and semiautomated placement of visual annotations into video footage. Visually overlaid annotations are very common in telecasts (e.g., statistics in sports broadcasts, banner advertisements), where they are strategically placed by hand, or incorporated into the video stream using elaborate camera tracking and scene modeling techniques. Such information is not commonly available for raw or unprepared videos. We look at the problem of automatically placing annotations within the space and time domains of unprepared videos using computer vision and image analysis techniques. We use measures of intensity and color uniformity, motion information, and a simple model of cluttered screen space to determine regions in the video that are of relatively minor importance to the human visual perception. We present a taxonomy of visual annotations, a subset of whose we realize as automatically placed video overlays, implemented in our prototype system named DAVid (Digital Annotations for Video). We conclude with an outlook of potential applications of these techniques in interactive television.
1.
INTRODUCTION
There has been a phenomenal growth in the amount of video material available over the past few years. Much of this video information is in its raw or unprepared form without any augmentation of the visual component of the data. Increasingly, in realtime video broadcasts, the live video feed is often augmented with graphical overlays. Advertisements, game scores, and logos are a few of the several graphical items. In sports broadcasts, graphical enhancement of the visual feed is common [9], [14], [12], [13], [8]. Some examples of these include the First-Down Line in American Football and statistical annotation overlays in NASCAR. Virtual product advertisements are now inserted into live video feeds as an advertising alternative. With the advent of interactive television (iTV), there has been a shift towards customizing content based on viewer profiles. With information flowing from the viewer to the broadcaster as well, greater control lies on the user side in requesting content. This means that the video data delivered to the consumer needs to be augmented with multiple pieces of information that are retrieved and overlaid when requested. The augmenta-
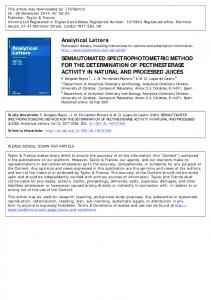
Figure 1: A “Pop Up Video”style annotation, automatically placed in a music video. The numbers show our final placement criterion value for this specific frame for a grid of 36 discrete regions.
tion of general videos with annotations presents useful applications in sports, entertainment, and personal media among others. For example, videos of sports broadcasts, instructional/training videos, navigational videos, or personal home videos can be annotated with relevant information to produce prepared video segments. In this paper, we address the problem of automating the process of placing annotations in videos. Adequate annotation placement should avoid occlusion of moving objects and informative scene elements, and should aim to not distract the viewer (e.g., annotations that “jump around” on the screen are of little help). There is a newly emerging industry of commercial video processing services that enables insertion of 2D and 3D annotations into videos, such as the virtual first-down line in football broadcasts, or virtual advertising. Such material is placed using intricate tracking equipment and/or considerable human intervention. We are interested in finding good solutions for the placement problem in videos, for which no background or supplementary information about the camera and 3D scene geometry is available. In this scenario, placement needs to be guided by low-level information available from the video stream alone. In this paper, we propose the application of computer vision algorithms and image analysis techniques to the defined problem of
insertion and placement of annotations in videos. Since automated segmentation and object tracking for unprepared videos is an unsolved research problem, we assume that for annotating moving objects semi-automatic pre-processing of the video is possible prior to augmenting it. Also, since some relaevant video processing algorithms, such as optical flow determinations do not run at interactive frame rates, we store such frame-to-frame information in an offline pre-processing step to allow for interactive annotation placement at video run-time. We have focussed primarily on sports videos but the framework is applicable to generic videos. Our specific contributions are:
� We present a system framework that captures important elements of the problem of semi-automatically placing annotations in arbitrary video. � We present a short taxonomy of annotations and outline their properties. � We characterize placement regions in a video that are of relatively little importance or little perceptual interest to a viewer. These region properties are elementary in their nature and can be combined to define meaningful quantitative measures for regions. � We evaluate our techniques using the tasks of associating annotations with moving players in sports videos and placing global annotations in the scene.
2.
RELATED WORK
Scientific work in the area of overlay of annotation elements in 2D scene views falls under two basic categories. We have problem domains where some a priori information about the environment is available. These include environments such as real-time video broadcasting where a virtual model of the environment and/or camera motion information is present, which can be used to determine the part of the scene in view. In real-time broadcasts, graphical annotations are primarily overlaid by a human operator or based on elaborate sensor-based scene object tracking systems [12, 13]. The technology behind these systems is highly sophisticated and expensive. Systems that fall in this category include the proprietary 1st and Ten [12] technology, RaceFx [13], Sports Enhancement [14] solutions, Sports Production Systems [9], and Virtual Product Integration [8] systems. The placement of annotations associated with elements in a scene has been a recent topic of research in 3D virtual and augmented reality environments. Bell et. al. [4] describe a view management system where they address the problem of determining spatial layout of the projections of objects in a 3D scene on the view plane. They propose algorithms that use rectangular extents to approximate on the view plane the occupied space comprised by the projections of visible parts of 3D objects, and also unoccupied space, where new objects can be placed. Their decision is aided by the availability of a virtual model. Label placement in augmented reality view management has also been explored by Azuma and Furmanski [3]. However, their sole objective is to detect and prevent overlaps among annotations. The second category in the area of video annotations is concerned with raw video data without any geometry or tracking information.
The defining characteristics here are very different from the above category that uses a-priori knowledge. In the past, placement of annotations in such unprepared videos has not been significantly explored. Proprietary approaches [8] address the insertion of advertisements in video feeds using computer vision but specifically with respect to placing them by detecting and utilizing the space provided by existing billboards on the field in live sports broadcasts. It is possible to pre-process video feeds with semi-automated tracking software such as 2d3’s Boujou [1] to reconstruct a camera path and some 3D feature points, which enables some of the annotation methods from the first category. In this paper, however, we are concerned with placing simple 2D annotations in video regions of low visual interest. Research in video segmentation and analysis provides us with many elements required to solve this problem using computer vision and image analysis techniques [7, 2, 5, 6]. In this paper, we propose the integration of various techniques from these areas to design and develop a prototype system that aids the augmentation of videos with annotations.
3. TAXONOMY OF ANNOTATIONS Our objective is to design a framework that lets the user associate annotations with arbitrary elements in the video. Annotations typically fall under two basic categories - ) Object Annotations and �) Global Annotations.
3.1 Object Annotations These are associated with specific objects in the scene. For example, a race car annotation, or a player’s name and statistics in game sports. The annotations stay on screen as long as the object is present. It follows that placement of these annotations requires that the object be identified and tracked in each frame of the video sequence for the entire duration of time that the object is in view. In our system, we support semi-automatic identification and tracking of objects in the video. This is discussed in Section 5.1. Object annotations can be further classified into two categories:
Object Followers These annotations are placed close to the object in the scene such that they do not occlude the object itself or any important information around it. To predict the presence or absence of such important information from a plain video is one of the contributions of this paper. The annotation follows the motion of the object in the scene.
Screen-Stabilized These annotations are placed in a fixed area on the scene and a dynamic follower line points from the annotation to the object as the object moves in the video. The region where the annotation is placed is determined by analyzing the video for the duration of time when the object is in view. The exact placement is determined by a perceptual measure expression that ranks different candidate regions. We implement object-based annotations as a combination of the above two categories. The region around an object is evaluated for the presence of any other important scene elements. This evaluation is done multiple times during the lifetime of the object. The best location is then picked and the annotation overlaid in that position. The annotation stays there (screen-stabilized) as long as there
is no scene information (predicted by strong motion and varying region uniformity) that it is interfering with and as long as the object does not drift too far from or collides with the annotation. If this happens, the surrounding region is re-evaluated for a good location (object-follower)
3.2 Global Annotations Global annotations are not associated with any particular object in the scene. Examples of these annotations include banners and advertisements in videos or game-related annotations in sports videos (cf. Figures 1 and 6). The annotations are placed based on the analysis of the entire frame, a sequence of frames, the current camera shot, or the whole video. In section 4, we characterize the region properties that influence the placement of global annotations. A subcategory of global annotations is 3D perspective annotations.
3D Perspective Annotations These annotations are aligned as per the geometric 3D structure of the region they are placed in. This requires 3D structure determination of the scene in view. These annotations provide a more realistic appearance as they are designed to be merged into the 3D scene. In this paper, we focus on object annotations and global nonperspective annotations. Video annotations can be pre-timed using the preprocessed tracking information (e.g., a certain tracked player enters the field of view), or pop up dynamically, based on events that the computer would detect automatically (e.g. camera shot boundaries), or on user interaction (e.g. mouse clicks in iTV).
4.
ELEMENTARY PERCEPTUAL DESCRIPTORS
This section presents the primary ideas behind identifying regions that are suitable for annotation placement. We identify and characterize a few basic types of properties for video regions. We refer to these as Elementary Perceptual Descriptors since each of these characteristic properties is distinctly perceivable by the human visual system. In this paper, we identify homogeneity, motion, and clutter as elementary perceptual descriptors. More generally, this can be extended to include other distinct perceptual descriptors such as texture similarities or a higher-level domain-specific descriptor such as semantic content. Different types of scene regions can be identified on a visual level by a combination of the three basic descriptors discussed in the following subsections. We derive a measure of the interest level or degree of importance of a region as a combination of these properties. In our system we identify uninteresting or relatively less important regions in the video, which are potential locations for placing annotations. We utilize this knowledge to direct the placement of scene annotations. For example, in sports videos, there typically exists a foreground region with considerable amount of action resulting from the presence and motion of several large- to medium-sized objects. The background region is mostly devoid of interesting activity. Within the foreground region, distinct sub-regions include players, the field, and other specific game-related artifacts. The background region also consists of multiple sub-regions such as the stands, billboards, and other scene backdrop regions (e.g., sky patches). All of these regions have specific properties.
4.1 Homogeneous Regions
We characterize homogeneous regions as regions that are uniform with respect to a visual homogeneity metric that is qualitatively determined based on the video. These regions are a logical choice for annotation placement as they typically contain less information and appear less prominent to the human eye. Each distinct homogeneous region, , is the set of all connected pixels that satisfy a certain uniformity criterion. A region is bound by a region boundary, which is the set of pixels that separate it from other regions.
� �� � ��� � � ���� � �� � where � �� � � �� � �� �, � ��� gives the uniformity metric value at each pixel, and �� and �� are the lower and upper bounds for the �
metric in each region. The regions being distinct, ��� � �
� �.
We segment each frame of the video, in which an annotation has to be placed into distinct homogeneous regions. The uniformity metrics that we consider are intensity and color.
Intensity Uniformity To support the placement of annotations associated with regions that are uniform in their intensity, we implement video frame segmentation based on intensity as the uniformity criterion. We use the NTSC-standard luminance value as our gray-level intensity for each pixel in a color video. To segment the frame, we grow regions such that each segmented region eventually adheres to the region uniformity criterion as stated above. We implement the Seeded Region Growing [2] approach to segment the frame into regions as defined above. The seeded region growing approach is based on the conventional region growing postulate but the pixel aggregation technique is closer to watershed algorithms. Regions are grown starting from an initial set of seed points that are approximately representative of the region’s uniformity. The seeded region growing method is sensitive to noisy images. To overcome this problem, we apply the SUSAN [11] noise filtering algorithm. The SUSAN filter preserves the image structure and hence there is no degradation of edges or corners in the image. This helps in maintaining region coherence in the video frame image.
Figure 2: Uniformity metric for different regions of a soccer video. Greater values correspond to less uniform regions. In Section 5, we describe our approach towards automated placement of object-based and global annotations based on evaluation
of regions. We use a uniformity measure based on intensity uniformity in a region as one of our evaluation metrics. We use the following measure for intensity uniformity of a subregion:
�� � ����Æ � Æ� �
Æ
�
� �
��� �� ��� ���
�
�
� � ��� � � ���� �
�� � �� � � � � � � ��� � ��� �� � ��
Higher values of the uniformity measure indicate regions with less uniformity whereas lower values indicate a region more uniform in terms of intensity. The equation basically describes scanning the region in the horizontal and vertical directions. The sum of the intensity differences between consecutive pixels is then computed for both the directions independently. This is then normalized with respect to the size of the region. This gives information about the gradient changes along the two directions. The maximum of the two values is a simple measure of the uniformity of the region.
motion analysis method. Image difference is computed based on the pixel intensities for each frame of the video. We would like to mention that although this method is simple and susceptible to noise, it is a quick way of extracting the presence of active regions in the image. To derive the characteristics of motion in the video, we compute optical flow between subsequent frames in the video. We apply the Horn and Schunk [7] optical flow algorithm. To determine dormant motion regions in the video, we use this flow information to segment the video frame and extract regions of low optical flow. We also enable adjustment of a threshold parameter that can be fine-tuned on a scale such that it is possible to adaptively control the segmentation of regions based on their motion. Thus, we can focus on specific regions being segmented on a frame-byframe basis.
Figure 2 shows a video frame with values for the above intensity uniformity measure overlaid on it. We see that the background regions, where a crowd is present, has a higher value of the measure since there is a lot of variation of intensity in those regions. The foreground consisting of the playing field however has low values.
Color Uniformity Color forms an important visual component of any video. Consequently, color-uniform regions are natural candidates for placement of annotations in the video. To segment based on color, we apply the color image segmentation algorithm proposed by Comaniciu and Meer [5]. Their approach is based on the widely successful mean shift procedure, a nonparametric density gradient estimator. As with intensity uniformity, we also define a measure for color uniformity in a region. The color uniformity measure is computed by color segmenting the region and is defined as:
� � � � �� where is a proportionality constant, � is the size of the largest uniform connected component, � is the number of distinct connected components, and is the size of entire region. 4.2 Dormant Regions The entire frame area in most videos can be partitioned into discrete sub-areas based on the motion of pixels in the frame. Thus, a video generally consists of moving areas or objects, also referred to as active regions that attract the attention of the human eye. The remaining regions in the frame typically exhibit considerably less motion and can be labelled as dormant regions. A dormant region is generally part of the screen estate where information can be overlayed without distracting the viewer. We would like to mention that a strict classification is not always possible, especially in presence of camera motion. However, as a rule of thumb, regions exhibiting less motion are generally better suited for annotation placement than those with a lot of object motion (exception: see definition of clutter in Section 4.3). We partition regions based on their motion in the frame image by applying two primary methods. The first is a simple differential
Figure 3: Metric for dormant regions applied to fixed regions in a soccer video. Higher numbers correspond to more “motion” (based on frame-to-frame intensity differences). If we have a specific region that we want to evaluate for amount of ongoing motion, we calculate the fraction of the pixels in the region that are classified as moving. Say � is the total number of pixels in the subregion and � is the number of pixels identified as moving based on the thresholding criterion.
� ��
Figure 3 shows the values for the motion measure for the soccer frame from Figure 2 with motion based on intensity differences relative to the previous frame in the video. The threshold for intensity differences was 25 (out of a range of 255).
4.3 Noisy and Cluttered Regions In the earlier sections, we discussed homogeneous regions where either the intensity or the color within the region area varies only within a small range. We also discussed regions that feature only very small amounts of perceptible motion (even in presence of camera motion), and called them dormant regions. In this section, we define a class of video regions that do not fall under either of the above categories and hence cannot be extracted by applying their individual methods. These are the regions that exhibit considerable amount of clutter, also referred to as noise. A typical example of a cluttered or noisy region is the presence of a
crowd or an audience in the background in a sports video. Much of the visual data in these regions is indiscernible and carries very little important information about the video. We identify cluttered regions as regions with a high potential for the placement of annotations. These regions are likely non-uniform in their intensity or color. Also, the optical flow in these regions is not homogeneous, and hence cannot be segmented directly. We approach cluttered region identification with the detection of crowds in the background of sports videos in mind. There is considerable variation of intensity in images of crowds of people when camera motion is present. Also, random motion exists in such crowd regions. In this scenario, we observe that cluttered regions exhibit an interesting property. When analyzed for optical flow on a frame-by-frame basis, cluttered regions are composed of a considerable number of optical flow vectors associated with pixels in the region. These flow vectors are typically spread out spatially over the entire region. This type of an optical flow pattern arises due to the combined effect of several factors. Independent motion among the crowd probably plays only a very small role. More important factors are the low resolution of information in these regions, random variation of intensity which is accentuated due to camera motion, and the limitations of optical flow techniques to detect accurate flow patterns in such regions. We characterize cluttered regions by a simple model that captures this artifact. We compute the optical flow for each pixel in the region according to [7]. The range of flow magnitude over all the pixels in the region is then thresholded to classify pixels as static or moving. Let �
be the set of all pixels that are classified as moving in the region R. We compute the mean center position of the set of pixels, � .
�� �
��� �� �
� �� �
��� �� �
�� � � �
We then determine the standard distance deviation � about the mean center of the set of pixels classified as moving.
� �
� �� � �
�
� ���
� � ��
� � �� � ���� �� � ���� ���
�� � � �
� , the standard distance deviation gives a measure of the two-
dimensional spatial dispersion of the moving points. Higher values of � indicate a greater degree of random optical flow, or clutter, in the region. Note that the standard distance deviation measure has a higher likelihood of identifying clutter only if some minimum percentage of pixels are classified as moving. Therefore, we consider only the pixels that satisfy this criterion, i.e., the magnitude of their flow vector is greater than a certain threshold (by default: 50 out of a (normalized) range of 255).
A lower value of � indicates a more concentrated pattern of flow, possibly signifying object motion and is less likely to be classified as clutter. This simple model for clutter can be used to distinguish between multiple regions and provide an estimate of the regions that are composed of a greater degree of indiscernible information or clutter. Figure 4 shows the raw optical flow values for our soccer video frame, from which clutter is derived. Our simple clutter metric works well for the detection of cluttered backgrounds in absence of high frequency textures in large-area foreground motion.
Figure 4: Optical Flow is an important component of our “Clutter” metric. This Image depicts the overall amount of optical flow for each region, and lists the number of pixels (out of a possible 5002) affected by optical flow in each region and the sum of all optical flow vector magnitudes.
A more complicated approach, such as probability modeling for clutter as proposed in [6] may be useful for the more generic case.
5. ELEMENTARY DESCRIPTORS COMBINED In the preceeding sections, we identified and characterized three basic Elementary Perceptual Descriptors to describe regions for annotation placement. We now consider combining these descriptors to perform two specific tasks: placing object-based annotations and global annotations. The underlying objective in both is to select a region among multiple pre-defined subregions in the video to place an annotation in. The requirement is to avoid placing the annotation in regions where it occludes important information in the scene. This requires that the perceptually most suitable (most uniform and least affected by motion, or simply very cluttered) region in the video be selected to place the annotation. We combine the perceptual properties of uniformity in intensity or color, motion, and clutter to compute a placement suitability estimate for each of the considered subregions.
5.1 Placement of Object-based Annotations In this section, we discuss the system component that associates annotations with objects in the video and computes their placement. We assume that scene objects generally exhibit motion and consist of a minimum number of pixels. We enable identification and tracking of scene objects. To identify the object (during preprocessing), the user pauses the video at an arbitrary frame and marks an outline around the object. We employ the active contours approach proposed by Williams and Shah [15] to iteratively minimize the energy function of the initial snake (outline) until the object contour is located. To track the object on a per-frame basis, we apply a combination of feature tracking and optical flow techniques. The point features include the set of snake points that lie on the object contour and additionally chosen features selected inside the object region [10]. The Kanade-Lucas-Tomasi feature tracking algorithm [10] is used
Figure 5: Assuming tracking information for objects in the video (in our case one player and the referee were tracked semiautomatically in video-preprocessing), we can annotate moving objects, taking into account our metrics in closeby regions and a preference for regions opposite the object’s screen motion. Annotations are kept stable on the screen until the metric deteriorates drastically or the distance to the object becomes too large or too small (overlap!) to track point features and optical flow based motion detection. Accurate object tracking is actually one of the limitations of our current system. Tracking has been a well-researched topic in the computer vision community and there exist numerous algorithms, each with its pros and cons. Our focus in this paper is on the placement of annotations. We employ the mentioned techniques with the sole purpose of sustaining our objective of associating annotations with objects as they move in the spatio-temporal video domain. However, a different, more robust tracking module can be integrated into the framework. We now discuss the placement of object-based annotations and present results from our system. Placement of object-based annotations is established by analyzing the elementary properties of homogeneity and motion. Typically, for most of the moving scene objects, scene homogeneity and object motion are the two most important factors that affect annotation placement. We are not likely to find clutter in the immediate neighborhood of moving objects (even though that is possible - such as players shot from ground level with a distant crowd behind them). We combine homogeneity and motion measures such that the estimated placement region for an object annotation maximally avoids occluding other moving objects and is placed in the more uniform regions of the scene. Let denote the value of the combined measure. The combination of the two factors is done as follows:
� �
�
� � �
The region chosen for placement is the one for which the value of the above expression is the highest.
� � ���� �
����
� � � that motion has a greater effect on the region selected (
� ), since non-occlusion of other moving objects is a more important factor. This has the effect that a region that is relatively more uniform but exhibits higher object motion has a lower probability of being picked than a region that is less homogeneous and has a low value for the motion measure. The sequence of images in Figure 5 shows annotation of moving objects in our system. The first image shows how the region around the object is evaluated for the properties of uniformity and motion. This happens for a number (30) of subsequent frames. Since we implement a combination of object following and screen-stabilized annotations (to minimize annotation jitter), we evaluate the initial region over multiple frames in advance. Selecting the best placement for the next 30 frames guarantees that the annotation will be screen-stabilized for at least a second (30 fps video). The best region for that period is then selected and the annotation is placed there (second image). This region is the screen-stabilized location where the annotation stays until a switch is required. When the object drifts too far from the annotation, or the value of the annotation region metric drops due to other objects moving into it, or the tracked object itself collides with the annotation we recompute the current region around the object and select a different placement region (third image). The annotation is then placed in that region until the next re-positioning is required. A line pointing from the annotation towards the object is shown if the object moves far from the annotation, but not far enough to trigger re-positioning (fourth image).
5.2 Placement of Global Annotations
� and are uniformity and motion measures. is normalized to the range � �� . Lower values of � and denote more uniformity and lesser motion respectively. The weight is a positional preference weight that can be used to prioritize specific region choices (such as the top of a video frame) or reduce or magnify the influence of the combined homogeneity/motion value when combining this metric with others (such as with clutter, cf. Section 5.2). The � different regions that are evaluated, are selected based on the annotation size and placement preferences. In the first image of Figure 5, six different regions are considered around the tracked player, and an annotation is finally placed to the immediate left of the player.
This section describes the placement of global annotations, i.e., annotations that indicate some generic information about the scene and are typically not associated with a particular scene object. We approach this aspect by evaluating potential candidate regions for the elementary properties of uniformity, motion, and clutter. The candidate regions that we evaluate in the case of Figure 6 are the four corners and the top and bottom centers of a video frame. The formulation however is generic enough to be applied to other defined regions in a video. In most sports videos, annotations such as game score, channel logo, time elapsed/left, or captions appear in one of the six mentioned regions. Note that the regions do not all have the same shape (even though in this case they cover the same overall area). Annotation material is layed out slightly differently for the corners and the top and bottom centers.
The above combination function selects a region that is a combination of preferredly more uniform intensity and less motion. Note
The placement of such annotations in TV broadcasts is almost always predetermined by convention or a human operator. Not rarely,
�
Figure 6: Placement of a global annotation (game score and time) for two different values of our weighting parameter . In the left image the annotation gets placed with a preference for uniform regions, in the right video, we have a preference for cluttered background.
Elementary Descriptor Uniformity (Mu) Motion (Mm) Clutter (Mc)
Table 1: Elementary descriptor values for six pre-defined regions Upper Left Upper Middle Upper Right Lower Left Lower Middle 3.81 4.18 6.70 0.52 0.69 0.37 0.38 0.46 0.00 0.02 3.58 4.87 10.93 0.00 0.22
Combined Measure M
Table 2: Final value for the combined measure for region Upper Left Upper Middle Upper Right Lower Left Lower Middle 3.58 4.87 10.93 13.28 9.72
such annotations actually occlude part of the game action. Our automatic placement of these annotations aims to minimize such occlusions. We use a quantitative perceptual measure for the candidate regions, evaluating the regions over time to find a global best region (assuming that we do not want to switch the annotation to a different place at some point in the video). Parameterized formulations of the “goodness” characteristics are useful in adapting the results to the particular application. We use the measures for homogeneity, motion, and clutter as described in Section 5. In the regions that we evaluate there is a high possibility of a region being either very homogeneous (the soccer field / ice rink) or very cluttered (background crowds). Hence, the formulation needs to be such that if either of these are detected, the region should have a strong value for the final measure. Secondly, in sports videos, most of the action happens in the foreground. The top part of the video can therefore be preferred by individual weights. Placement of an annotation also requires motion to be an important factor. If there is relatively strong motion in a region, for example because of a moving player crossing the region, the region should be evaluated lower than others. We employ the following combination of elementary measures to compute a perceptual value for each region. The value for the clutter measure is computed for each candidate region in the scene. If the clutter value is greater than a user-defined threshold (video specific), we assign that value as the final measure. If clutter is below that threshold, then we compute a measure for the region that takes into account the uniformity and motion in the region. Our earlier formulation for object-based annotations
Lower Right 0.10 0.00 0.00
Lower Right 63.52
captures this idea and we apply the same for the global annotations case:
� �
�
� � �
� , , and are values of the measure for uniformity, motion, and clutter respectively. The regions are then ranked in increasing order of the value of , higher values indicating regions with a greater potential for placement. In the above expression, lower values of � indicate greater uniformity. Hence a region with greater degree of uniformity will have larger values for the above expression and correspondingly a higher rank if the placement order. A higher value of the motion measure results in a lesser value for the overall measure. Hence in the case where a region overlaps with moving objects, the effect of uniformity of the region decreases. Note that we can use the weighting factor to emphasise or deemphasize the motion/homogeneity measure in comparison with the regions that are characterized by clutter. A low value of (with a clutter threshold that identifies at least one other region as mostly clutter) favors placement in the cluttered region, whereas a high value of favors homogeneity/low motion.
6. RESULTS We presented some of our results for annotating objects in the scene in Section 5.1. Here we evaluate our formulation as described in Section 5.2, discussing results for the placement of global annotations. To restate, placement for global annotations is determined as below:
If else
� � then
�
� �
�
� � �
The criterion for determining the value for the final measure is twofold. If the estimate for clutter in a region is greater than a threshold � , then the final value is taken as the value for clutter. If clutter is not a clear winner in a region, then the final value is a value dependent on the uniformity and motion metric values as shown in the equation above. We analyze the six pre-defined regions at the corners and long edges of the screen. The regions are shown in Figure 6. Table 5.2 lists the values for each elementary measure for each of the six regions. From the table, we clearly see that clutter is dominant in the regions at the top of the screen. The threshold value for clutter can be used to extract regions with a high probability of clutter. The clutter values for the lower regions are clearly not comparable to the values for regions at the top. We then apply the combined measure that describes uniformity and motion and determine a ranking for the regions. The values for this combined measure are shown in Table 5.2, for a clutter threshold of 3 (also shown in Figure 6, left image). As we see in the table, the region to the lower right part of the screen has the highest value. Perceptually, too, this region has the most uniformity and least motion. We can thus rank regions based on their values. By varying the threshold for clutter and the value of the parameter in equation 5.2, we can control the ordering of regions and the importance attached to individual measures. For example, if cluttered regions are important for the purpose of an application, the clutter threshold can be lowered to extract more regions that indicate the property. If on the other hand, we are interested in regions that show the least motion and have homogeneity, the value of can be raised to elevate the rank of such regions. Thus a parametric ordering of different regions in the video is possible. The result of the ordering for the six regions is shown in Figure 6. The right image shows promotion of cluttered regions by lowering the value of from 7 to 1. Now, the upper right region has the highest “goodness” value (10.93). We placed the annotation in the upper middle region, however, since this region had the highest aggregate value for the whole duration of the video clip (shown values are for this frame only).
using the metrics presented in this paper. Clutter has a lower importance in that domain, but with the clutter threshold set high, the relative placement indication values for the depicted grid of regions are useful for avoiding the two performers and some non-uniform foreground objects (e.g. table in the lower left corner). This example illustrates the potential of our placement techniques for interactive TV applications, in which the positioning of annotations has to happen dynamically (e.g. on user request). One shortcoming of our evaluation model is its reliance on camera motion for identifying clutter. If the camera is standing still in, e.g., a soccer video, the crowd in the background is not reliably recognized as clutter anymore. Instead, it is classified as simply an inhomogeneous region, and therefore disregarded as a potential candidate for annotation placement. We intend to extend our clutter model so it is able to recognize cluttered regions even in the absence of camera motion. We would like to develop fast nonparametric segmentation algorithms that work with the different metrics we design and allow for arbitrarily shaped (non-rectangular) placement regions. Also, we are considering additional elementary descriptors, such as for example uniform texture.
8. REFERENCES [1] 2d3 Ltd. boujou. http://www.2d3.com, 2003. [2] Rolf Adams and Leanne Bischof. Seeded region growing. IEEE Transactions on Pattern Analysis and Machine Intelligence, 16(6):641–647, 1994. [3] Ronald Azuma and Chris Furmanski. Evaluating label placement for augmented reality view management. In IEEE/ACM Int’l Symp. on Mixed and Augmented Reality (ISMAR 2003), pages 66–75, Tokyo, Japan, 2003. [4] Blaine Bell, Steven Feiner, and Tobias H¨ollerer. View management for virtual and augmented reality. In ACM Symposium on User Interface Software and Technology (UIST’01), pages 101–110, Orlando, FL, USA, 2001. [5] Dorin Comaniciu and Peter Meer. Robust analysis of feature spaces: Color image segmentation. In Proc. of the 1997 IEEE Conf. on Computer Vision and Pattern Recognition, pages 750–755, 1997. [6] Ulf Grenander and Anuj Srivastava. Probability models for clutter in natural images. IEEE Transactions on Pattern Analysis and Machine Intelligence, 23(4):424–429, 2001. [7] B.K.P. Horn and B.G. Schunck. Determining optical flow. Artificial Intelligence, 17(1-3):185–203, August 1981. [8] Princeton Video Image. Virtual Product Integration. http://www.pvi-inc.com/, 2003. [9] Orad. Sports Production Systems. http://www.orad.tv/, 2003.
7.
CONCLUSIONS AND FUTURE WORK
We have presented a framework for the semi-automated placement of annotations in arbitrary videos. Our decision for rating regions in the videos is based on elementary region properties - homogeneity, motion, and clutter. We presented a simple model for clutter that is based on the optical flow field in such regions. We also discussed methods to combine the elementary properties so as to evaluate an arbitrary region in the video. These methods were applied to the specific tasks of annotating moving objects in the video and placing global annotations. Even though we based our metrics mostly on our experiences with sports videos (tests with 8 different soccer videos and several hockey, ski, and racing videos), the results transfer to other domains. Figure 1 for example shows the application of an interactive “Pop Up Music Video” (after the popular VH-1 series). The position of an annotation that pops up on user request is automatically determined
[10] Jianbo Shi and Carlo Tomasi. Good features to track. In Proc. of the Conf. on Computer Vision and Pattern Recognition, pages 593–600, Los Alamitos, CA, USA, 1994. [11] Stephen M. Smith and J. Michael Brady. Susan - a new approach to low level image processing. Int’l journal of Computer Vision, 23(1):45–78, 1997. [12] Sportvision. 1st and Ten. http://www.sportvision.com/, 2003. [13] Sportvision. Race F/X. http://www.sportvision.com/, 2003. [14] Symah Vision. Sports Enhancements. http://www.symah-vision.fr/edito.html/, 2003. [15] Donna J. Williams and Mubarak Shah. A fast algorithm for active contours and curvature estimation. CVGIP: Image Understanding, 55(1):14–26, 1992.