Semi-automatic wavelet soft-thresholding applied to digital image error level analysis Daniel C Jeronymo Corresp. 1
1
Computer Engineering Department, Federal University of Technology - Paraná, Toledo, PR, Brazil
Corresponding Author: Daniel C Jeronymo Email address:
[email protected]
In this paper a method for detection of image forgery in lossy compressed digital images known as error level analysis (ELA) is presented and it's noisy components are filtered with automatic wavelet soft-thresholding. With ELA, a lossy compressed image is recompressed at a known error rate and the absolute differences between these images, known as error levels, are computed. This method might be weakened if the image noise generated by the compression scheme is too intense, creating the necessity of noise filtering. Wavelet thresholding is a proven denoising technique which is capable of removing an image's noise avoiding altering other components, like high frequencies regions, by thresholding the wavelet transform coefficients, thus not causing blurring. Despite its effectiveness, the choice of the threshold is a known issue. However there are some approaches to select it automatically. In this paper, a lowpass filter is implemented through wavelet thresholding, attenuating error level noises. An efficient method to automatically determine the threshold level is used, showing good results in threshold selection for the presented problem. Standard test images have been doctored to simulate image tampering, error levels for these images are computed and wavelet thresholding is performed to attenuate noise. Results are presented, confirming the method's efficiency at noise filtering while preserving necessary error levels.
PeerJ Preprints | https://doi.org/10.7287/peerj.preprints.2619v1 | CC BY 4.0 Open Access | rec: 6 Dec 2016, publ:
Semi-Automatic wavelet soft-thresholding applied to digital image error level analysis
1
2
3
Daniel Cavalcanti Jeronymo1
4
1 Federal
University of Technology - Parana´ (UTFPR), Toledo Campus, Brazil
6
Corresponding author: Daniel Cavalcanti Jeronymo1
7
Email address:
[email protected]
8
ABSTRACT
5
9 10 11 12 13 14 15 16 17 18 19 20 21 22 23
24
25 26 27 28 29 30 31 32 33 34 35 36 37 38 39 40 41 42 43 44 45 46
In this paper a method for detection of image forgery in lossy compressed digital images known as error level analysis (ELA) is presented and it’s noisy components are filtered with automatic wavelet soft-thresholding. With ELA, a lossy compressed image is recompressed at a known error rate and the absolute differences between these images, known as error levels, are computed. This method might be weakened if the image noise generated by the compression scheme is too intense, creating the necessity of noise filtering. Wavelet thresholding is a proven denoising technique which is capable of removing an image’s noise avoiding altering other components, like high frequencies regions, by thresholding the wavelet transform coefficients, thus not causing blurring. Despite its effectiveness, the choice of the threshold is a known issue. However there are some approaches to select it automatically. In this paper, a lowpass filter is implemented through wavelet thresholding, attenuating error level noises. An efficient method to automatically determine the threshold level is used, showing good results in threshold selection for the presented problem. Standard test images have been doctored to simulate image tampering, error levels for these images are computed and wavelet thresholding is performed to attenuate noise. Results are presented, confirming the method’s efficiency at noise filtering while preserving necessary error levels.
1 INTRODUCTION Since late years, even before 1990, altering images digitally has become a disseminated practice, much due to the personal computer popularization. For example, the number of tampered pictures, by definition images where part of its original content has been some way altered, removed or combined with other images, synthetic textures or even computer rendered graphics Lin et al. (2009), reached 10% of all photos published in the United States around the year 1989 Amsberry (2009). In addition, for a number of reasons, some of those are intended to deceive the viewer in ways that hurt legal and moral principles guaranteed by law, creating a number of issues. The advent of powerful tools with that purpose turns the detection in a very difficult process even for professionals. The techniques for image forgery are many, Lin et al. (2009) names a few, such as, simple cutting and pasting, known as cloning Ng and Chang (2004), matting for perfect blending Chuang et al. (2002); Sun et al. (2004), graph cut for finding optimal composition boundaries Kwatra et al. (2003); Li et al. (2004), texture synthesis Kwatra et al. (2003); Sun et al. (2005); Bugeau and Bertalm´ıo (2009) and variational approaches for synthesis of new content Bertalm´ıo et al. (2000); Bugeau et al. (2010); Bugeau and Bertalm´ıo (2009); P´erez et al. (2003). For that reason, techniques for detection of tampered images have attracted the attention of the scientific community, current image forgery detection is achieved through either active or passive (blind) approaches. Active approaches depend on the usage of watermarks or signatures Yu et al. (2005); Kong et al. (2004); Amornraksa and Janthawongwilail (2006); Wang et al. (2008). On the other hand, passive approaches do not need any explicit a priori information about the image, constituting a new direction of great interest in the field of image forensics Mahdian and Saic (2009); Sloan and Hernandez-Castro (2015). However, considering current art, there is no complete solution to automatically and blindly determine image forgeries Lin et al. (2009).
PeerJ Preprints | https://doi.org/10.7287/peerj.preprints.2619v1 | CC BY 4.0 Open Access | rec: 6 Dec 2016, publ:
47 48 49 50 51 52 53 54 55 56 57 58 59 60 61 62 63 64 65 66 67 68 69 70 71 72 73 74 75 76 77 78 79 80 81 82 83 84 85 86 87 88 89 90 91 92 93 94 95 96 97 98 99 100 101
Passive blind image forensics are well documented, featuring surveys such as Farid (2009b); Ng et al. (2006). Current methods dwell on detecting cloning, which is essentially cutting and pasting in an image Fridrich et al. (2003); Popescu and Farid (2004a); resampling, originated from processes of resizing, rotating or stretching portions of pixels Popescu and Farid (2004b); Kirchner (2008); Mahdian and Saic (2007); Prasad and Ramakrishnan (2006); splicing or matting, the process of combining two or more images into a single composite, usually taking care to match borders Farid (1999); Ng and Chang (2004) and statistical analysis, where statistical properties of natural images are exploited to detect image manipulation Farid and Lyu (2003); Bayram et al. (2005, 2006); Mahdian and Saic (2009); Lin et al. (2009). Error level analysis (ELA) is a passive blind image forensic method created by Krawetz (2007), although sometimes related to others authors due to failures in recent art Farid (2009a); Zhao et al. (2011) to properly cite and acknowledge the original author of this method. This technique takes advantage of lossy compression schemes of tampered images to detect forgeries. Lossy compression schemes perform a trade off between data quality and compressed data size, at first, this might seem as a drawback to a forensic analyst due to the loss of evidence associated with the trade off, however, different quality levels in an image are evidence themselves. An original image possesses an unique quality level, a property originated both from its acquisition and compression scheme. When such an image is tampered, either through cloning, splicing or matting, the original content is combined with foreign content, which will possess different quality levels, being the original content usually already compressed and the foreign uncompressed. ELA works by taking an image compressed with a lossy compression scheme, intentionally recompressing at a known error rate and then computing the absolute difference between the first image and its recompression. This difference between images are the error levels associated with the original pixels, these error levels, seen as an amount of change, are directly associated with compression loss. If the amount of change is small, the pixel has reached its local minima for error at the determined error rate, hence it is likely to be already compressed, on the other hand, if there is a large amount of change, then the pixels were not at their local compression minima and are likely to be foreign Krawetz (2007). ELA’s absolute differences are computed across all spatial frequencies in an image. This causes the error levels to mimic the spatial frequencies of the pixels they represent. That is, low frequency regions, regions where the tonal transition is smooth, such as uniform skies or skin, will present lower amounts of change while high frequency regions, where the tonal transition is abrupt, such as fur, grass or hair, will present higher amounts of change. These fluctuations might confuse a forensic analyst, since both high frequency and foreign content will present high amounts of change. Regarding this problem, a windowed absolute differences scheme is presented in literature Farid (2009a) to compensate the fluctuations created by both low and high frequencies. Error levels are noisy by essence since the absolute differences are computed across all spatial frequencies in the image. This causes the error levels to mimic the distribution of the spatial frequencies present in the image, increasing the difficulty in the interpretation of error levels. Noise, as any sharp changes in an image’s intensity, implies in high-frequency components, thus, lowpass filtering is a common application of noise removal in image analysis Seul et al. (2000). Several convolution based methods of noise attenuation are present in image analysis literature such as Sun et al. (1994); Nodes and Gallagher Jr. (1982); Dugad and Ahuja (1999); Gonzalez and Woods (2001); Lim (1990); Gilboa et al. (2004); Salinas and Fern´andez (2007); Fern´andez et al. (2005); Bernardes et al. (2010), however, the greatest downside of these methods is the blurring of images. On the other hand, Wavelets thresholding is a process that uses a forward wavelet transform, filters the noise by thresholding the resulting coefficients and then applying the inverse transform to recover the image. It is able to effectively remove noise components without interfering with other signal components present in an image, that is, without causing blurring Donoho (1993). Although its success in image processing Arandiga et al. (2010); De Stefano et al. (2004); Heric and Zazula (2007), determining the most adequate threshold level is a current issue because the thresholding might affect components other than noise. With this issue in focus in recent wavelet thresholding literature, several automatic and adaptive methods are proposed to determine the threshold, such as Deivalakshmi 2/12
PeerJ Preprints | https://doi.org/10.7287/peerj.preprints.2619v1 | CC BY 4.0 Open Access | rec: 6 Dec 2016, publ:
102 103 104 105 106 107 108 109 110 111 112 113 114 115
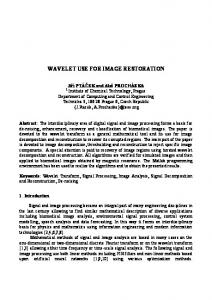
and Palanisamy (2016); Ju et al. (2010); Yong and Qiang (2010); Liu et al. (2008); Madeiro et al. (2007); Poornachandra (2008); Wu et al. (2005); Chen et al. (2007); Zhang et al. (2002); Kovesi (1999), to cite a few. In this paper, standard images such as the cameraman, farm, lena and peppers, are originally taken from a lossless compression format, TIFF, in 512x512 resolution and converted to a lossy compression format, JPEG, to simulate originally acquired images, i.e., from a camera. These images are then doctored to represent forgeries. Error levels are computed and the noise in them are removed using wavelet thresholding with its threshold automatically determined by the method presented in Kovesi (1999). A summary of the method is presented in Figure 1. The results achieved show that the ELA technique is indeed very effective in detecting the forgeries and despite the noisy images generated in the ELA process, filtering through wavelet thresholding with automatic thresholding selection proved to be an effective approach in denoising, making easier to detect the forgeries. Therefore, the proposed method has its validity attested and could be used to diminish the attempts to moral rights by helping forensic professionals to detect a forged image.
Figure 1. Summary and work flow of the method.
121
The rest of this paper is organized as follows: section 2 summarizes the proposed method, detailing the application of error level analysis, presenting standard test images, their doctored versions for this paper and the associated error levels; section 3 presents the process of wavelet thresholding and a scheme for automatic threshold selection; section 4 presents results obtained by the automatic wavelet thresholding; ultimately, in section 5, steps of the method are enumerated, its efficiency discussed and future works addressed.
122
2 ERROR LEVEL ANALYSIS
116 117 118 119 120
123 124 125 126 127 128
Error level analysis (ELA) is a passive blind image forensic method created by Krawetz Krawetz (2007) which takes advantage of the lossy compression schemes of tampered images to identify its forgery. The original quality level of a image is a unique feature itself, thus, any alteration process leaves its traces behind also in it. Briefly, ELA works by using an image compressed by a lossy scheme and recompressing it with a known error rate, then, it computes the absolute difference between the analyzed image and the recompressed one. Formally, ELA is described as follows. Error levels, ELA(n1 , n2 ) where n1 and n2 are row and column indices, can be represented by ELA(n1 , n2 ) = |X(n1 , n2 ) − Xrc (n1 , n2 )| ,
(1)
for each color channel, where X is the image suspected of forgery and Xrc is the recompressed image. Total error levels are error levels averaged across all color channels, as in ELA(n1 , n2 ) = 129
1 3 ∑ |X(n1 , n2 , i) − Xrc (n1 , n2 , i)| , 3 i=1
(2)
where i = 1, 2, 3, for a RGB image. 3/12
PeerJ Preprints | https://doi.org/10.7287/peerj.preprints.2619v1 | CC BY 4.0 Open Access | rec: 6 Dec 2016, publ:
130 131 132 133 134 135 136 137 138 139 140 141 142
This difference between images are the error levels associated with the original pixels, these error levels, seen as an amount of change, are directly associated with compression loss. If the amount of change is small, the pixel has reached its local minima for error at the determined error rate. However, if there is a large amount of change, then the pixels are not at their local minima and are likely to be foreign Krawetz (2007). ELA’s absolute differences are computed across all spatial frequencies in an image. This causes the error levels to mimic the spatial frequencies of the pixels they represent. That is, low frequency regions, regions where the tonal transition is smooth, such as uniform skies or skin, will present lower amounts of change while high frequency regions, where the tonal transition is abrupt, such as fur, grass or hair, will present higher amounts of change. These fluctuations might confuse a forensic analyst, since both high frequency and foreign content will present high amounts of change. Regarding this problem, a windowed absolute differences scheme is presented in literature Farid (2009a) to compensate the fluctuations created by both low and high frequencies.
Figure 2. Figure a) shows the original cameraman image, b) shows the forgery, with a zeppelin in the background and c) shows ELA for the doctored image.
Figure 3. Figure a) shows the original farm image, b) shows the forgery, with a tiger in the background and c) shows ELA for the doctored image. 143 144 145 146 147 148
Figures 2,3,4,5 present the cameraman, farm, lena and peppers images, respectively. Exhibited in these figures are the original and doctored images. ELA is presented for the doctored images in the 512x512 resolution. Figure 2 shows ELA’s weakness in gray-scale images, since the level of information is lower, so are the precision of error levels, thus, error levels created by high frequency components and error levels created by different qualities are indistinguishable. This problem is not present in any of the color images.
4/12 PeerJ Preprints | https://doi.org/10.7287/peerj.preprints.2619v1 | CC BY 4.0 Open Access | rec: 6 Dec 2016, publ:
Figure 4. Figure a) shows the original lena image, b) shows the forgery, with a flower on her hat and contrast enhanced eyes and lips and c) shows ELA for the doctored image.
Figure 5. Figure a) shows the original peppers image, b) shows the forgery, with a kitchen on the background and c) shows ELA for the doctored image.
5/12 PeerJ Preprints | https://doi.org/10.7287/peerj.preprints.2619v1 | CC BY 4.0 Open Access | rec: 6 Dec 2016, publ:
149 150 151 152 153 154 155 156 157 158 159 160
3 AUTOMATIC WAVELET THRESHOLD SELECTION Wavelet thresholding, also known as wavelet shrinkage, is the process of converting a signal to a time-scale domain through a forward wavelet transform, wavelet coefficients are then thresholded according to a certain criteria and the reverse wavelet transform converts the wavelet coefficients back to the time-space domain of the image. Wavelets have proved very efficient at separating signal and noise, although no particular wavelet has been shown to be more effective at denoising than others, however, threshold choice is a delicate issue. Here is presented a short review of the method described in Kovesi (1999) to automatically determine the threshold. In Kovesi (1999), the Rayleigh distribution is utilized for estimation of the magnitude of response vectors in log Gabor filters, considering 2D Gaussian noise in the complex plane. This distribution is defined by 2
R(x) = 161 162
(3)
where σg2 is the variance of the 2D Gaussian distribution which describes the position of the filter’s response vectors. The mean of this distribution is
µr = σg 163
x −x 2 e 2σg , σg2
r
π , 2
(4)
and the variance is 4−π 2 σg . (5) 2 Threshold choice is then a matter of choosing a value which is a scale of the standard deviation beyond the mean noise, as in σr2 =
164 165
T = µr + k · σr , 166 167
where k controls how beyond the noise’s mean is the standard deviation. A reliable estimate of the mean of noise amplitude distribution can be determined by 1 E(AN ) = 2
168 169 170 171 172 173 174
(6)
s
−π · median , ln( 12 )
(7)
where AN is the N ′th wavelet transform of the image. Smallest scales of AN provide the best result, since they contain the most noise, further discussion can be seen in Kovesi (1999). In fact, noise power is elevated at small scales Xu et al. (1994), at it can be seen in the wavelet decomposition of the cameraman error levels, in Figure 6. That shows the wavelet scales decomposition, it is clear that at small scales seen in the smaller images in the upper left side the noise is greater than the larger scales. The noise mean µr is effectively equal to E(AN ) and the variance, σr can be calculated by combining equation 5 with E(AN ) σg = p π ,
(8)
2
175
resulting in
(4 − π) · E(AN ) . (9) π This statistical approach to the estimation of the threshold, T , through equation 6, proves successful in removing noise from wavelet transforms. σr =
176 177
6/12 PeerJ Preprints | https://doi.org/10.7287/peerj.preprints.2619v1 | CC BY 4.0 Open Access | rec: 6 Dec 2016, publ:
Figure 6. Wavelet decomposition of the cameraman error levels, showing greater noise power in small scales.
178
4 RESULTS
194
Soft-thresholding is utilized to ensure avoiding the introduction of frayed edges, typical of wavelet thresholding. The standard test images have been wavelet shrinked with the automatic threshold selection described in the previous section. The orthogonal Daubechies wavelet with a vanishing moment of four was used for the wavelet transforms. For the cameraman image, results are presented in figure 7. Despite ELA’s failure to distinguish between the low resolution error levels in the gray scale image, the noise removal results are adequate. The value of the k scale factor used for this image was 4. For the farm image, results are presented in figure 8. Overall noise has been greatly attenuated and the tiger stands out from the background. However, high frequency spatial characteristics of the image such as the vegetation increase error levels throughout the entire image. For the lena image, results are presented in figure 9. The image’s interpretation is difficult due to error levels created from the high frequency features such as the fur, however, the flower stands out. Minor modifications such as the contrast enhanced eyes and lips are not distinguishable. For the peppers image, results are presented in figure 10. This image presents the best results in both noise removal and error level identification. The kitchen at the background completely stands out, canceling the peppers at the front.
195
5 CONCLUSION
179 180 181 182 183 184 185 186 187 188 189 190 191 192 193
196 197 198 199 200 201 202 203 204 205
This paper presents the not well known method Error Level Analysis, correctly identifying its original author despite omission in recent literature, and investigates the usage of wavelet transforms in error level noise removal. A method to automatically select a threshold level is used, from Kovesi (1999), showing good results in this application. Standard images such as the cameraman, farm, lena and peppers, are doctored to represent forgeries. These images are then studied with error level analysis and compared with the error level analysis of lower resolutions of these same images. It’s noted that ELA fails to process gray scale images due to low resolution of error levels but graciously succeeds in color images. Afterwards, noise removal is performed, through wavelet thresholding, transforming the images from the time-space representation to time-scale, filtering the noise through wavelet’s coefficients thresholding, 7/12
PeerJ Preprints | https://doi.org/10.7287/peerj.preprints.2619v1 | CC BY 4.0 Open Access | rec: 6 Dec 2016, publ:
Figure 7. The cameraman image has been wavelet thresholded with a k scale of 4.
Figure 8. The farm image has been wavelet thresholded with a k scale of 6.
8/12 PeerJ Preprints | https://doi.org/10.7287/peerj.preprints.2619v1 | CC BY 4.0 Open Access | rec: 6 Dec 2016, publ:
Figure 9. The lena image has been wavelet thresholded with a k scale of 8.
Figure 10. The peppers image has been wavelet thresholded with a k scale of 20.
9/12 PeerJ Preprints | https://doi.org/10.7287/peerj.preprints.2619v1 | CC BY 4.0 Open Access | rec: 6 Dec 2016, publ:
209
where the threshold value is statistically calculated from the image, and performing the reverse wavelet transform on the image. Empirically, results show the approach successfully attenuates noise and improves error levels, better identifying regions of the image where tampering has occurred.
210
REFERENCES
206 207 208
211 212 213 214 215 216 217 218 219 220 221 222 223 224 225 226 227 228 229 230 231 232 233 234 235 236 237 238 239 240 241 242 243 244 245 246 247 248 249 250 251 252 253 254 255 256 257 258 259
Amornraksa, T. and Janthawongwilail, K. (2006). Enhanced images watermarking based on amplitude modulation. Image and Vision Computing, 24(2):111–119. Amsberry, C. (2009). Alterations of photos raise host of legal, ethical issues. The Wall Street Journal, pages Section B, 1. Arandiga, F., Cohen, A., Donat, R., and Matei, B. (2010). Edge detection insensitive to changes of illumination in the image. Image and Vision Computing, 28(4):553–562. Bayram, S., Avcibas, I., Sankur, B., and Memon, N. (2005). Image manipulation detection with binary similarity measures. In in Proceedings of Conference of European Signal Processing, Antalya, Turkey. Bayram, S., Avcibas, I., Sankur, B., and Memon, N. (2006). Image manipulation detection. Journal of Electronic Imaging, 15. Bernardes, R., Maduro, C., Serranho, P., Ara´ujo, A., Barbeiro, S., and Cunha-Vaz, J. (2010). Improved adaptive complex diffusion despeckling filter. Opt. Express, 18(23):24048–24059. Bertalm´ıo, M., Sapiro, G., Caselles, V., and Ballester, C. (2000). Image inpainting. In SIGGRAPH, pages 417–424, New Orleans, Louisiana, USA. Bugeau, A. and Bertalm´ıo, M. (2009). Combining texture synthesis and diffusion for image inpainting. In VISAPP 2009 - Proceedings of the Fourth International Conference on Computer Vision Theory and Applications, Lisboa, Portugal, February 5-8, 2009 - Volume 1, pages 26–33, Lisbon, Portugal. Bugeau, A., Bertalm´ıo, M., Caselles, V., and Sapiro, G. (2010). A comprehensive framework for image inpainting. IEEE Transactions on Image Processing, 19(10):2634–2645. Chen, Y., Lei, L., Ji, Z.-C., and Sun, J.-F. (2007). Adaptive wavelet threshold for image denoising by exploiting inter-scale dependency. In Huang, D.-S., Heutte, L., and Loog, M., editors, Advanced Intelligent Computing Theories and Applications. With Aspects of Theoretical and Methodological Issues, volume 4681 of Lecture Notes in Computer Science, pages 869–878. Springer Berlin / Heidelberg. Chuang, Y. Y., Agarwala, A., Curless, B., Salesin, D. H., and Szeliski, R. (2002). Video matting of complex scenes. In Proceedings of the 29th annual conference on Computer graphics and interactive techniques, SIGGRAPH ’02, pages 243–248, San Antonio, Texas. ACM. De Stefano, A., White, P. R., and Collis, W. B. (2004). Film grain reduction on colour images using undecimated wavelet transform. Image and Vision Computing, 22(11):873–882. Deivalakshmi, S. and Palanisamy, P. (2016). Removal of high density salt and pepper noise through improved tolerance based selective arithmetic mean filtering with wavelet thresholding. {AEU} International Journal of Electronics and Communications, 70(6):757 – 776. Donoho, D. L. (1993). Nonlinear wavelet methods for recovery of signals, densities, and spectra from indirect and noisy data. In In Proceedings of Symposia in Applied Mathematics, pages 173–205. American Mathematical Society. Dugad, R. and Ahuja, N. (1999). Video denoising by combining kalman and wiener estimates. In Proc. of the International Conference on Image Processing(ICIP), pages 152–156, Kobe, Japan. Farid, H. (1999). Detecting digital forgeries using bispectral analysis. Technical report, MIT AI Memo AIM-1657, MIT. Farid, H. (2009a). Exposing digital forgeries from jpeg ghosts. Trans. Info. For. Sec., 4:154–160. Farid, H. (2009b). A survey of image forgery detection. IEEE Signal Processing Magazine, 2(26):16–25. Farid, H. and Lyu, S. (2003). Higher-order wavelet statistics and their application to digital forensics. Computer Vision and Pattern Recognition Workshop, 8:94. Fern´andez, D. C., Salinas, H. M., and Puliafito, C. A. (2005). Automated detection of retinal layer structures on optical coherence tomography images. Opt. Express, 13(25):10200–10216. Fridrich, A. J., Soukal, B. D., and Luk´as˘, A. J. (2003). Detection of copy-move forgery in digital images. In in Proceedings of Digital Forensic Research Workshop, Cleveland, Ohio,USA. Gilboa, G., Member, S., Sochen, N., and Zeevi, Y. Y. (2004). Image enhancement and denoising by complex diffusion processes. IEEE Transactions on Pattern Analysis and Machine Intelligence, 26:1020–1036. 10/12
PeerJ Preprints | https://doi.org/10.7287/peerj.preprints.2619v1 | CC BY 4.0 Open Access | rec: 6 Dec 2016, publ:
260 261 262 263 264 265 266 267 268 269 270 271 272 273 274 275 276 277 278 279 280 281 282 283 284 285 286 287 288 289 290 291 292 293 294 295 296 297 298 299 300 301 302 303 304 305 306 307 308 309 310 311 312 313 314
Gonzalez, R. C. and Woods, R. E. (2001). Digital Image Processing. Addison-Wesley Longman Publishing Co., Inc., Boston, MA, USA, 2nd edition. Heric, D. and Zazula, D. (2007). Combined edge detection using wavelet transform and signal registration. Image and Vision Computing, 25(5):652–662. Ju, H., Shijing, W., and Jiantao, L. (2010). Application of wavelet transform threshold in the de-nosing of fiber optic gyroscopes. In Systems and Control in Aeronautics and Astronautics (ISSCAA), 2010 3rd International Symposium on, pages 1165 –1168, Harbin, China. Kirchner, M. (2008). Fast and reliable resampling detection by spectral analysis of fixed linear predictor residue. In in ACM Multimedia and Security Workshop, pages 11–20, Oxford, UK. Kong, X. W., Liu, Y., Liu, H. J., and Yang, D. L. (2004). Object watermarks for digital images and video. Image and Vision Computing, 22(8):583–595. Kovesi, P. (1999). Phase preserving denoising of images. In The Australian Pattern Recognition Society Conference: DICTA’99, pages 212–217, Perth WA. ACM. Krawetz, N. (2007). A picture’s worth... digital image analysis and forensics. Technical report, Black Hat Briefings, USA. Kwatra, V., Sch¨odl, A., Essa, I., Turk, G., and Bobick, A. (2003). Graphcut textures: image and video synthesis using graph cuts. ACM Trans. Graph., 22:277–286. Li, Y., Sun, J., Tang, C.-K., and Shum, H.-Y. (2004). Lazy snapping. ACM Trans. Graph., 23:303–308. Lim, J. S. (1990). Two-dimensional signal and image processing. Prentice-Hall, Inc., Upper Saddle River, NJ, USA. Lin, Z., He, J., Tang, X., and Tang, C.-K. (2009). Fast, automatic and fine-grained tampered jpeg image detection via dct coefficient analysis. Pattern Recognition, 42:2492–2501. Liu, C., Szeliski, R., Kang, S. B., Zitnick, C. L., and Freeman, W. T. (2008). Automatic estimation and removal of noise from a single image. Madeiro, J. P. V., Cortez, P. C., Oliveira, F. I., and Siqueira, R. S. (2007). A new approach to qrs segmentation based on wavelet bases and adaptive threshold technique. Medical Engineering & Physics, 29(1):26 – 37. Mahdian, B. and Saic, S. (2007). On periodic properties of interpolation and their application to image authentication. In Information Assurance and Security, International Symposium on, pages 439–446, Los Alamitos, CA, USA. IEEE Computer Society. Mahdian, B. and Saic, S. (2009). Using noise inconsistencies for blind image forensics. Image Vision Computing, 27:1497–1503. Ng, T. T. and Chang, S. F. (2004). Blind detection of photomontage using higher order statistics. In in IEEE International Symposium on Circuits and Systems, pages 688–691, Vancouver, Canada. Ng, T. T., Chang, S. F., Lin, C. Y., and Sun, Q. (2006). Passive-blind image forensics. In In Multimedia Security Technologies for Digital Rights. Nodes, T. and Gallagher Jr., N. (1982). Center weighted median filters: Some properties and their applications in image processing. IEEE Transactions on Acoustics, Speech and Signal Processing, 30(5):739–746. P´erez, P., Gangnet, M., and Blake, A. (2003). Poisson image editing. ACM Transactions on Graphics (SIGGRAPH’03), 22(3):313–318. Poornachandra, S. (2008). Wavelet-based denoising using subband dependent threshold for ecg signals. Digital Signal Processing, 18(1):49 – 55. Popescu, A. C. and Farid, H. (2004a). Exposing digital forgeries by detecting duplicated image regions. Technical report, Department of Computer Science, Dartmouth College. Popescu, A. C. and Farid, H. (2004b). Exposing digital forgeries by detecting traces of re-sampling. IEEE Transactions on Signal Processing, 53:758–767. Prasad, S. and Ramakrishnan, K. R. (2006). On resampling detection and its application to image tampering. In IEEE International Conference on Multimedia and Exposition, pages 1325–1328, Toronto, Canada. IEEE. Salinas, H. M. and Fern´andez, D. C. (2007). Comparison of PDE-Based Nonlinear Diffusion Approaches for Image Enhancement and Denoising in Optical Coherence Tomography. IEEE Transactions on Medical Imaging, 26(6). Seul, M., O’Gorman, L., and Sammon, M. J. (2000). Practical algorithms for image analysis: description, examples, and code. Cambridge University Press, New York, NY, USA.
11/12 PeerJ Preprints | https://doi.org/10.7287/peerj.preprints.2619v1 | CC BY 4.0 Open Access | rec: 6 Dec 2016, publ:
315 316 317 318 319 320 321 322 323 324 325 326 327 328 329 330 331 332 333 334 335 336 337 338
Sloan, T. and Hernandez-Castro, J. (2015). Forensic analysis of video steganography tools. PeerJ Computer Science, 1:e7. Sun, J., Jia, J., keung Tang, C., and yeung Shum, H. (2004). Poisson matting. ACM Transactions on Graphics, 23:315–321. Sun, J., Yuan, L., Jia, J., and Shum, H.-Y. (2005). Image completion with structure propagation. ACM Trans. Graph., 24:861–868. Sun, T., Gabbouj, M., and Neuvo, Y. (1994). Center weighted median filters: Some properties and their applications in image processing. Signal Processing, 35(3):213–229. Wang, X., Hou, L., and Wu, J. (2008). A feature-based robust digital image watermarking against geometric attacks. Image and Vision Computing, 26(7):980–989. Wu, Y., He, Y., and Cai, H. (2005). Optimal threshold selection algorithm in edge detection based on wavelet transform. Image and Vision Computing, 23(13):1159 – 1169. Xu, Y., Weaver, J., Healy, D., and Lu, J. (1994). Wavelet transform domain filters: a spatially selective noise filtration technique. IP, 3(6):747–758. Yong, T. and Qiang, W. (2010). The realization of wavelet threshold noise filtering algorithm in dsp. In Measuring Technology and Mechatronics Automation (ICMTMA), 2010 International Conference on, volume 3, pages 953 –956, Changsha, China. Yu, L. J., Niu, X. M., and Sun, S. H. (2005). Print-and-scan model and the watermarking countermeasure. Image and Vision Computing, 23(9):807–814. Zhang, S., Wong, M.-Y., and Zheng, Z. (2002). Wavelet threshold estimation of a regression function with random design. Journal of Multivariate Analysis, 80(2):256 – 284. Zhao, Y. Q., Shih, F. Y., and Shi, Y. Q. (2011). Passive detection of paint-doctored jpeg images. In Proceedings of the 9th international conference on Digital watermarking, IWDW’10, pages 1–11, Berlin, Heidelberg. Springer-Verlag.
12/12 PeerJ Preprints | https://doi.org/10.7287/peerj.preprints.2619v1 | CC BY 4.0 Open Access | rec: 6 Dec 2016, publ: