SEMI-SUPERVISED HYPERSPECTRAL PIXEL CLASSIFICATION USING INTERACTIVE LABELING V.C. Dinh+∗ , R. P. W. Duin+ Olga Rajadell, Pedro Garc´ıa-Sevilla +
University Jaume I Depto. Lenguajes y Sistemas Inform´aticos Institute of New Imaging Technologies Castell´on, Spain orajadel,
[email protected]
ABSTRACT A semi-supervised pixel classification scheme for hyperspectral satellite images is presented. The scheme includes a previous band selection step followed by a clustering process to select modes of interest that will be labeled by an expert. Then pixel classification is performed resulting in a segmentation and classification of the fields appearing in the image. Thanks to the previous clustering step the most suitable pixels are automatically selected to build the classifier. This reduces the expert effort required since less pixels need to be labeled. However pixel classification accuracy obtained outperforms the results of a random selection scheme where many more pixels were labeled. Index Terms— Pixel classification, hyperspectral imaging, semi-supervised classification, mode seek, spectral/spatial features. I. INTRODUCTION Segmentation is a noted un-supervised issue in image processing research. Lately, this task has also been faced as a semi-supervised task in which experts provide labeled samples that the system can used to classify the pixels as well as to segment the image. To this end pixel classification is widely used but results may still need of additional information or process. In this direction, authors have tried to describe the neighborhood of the pixel using spectral/spatial features [1]. Other methods used MRF [2] suffering from the problem of setting a fixed shape. In [3] an adaptive neighborhood was defined to face this problem. Another popular strategy is defining a classification scheme that introduced a previous segmentation task [4] or a post-process ´ CAIXA CASTELLO-BANCAIXA ´ THANKS TO FUNDACIO FOR FUNDING BY GRANT FPI PREDOC/2007/20. ALSO TO THE SPANISH MINISTRY OF SCIENCE AND INNOVATION FOR SUPPORTING IN PROJECTS CSD2007-00018 (CONSOLIDER INGENIO 2010), AYA200805965-C04-04 AND MTM2009-14500-C02-02
Delft University of Technology Department of Mediamatics Delft, The Netherlands ∗ Carinthian Tech Research AG Department of Spectral Imaging Villach, Austria
[email protected],
[email protected] improvement [5]. But in all cases training sets are picked randomly over the dataset. It is always a drawback to reduce the size of the training set since randomly distributed pixels can lie in non interesting areas and consequently classes can be missed. On the contrary, the expert action is expected to be minimized in the labeling of the training samples. In this scenario the most interesting samples from the system point of view should be provided to the expert instead of the randomly selected ones. Tarabalka et al. introduced this idea in [6] focusing in the phase after pixel classification. This paper introduces a semi-supervised classification scheme aimed at decreasing the training samples before the classification task is performed. Clustering algorithms analyze the feature space in order to group samples around a representant called mode. Thanks to nonparametric clustering techniques a feature space can be analyzed finding their modes in a non-supervised way. In this paper the random selection of samples required to train the classifier is suggested to be changed for the modes resulting of a clustering process of the samples. This non-supervised selection makes training samples suitable for posterior nonlinear classification using a k-nearest neighbor rule. The chosen clustering method is explained in Section II. Afterwards, the feature extraction and the semi-supervised classification scheme are presented in Section III and Section IV respectively. The database will be described in Section V. Later, in Section VI, the experiments will be presented and discussed. Conclusions on the whole paper can be found in Section VII. II. MODE SEEK CLUSTERING Given a hyperspectral image, all pixels can be considered as samples which are characterized by their corresponding feature vectors (spectral curve). The set of features defined is called the feature space and samples (pixels) are represented as points in that multi-dimensional space. A clustering
method groups similar objects (samples) in sets that are called clusters. The similarity measure is defined by the cluster algorithm used. A crucial problem lies in finding a good distance measure between the objects represented by these feature vectors. Many clustering algorithms are well known. Among them, k-means is a widely used technique due to its ease of programming and good performance. However, k-means suffers from several drawbacks; it is sensitive to initial conditions, it does not remove undesirable features for clustering, and it is optimal only for hyper-spherical clusters. Furthermore, its complexity can be impractical for large datasets [7]. For such reasons a KN N modeseeking method will be used in this paper. It selects a number of modes which is controlled by the neighborhood parameter (s). For each class object xj , the method seeks the dissimilarity to its sth neighbors. Then, for the s neighbors of xj , the dissimilarities to their sth neighbors are also computed. If the dissimilarity of xj to its sth neighbor is minimum compared to those of its s neighbors, it is selected as prototype [8]. Note that the s parameter only influences the scheme in a way that the bigger it is the less clusters the method will get since more samples will be group in the same cluster, that is, less modes will be selected as a result.
3) The modes resulting of the previous step define the training set for the next step. The expert is involved in this point by providing the corresponding labels of the selected samples. Here the expert is simulated by checking the labels in the ground truth provided for only those samples. 4) A KN N classifier with k = 1 is build with the training set defined above. Note that in this point the spatial coordinates are dismissed as features. Regarding the clustering step it is always performed over the spectral domain but, once the modes are obtained, the features to be used for the classification step can be the same or changed. In this paper classification step changing the space to spectral/spatial features is also tested. The parameter s of the clustering algorithm can be tuned to obtained a higher or lower number of interesting points to be labeled. The increase of this parameter is inverse to the number of modes found. As it will be seen, the number of modes has a direct impact on the performance of the classification but still the results are better than the ones obtained using a random selection.
III. SPECTRAL/SPATIAL FEATURE EXTRACTION Pixel characterization aims at obtaining one feature vector for each pixel to be used in a pixel classification task in a multidimensional space. When only spectral data is used the feature vector for every pixel is defined as the spectral curve provided by the sensor. In order to describe the context of a pixel several features have been suggested in the literature [9]. In this paper Gabor filtering will be used as suggested in [1]. In this case, features are obtained by filtering the input image with a set of filters. The set of outputs obtained for each pixel in the image forms its feature vector. In this case, the filter bank is defined to be a set of two-dimensional Gabor filters. Each Gabor filter is characterized by a preferred orientation and a preferred spatial frequency (scale) and consist of sine and cosine functions modulated by a Gaussian envelope.
A widely used hyper-spectral database has been used in our experiments. Hyper-spectral image data 92AV3C was provided by the Airborne Visible Infrared Imaging Spectrometer (AVIRIS) and acquired over the Indian Pine Test Site in Northwestern Indiana in 1992. From the 220 bands that composed the image, 20 are usually ignored because of the noise (the ones that cover the region of water absorption or with low SNR) [11]. The image has a spatial dimension of 145×145 pixels. Spatial resolution is 20m per pixel. In it, three different growing states of soya can be found, together with other three different growing states of corn. Woods, pasture and trees are the bigger classes in terms of number of samples (pixels). Smaller classes can be also found such as steel towers, hay-windrowed, alfafa, drives, oats, grass and wheat.
V. DATASET
VI. EXPERIMENTS, RESULTS AND EVALUATION IV. SEMI-SUPERVISED CLASSIFICATION Here the proposed semi-supervised pixel classification scheme is presented. The scheme proceeds as follows: 1) In order to reduce the number of spectral bands to be used, a set of spectral bands, given a desired number, is selected by using the band selection method proposed in [10]. 2) A Clustering procedure is applied over the selected spectral bands. An improvement in the clustering process is included by adding as features the spatial coordinates of each pixel in the image. This provides a spatial component very suitable for clustering since it is based in distances between samples.
In Figures 1, 2 the performance of the semi-supervised classification scheme is compared with the traditional random selection and classification process. Results are shown as learning curves where error rate is represented as a function of the number of samples used for training. In Figure 1 learning curves for different number of spectral bands are presented together with the corresponding learning curve when the same amount of pixels are selected at random. It is noticeable that in all cases, when selecting the training set, the classification rate outperforms the result when it is picked at random. The gain reaches 0.3 when a smaller training set is used and decrease to 0.15 when the training set grows, obviously because when the size of the training set grows,
random selection has more chances to select samples from all different areas. Also, note that no advantage is obtained in involving a higher number of spectral bands in the process. If the number of spectral bands used to performed the clustering step is fixed to 10, similar conclusions can be obtained from Figure 2 where spectral/spatial features are used in this case. Using more than 3 bands leads to higher computational complexity with no performance increase. As a summary also the difference in the error rate between using 10 spectral and 24 spectral/spatial features derived from 3 bands for classification can be observed in Figure 3. Again, in both cases the error rate obtained using the random selection stays over the classification using the mode selection method. It is remarkable that both kind of features start around the same rate but the difference is quickly introduced when more samples are included and the error rate when using spectral/spatial features decrease considerably. Showing the results over the image ground-truth, Figures 4 and 5 show results using 24 spectral/spatial features derived from 3 bands for the classifying step, when 23 and 104 training samples are selected respectively. In (a) misclassified pixels are represented in white color whereas the rest of the image represent well classified ones and (b) training pixels are presented in white over the ground-truth of the image. In both images background is the black area surrounded the classes and it is considered a non interesting heterogeneous area. It is very noticeable that small classes are missed in the mode selection when only 23 modes were found. That means that clustering method cannot detect those areas as independent ones. As a consequence of having no training sample available for that class, classification dismisses it all. As it can be expected, the smaller the number of clusters is, the higher number of small classes are missed. Nevertheless, where a sample is selected, a big area is well classified due to the usage of spectral/spatial features. Figure 4 stands for an error rate of 0.41 using only 23 samples as training set. Observe that only samples from 10 different classes are selected leading to miss 6 classes. However in Figure 5, using 104 training samples, the number of modes increases, 15 classes are included in the training set and the error rate decreases to 0.147. These results may not seem significant in terms of figures. In [12] classification rates reached 95% when the training set size was fixed to 5% of the labeled pixels. In it all spectral bands were used and small classes were dismissed, that is, a 9-class problem was faced. In [1] the 16-class problem was tackled and a smaller number of bands was used but still 5% of the labeled dataset was needed to obtain an accuracy of 92%. Note that, in these works, when random pick is performed a priori probabilities of classes are kept and all classes are represented in the training set. Here the 16-class problem is faced with a very reduced training set. With the selection mode suggested in this paper, an accuracy of 96% can be obtained with only the 3.2% of the labeled pixels and
using only 3 spectral bands.
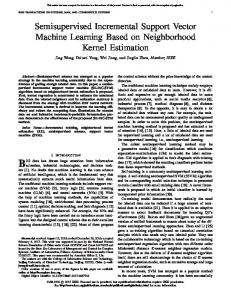
Fig. 1. Learning curves for different number of spectral features comparing the result selecting the training set with the corresponding number of training samples picked at random.
Fig. 2. Learning curves for different number of spectral bands using spectral/spatial features comparing the result selecting the training set with the corresponding number of training samples picked at random. VII. CONCLUSIONS A semi-supervised segmentation and classification scheme has been suggested. Thanks to the mode selection performed by the clustering process, training samples are selected and only interesting samples are labeled by the expert. In this sense their collaboration is reduced while performance is raised in comparison with random selection and classification. Using a clustering method makes the result suitable for classifying with a simple nearest neighbor rule obtaining fairly goods results when fewer initial information is provided. Neither the process is computational expensive since it has been shown that not all spectral bands and not a high number of features were needed in our experiments. On the other hand, small classes may be missed by the clustering
VIII. REFERENCES
Fig. 3. Learning curves resulting from selecting the training set and the corresponding number of training samples picked at random for spectral and spectral/spatial features.
(a)
(b)
Fig. 4. Classification results using 24 spectral/spatial features derived from 3 bands and 23 selected training samples. (a) representation of misclassified pixels in white and (b) training samples shown in white. Error rate was 0.41.
(a)
(b)
Fig. 5. Classification results using 24 spectral/spatial features derived from 3 bands and 104 selected training samples. (a) representation of misclassified pixels in white and (b) training samples shown in white. Error rate was 0.147.
procedure and then dismissed in the classification step. To tackle this problem the clustering step should be improved and probably a post-processing technique could also be of interest.
[1] Olga Rajadell, Pedro Garc´ıa-Sevilla, and Filiberto Pla, “Filter banks for hyperspectral pixel classification of satellite images,” in CIARP 2009, Lecture Notes in Computer Science. 2009, vol. 5856, pp. 1039–1046, Springer. [2] A.Plaza, P.Mart´ınez, J.Plaza, and R.P´erez, “Dimensionality reduction and classification of hyperspectral image data using sequences of extended morphological transformations,” IEEE Trans. on Geoscience & Remote Sensing, vol. 43, pp. 466–479, 2005. [3] M.Fauvel, J.A.Benediktsson, J.Chanussot, and J.R.Sveinsson, “Spectral and spatial classification of hyperspectral data using svms and morphological profiles,” IEEE Trans. on Geoscience & Remote Sensing, vol. 46, no. 10, pp. 3804–3814, 2008. [4] Y.Tarabalka, J.Chanussot, and J.A.Benediktsson, “Segmentation and classification of hyperspectral images using watershed transformation,” Patt.Recogn., vol. 43, no. 7, pp. 2367–2379, 2010. [5] Y.Tarabalka, J.Chanussot, and J.A.Benediktsson, “Spectral-spatial classification of hyperspectral imagery based on partitional clustering techniques,” IEEE Trans. on Geoscience & Remote Sensing, vol. 47, no. 8, pp. 2973–2987, 2009. [6] Y.Tarabalka, J.Chanussot, and J.A.Benediktsson, “Segmentation and classification of hyperspectral images using minimum spanning forest grown from automatically selected markers,” IEEE Trans. Systems, Man, and Cybernetics, pp. –, 2010. [7] RO Duda and PE Hart, Pattern classification, JohnWiley and Sons, 2001. [8] Y Cheng, “Mean shift, mode seek, and clustering,” IEEE Transaction on Pattern Analysis and Machine, 1995. [9] M. Petrou and P. Garc´ıa-Sevilla, Image Processing: Dealing with Texture, John-Wiley and Sons, 1 edition, 2006. [10] Adolfo Mart´ınez-Us´o, Filiberto Pla, and Pedro Garc´ıaSevilla, “Clustering-based hyperspectral band selection using information measures,” IEEE Trans. on Geoscience & Remote Sensing, vol. 45, pp. 4158–4171, 2007. [11] D. A. Landgrebe, Signal Theory Methods in Multispectral Remote Sensing, Hoboken, NJ: Wiley, 1 edition, 2003. [12] A.Plaza et al., “Recent advances in techniques for hyperspectral image processing,” Remote sensing of environment, vol. 113, pp. 110–122, 2009.