Sep 18, 2018 - ME] 16 Sep 2018 .... where it is understood that E {U(θ; Yi) | Yi,obs} = U(θ; Yi) if Yi,obs .... i,mis from f(Yi,mis | Yi,obs; α(t),ζ(t)) in (5), we use the.
arXiv:1809.05976v1 [stat.ME] 16 Sep 2018
Semiparametric fractional imputation using Gaussian mixture models for handling multivariate missing data Hejian Sang∗ Google Inc and Jae Kwang Kim Department of Statistics, Iowa State University,Ames September 18, 2018
Abstract Item nonresponse is frequently encountered in practice. Ignoring missing data can lose efficiency and lead to misleading inference. Fractional imputation is a frequentist approach of imputation for handling missing data. However, the parametric fractional imputation of Kim (2011) may be subject to bias under model misspecification. In this paper, we propose a novel semiparametric fractional imputation method using Gaussian mixture models. The proposed method is computationally efficient and leads to robust estimation. The proposed method is further extended to incorporate the categorical aux√ iliary information. The asymptotic model consistency and n- consistency of the semiparametric fractional imputation estimator are also established. Some simulation studies are presented to check the finite sample performance of the proposed method.
Keywords: Item nonresponse; Robust estimation; Variance estimation.
∗
Acknowledgment This work is done when the author was in Iowa State University
1
1
Introduction
Missing data is frequently encountered in survey sampling, clinical trials and many other areas. Imputation can be used to handle item nonresponse and several imputation methods have been developed in the literature. Motivated from a Bayesian perspective, Rubin (1996) proposed multiple imputation to create multiple complete data sets. Alternatively, under the frequentist framework, fractional imputation (Kim and Fuller, 2004; Kim, 2011) makes one complete data with multiple imputed values and their corresponding fractional weights. Little and Rubin (2002) and Kim and Shao (2013) provided comprehensive overviews of the methods for handling missing data. For multivariate missing data with arbitrary missing patterns, valid imputation methods should preserve the correlation structure in the imputed data. Judkins et al. (2007) proposed an iterative hot deck imputation procedure that is closely related to the data augmentation algorithm of Tanner and Wong (1987) but they did not provide variance estimation. Other imputation procedures for multivariate missing data include the multiple imputation approaches of Raghunathan et al. (2001) and Murray and Reiter (2016), and parametric fractional imputation of Kim (2011). The approaches of Judkins et al. (2007) and Raghunathan et al. (2001) are based on conditionally specified models and the imputation from the conditionally specified model is generically subject to the model compatibility problem (Chen, 2010; Liu et al., 2013; Bartlett et al., 2015). Conditional models for the different missing patterns calculated directly from the observed patterns may not be compatible with each other. The parametric fractional imputation uses the joint distribution to create imputed values and does not suffer from model compatibility problems. Note that parametric imputation requires correct model specification. Nonparametric imputation methods, such as kernel regression imputation (Cheng, 1994; Wang and Chen, 2009), are robust but may be subject to the curse of dimensionality. Hence, it is important, often critical, to develop a unified, robust and efficient imputation method that can be used for general purpose estimation. The proposed semiparametric method
2
fills in this important gap by considering a more flexible model for imputation. In this paper, to achieve robustness against model misspecification, we develop an imputation procedure based on Gaussian mixture models. Gaussian mixture model is a very flexible model that can be used to handle outliers, heterogeneity and skewness. McLachlan and Peel (2004) and Bacharoglou (2010) argued that any continuous distribution can be approximated by a finite Gaussian mixture distribution. The proposed method using Gaussian mixture model makes a nice compromise between efficiency and robustness. It is semiparametric in the sense that the number of mixture components is chosen automatically from the data. The computation for parameter estimation in our proposed method is based on EM algorithm and its implementation is relatively simple and efficient. We note that Di Zio et al. (2007) also proposed to use Gaussian mixture model to impute missing data. However, variance estimation and choice of the mixture component are not discussed in Di Zio et al. (2007). Elliott and Stettler (2007) and Kim et al. (2014) introduced the multiple imputation using mixture models. Instead of multiple imputation, we use fractional imputation for general-purpose estimation. We provide a completely theoretical justification for consistency of the proposed imputation method. The variance estimator and the model selection for the number of mixture component are also carefully discussed and demonstrated in numerical studies. The proposed method is further extended to handle mixed type data including categorical variable in Section 5. By allowing the proportion vector of mixture component to depend on categorical auxiliary variable, the proposed fractional imputation using Gaussian mixture models can incorporate the observed categorical variables and provide a very flexible tool for imputation. The paper is structured as follows. The setup of the problem is introduced and a short review of fractional imputation are presented in Secction 2. In Section 3, the proposed semiparametric method and its algorithm for implementation are introduced. Some asymptotic results are presented in Section 4. In Section 5, the proposed method is further extended to handle mixed type data. Some numerical studies and a real data application are presented to show the performance of the proposed method 3
in Section 6 and Section 7, respectively. In Section 8, some concluding remarks are made. The technical derivations and proof are presented in Appendix.
2
Basic Setup
Consider a p-dimensional vector of study variable Y = (y1 , y2 , · · · , yp ). Suppose that {Y1 , Y2 , · · · , Yn } are n independent and identically distributed realizations of the random vector Y . In this paper, we use the upper case to represent vector or matrix and the lower case to denote the elements within vector or matrix. Assume that we are interested in estimating parameter θ ∈ Θ, which is defined through E {U(θ; Y )} = 0, where U(·; Y ) is the estimating function of θ. With no missingness, a consistent estimator of θ can be obtained by the solution to n
1X U(θ; Yi ) = 0. n i=1
(1)
To avoid unnecessary details, we assume that the solution to (1) exists uniquely almost everywhere. However, due to missingness, the estimating equation in (1) cannot be applied directly. To formulate the multivariate missingness problem, we further define the response indicator vector R = (r1 , r2 , · · · , rp ) for Y = (y1 , y2, · · · , yp ) as � 1 if yj is observed rj = 0 otherwise, where j = 1, 2, · · · , p. We assume that the response mechanism is missing at random in the sense of Rubin (1976). We decompose Y = (Yobs , Ymis ), where Yobs and Ymis represent the observed and missing parts of Y , respectively. Thus, the missing-atrandom assumption is described as pr {R = (r1 , r2 , · · · , rp ) | Yobs , Ymis } = pr {R = (r1 , r2 , · · · , rp ) | Yobs } ,
(2)
for any rj ∈ {0, 1}, j = 1, 2, · · · , p. Under the missing-at-random assumption, a consistent estimator of θ can be obtained by solving the following estimating equation: n
1X E {U(θ; Yi ) | Yi,obs } = 0, n i=1 4
(3)
where it is understood that E {U(θ; Yi ) | Yi,obs } = U(θ; Yi ) if Yi,obs = Yi . To compute the conditional expectation in (3), the parametric fractional imputation (PFI) method of Kim (2011) can be developed. To apply the parametric fractional imputation, we can assume that the random vector Y follows a parametric model in that F0 (Y ) ∈ {Fζ (Y ) : ζ ∈ Ω}. In the parametric fractional imputation, M imputed ∗(1)
∗(2)
∗(M )
values for Yi,mis , say {Yi,mis , Yi,mis , · · · , Yi,mis } are generated from a proposal distribution with the same support of F0 (Y ) and are assigned with fractional weights, say ∗ ∗ ∗ {wi1 , wi2 , · · · , wiM }, so that a consistent estimator of θ can be obtained by solving n X M X
∗(j)
wij∗ U(θ; Yi,obs , Yi,mis ) = 0,
i=1 j=1
P ∗(j) ∼ ∗ where the fractional weights are constructed to satisfy M j=1 wij U(θ; Yi,obs , Yi,mis ) = P ∗ E {U (θ; Yi ) | Yi,obs } as closely as possible, with M j=1 wij = 1. In Kim (2011), impor-
tance sampling idea is used to compute the fractional weights.
However, for multivariate missing data, it is not easy to find a joint distribution family {Fζ (Y ) : ζ ∈ Ω} correctly. If the joint distribution family {Fζ (Y ) : ζ ∈ Ω} is misspecified, the parametric fractional imputation can lead to biased inference. All aforementioned concerns motivate us to consider a more robust fractional imputation method using Gaussian mixture models, which cover a wider class of parametric models.
3
Proposed method
We assume that the random vector Y follows a Gaussian mixture model G X αg f (Y ; ζg ), f (Y ; α, ζ) =
(4)
g=1
where G is the number of mixture component, αg ∈ (0, 1) is the mixture proportion P satisfying G g=1 αg = 1, and f (·; ζg ) is the density function of multivariate normal
distribution with parameter ζg = {µg , Σg }. Here, we consider the same values of
Σg = Σ across all components to get a parsimonious model. The proposed joint model in (4) can be easily extended to use the group-dependent variance Σg , as in Di Zio et al. (2007). 5
To formulate the proposal, define the group indicator vector Z = (z1 , z2 , · · · , zG ), where zg = 1 and zj = 0 for all j 6= g, if sample unit belongs to the g-th group. Note P that Z is a latent variable with parameter pr(zg = 1) = αg , satisfying G g=1 αg = 1. We assume that the Gaussian mixture model in (4) satisfies the strong first-order
identifiability assumption (Chen, 1995; Liu and Shao, 2003; Chen and Khalili, 2008), where the first-order derivatives of f (Y ; α, ζ) respect to all parameters are linearly P independent. Using Z variable, we can express f (Y ) = G g=1 pr(zg = 1)f (Y | zg = 1), which leads to the marginal distribution in (4).
To handle item nonresponse, we propose to use the fractional imputation method to impute the missing values. Note that, the joint predictive distribution of (Ymis , Z) given Yobs can be written as f (Ymis , Z | Yobs ) = f (Z | Yobs )f (Ymis | Yobs , Z), which implies that the prediction model for Ymis is f (Ymis | Yobs ) =
G X g=1
pr(zg = 1 | Yobs )f (Ymis | Yobs , zg = 1).
(5)
The first part in (5) can be obtained by f (Yobs | zg = 1)αg , pr(zg = 1 | Yobs ) = PG g=1 f (Yobs | zg = 1)αg
where Yobs | (zg = 1) is normal. The second part of (5) , which is Ymis | (Yobs , zg = 1), is also normal. Therefore, the EM algorithm for the proposed fractional imputation using Gaussian mixture models (FIGMM) can be described as follows: ∗ I-step: To generate Yi,mis from f (Yi,mis | Yi,obs ; α(t) , ζ (t) ) in (5), we use the
following two-step method: Step 1 : Compute (t)
(t)
f (Yi,obs | zig = 1; ζg )αg (t) , pig = PG (t) (t) f (Y | z = 1; ζ )α g g i,obs ig g=1
where f (Yi,obs | zig = 1; ζg ) is the marginal density of Yi,obs derived from (t)
(t)
(t)
(Yi,obs , Yi,mis ) | (zig = 1) ∼ N(µg , Σ). Generate (Mi1 , Mi2 , · · · , MiG ) ∼ (t)
(t)
(t)
Multinomial(M; Pi (t) ), where Pi (t) = (pi1 , · · · , piG ) with Mij > 0. 6
(t)
Step 2 : For each g = 1, 2, · · · , G, we generate Mig independent real∗(gj)
(t)
∗ izations of Yi,mis , say {Yi,mis , j = 1, 2, · · · , Mig }, from the conditional (t)
distribution f (Yi,mis | Yi,obs , zig = 1; ζg ), which is also normal. ∗(gj)
(t)
(t)
∗ W-step: Compute the fractional weights for Yi,mis as wigj(t) = pig /Mig . Note PG PMig(t) ∗ ∗(gj) ∗ , Yi,mis ), we that g=1 j=1 wigj(t) = 1, for each i = 1, 2, · · · , n. Using (wigj(t)
can compute
M
∗
(t)
(t)
Q (α, ζ | α , ζ ) = ∗(gj)
where Yi
(t)
ig G X n X X
∗ wigj(t)
i=1 g=1 j=1
n
log αg +
∗(gj)
∗(gj) log f (Yi
∗(gj)
= (Yi,obs , Yi,mis ). If δi = 1, then Yi
o
| zig = 1; ζg ) , (6)
= Yi .
M-step: Update the parameters by maximizing (6) with respect to (α, ζ). The solution is αg(t+1)
(t) n 1 X Mig = ; n i=1 M
Σ
=
j=1
i=1
Pn PMig(t) i=1
(t) Mig
∗(gj)
∗ wigj(t) Yi
;
∗ j=1 wigj(t)
� �� �T 1 XXX ∗ ∗(gj) ∗(gj) (t+1) wigj(t) Yi − µ(t+1) Y − µ = . g g i n i=1 g=1 j=1 n
(t+1)
µ(t+1) g
Pn PMig(t)
G
Repeat I-step to M-step until the convergence is achieved. Then, the final estimator, say θˆF IGM M , of θ can be obtained by solving the fractionally imputed estimating equation, given by n
G
Mig
1 XXX ∗ ∗(gj) w U(θ; Yi ) = 0, n i=1 g=1 j=1 igj
(7)
∗ where wigj are the final fractional weights and Mig are the final imputation sizes for
group g, after convergence of the EM algorithm. Remark 1 We now briefly discuss variance estimation of θˆF IGM M . To estimate the variance of θˆF IGM M , replication methods, such as jackknife, can be used. First note ∗(gj)
that, the fractional weight assigned to Yi
∗ is wigj = pˆig Mig−1 := pˆig π ˆ2j|ig , where pˆig
is obtained from f (Yi,obs | zig = 1; ζˆg )α ˆg pˆig = PG . ˆg )α f (Y | z = 1; ζ ˆ i,obs ig g g=1 7
(8)
∗ Thus, the k-th replicate of wigj can be obtained by ∗(k)
(k) (k)
wigj = pˆig π ˆ2j|ig ,
(9)
(k) (k) where pˆig is obtained from (8) using ζˆ(k) and αg , the k-th replicate of ζˆ and α ˆg
respectively, and (k)
π ˆ2j|ig ∝ and
PMig
j=1
∗(gj) (k) f (Yi,mis | Yi,obs , zig = 1; ζˆg ) ∗(gj) f (Y | Yi,obs , zig = 1; ζˆg ) i,mis
(k)
(k)
π ˆ2j|ig = 1. The calculation of π ˆ2j|ig is based on the idea of importance
sampling. Construction of replicate fractional weights using importance sampling idea has been used in Berg et al. (2016). The replicate parameter estimates (α ˆ (k) , ζˆ(k)) are computed by maximizing (k)
lobs (α, ζ) =
n X
(k)
wi log fobs (Yi,obs ; α, ζ)
(10)
i=1
respect to (α, ζ), where fobs (Yi,obs ; α, ζ) =
PG
(k)
g=1
αg f (Yi,obs | zig = 1; ζg ), and wi
is the
(k)
k-th replicate of wi = n−1 . The maximizer of lobs (α, ζ) in (10) can be obtained by applying the same EM algorithm using replicate weights and replicate fractional weights in the W-step and M-step. There is no need to repeat I-step. Variance estimation for θˆF IGM M can be obtained by computing the k-th replicate of θˆF IGM M from n X i=1
(k) wi
Mig G X X
∗(k)
∗(gj)
wigj U(θ; Yi
) = 0.
(11)
g=1 j=1
For example, the jackknife variance estimator of θˆF IGM M can be obtained by n � � � n−1X �2 (k) ˆ var c θF IGM M = θˆF IGM M − θˆF IGM M , n i=1
(k) where θˆF IGM M is the k-th replicate of θˆF IGM M obtained from (11).
4
Asymptotic theory
In our proposed fractional imputation method using Gaussian mixture models in §3, we have assumed that the size of mixture components, G, is known. In practice , G is 8
often unknown and we need to estimate it from the sample data. If G is larger than necessary, the proposed mixture model may be subject to overfitting and increase its variance. If G is small, then the approximation of the true distribution cannot provide accurate prediction due to its bias. Hence, we can allow the model complexity parameter G to depend on the sample size n, say G = G(n). The choice of G under complete data has been well explored in the literature. The popular methods are based on Bayesian information criterion (BIC) and Akaike’s information criterion (AIC). See Wallace and Dowe (1999), Windham and Cutler (1992), Schwarz et al. (1978), Fraley and Raftery (1998), Keribin (2000) and Dasgupta and Raftery (1998). The alternative way of using SCAD penalty (Fan and Li, 2001) is studied in Chen and Khalili (2008) and Huang et al. (2017). In this paper, we consider using the Bayesian information criterion to select G. Under multivariate missingness, we do not have the complete log-likelihood function. Thus, we use the observed log-likelihood function to serve the role of the complete log-likelihood function in computing the information criterion, in the sense that ( G ) n X X log α ˆ g f (Yi,obs | zig = 1; ζˆg ) + (log n)φ(G), (12) BIC(G) = −2 i=1
g=1
ˆ are the estimators obtained from under the assumption of Σg = Σ, where (α, ˆ ζ) the proposed method and φ(G) is a monotone increasing function of G. In (12), φ(G) = G + Gp if ignoring constant terms. However, our model selection framework and theoretical results can be directly applied to any general penalty function φ(G). Using Gaussian mixture models, the observed log-likelihood function is expressed as a closed-form. In this section, we first establish the consistency of model selection using (12) under the Gaussian mixture model assumption. After that, we establish some asymptotic results when the Gaussian mixture model assumption is violated. To establish the first part, assume that {Y1 , Y2 , · · · , Yn } is a random sample from PGo o o o o o o f0 (Y ) = g=1 αg f (Y ; ζg ), where (G , α , ζ ) are true parameter values. For ζg = (µog , Σo ), we need the following regularity assumptions:
(A1 ) The mean vectors for each mixture component is bounded uniformly, in 9
the sense of kµog k ≤ C1 , for g = 1, 2, · · · , Go . (A2 ) kΣo k ≤ C2 . Furthermore, Σo is nonsingular. The first assumption means the first moment is bounded. Assumption (A2 ) is to make sure that Σ0 is bounded and nonsingular. Both assumptions are commonly used. To establish the model consistency, we furthermore make the additional assumptions on the response mechanism: (A3 ) The response rate for yj is bounded below from 0, say limn n−1 C3 , for j = 1, 2, · · · , p, where C3 > 0 is a constant.
Pn
i=1 rij
>
(A4 ) The response mechanism satisfies the mising-at-random condition in (2). The following theorem shows that the true number of mixture components can be selected by minimizing BIC(G) in (12) consistently. Theorem 4.1 Assume the true density f0 is the Gaussian mixture model, satisfying ˆ be the minimizer of BIC(G) in (12). Under assumptions (A3)– (A1)–(A2). Let G (A4), we have ˆ = Go ) − pr(G → 1, as n − → ∞, where Go is the true number of mixture components. The proof of Theorem 4.1 is shown in the Supplementary Material. Theorem 4.1 states that minimizing BIC(G) consistently selects the true mixture components under the assumption that the true distribution is in the Gaussian mixture model. Now, in the second scenario, the true distribution does not necessary belong to the class of Gaussian mixture models, Thus, we first establish the following lemma to measure how well Gaussian mixture model can approximate the arbitrary density function. We furthermore make additional assumptions about the true density function f0 . Use E0 to denote the expectation respect to f0 . (A5 ) Assume f0 (Y ) is continuous with 10
R
Y 2 f0 (Y ) < ∞.
(A6 ) Assume E0 {∂f (Y )/∂α} < ∞ and E0 {∂f (Y )/∂µ} < ∞, where f (Y ) = PG −2 g=1 αg f (Y ; µg , Σ). Moreover, assume E0 {f (Y ) } < ∞.
Assumption (A5 ) is satisfied for any continuous random variable with bounded
second moments. Assumption (A6 ) is true for any finite Gaussian mixture model and f0 has a valid moment generating function. Lemma 4.2 Under assumptions (A5)–(A6) and missing at random, for any ǫ > 0, there exist G = ǫ−γ , such that kf0 − fˆk1 = O(ǫ),
(13)
var(f0 − fˆ) = O(ǫ−γ n−1 ),
(14)
P ˆ is obtained from the proposed with probability one, where fˆ(Y ) = G ˆ g f (Y ; µ ˆ g , Σ) g=1 α R method in §3, γ > 0 and kf0 − fˆk1 = |f0 (Y ) − fˆ(Y )|f0 (Y )dY. The proof of Lemma 4.2 is presented in the Supplementary Material. If f0 is a density
function of the Gaussian mixture model, then γ = 0 and by Theorem 4.1, our proposed BIC(G) can select the true model consistently. For any f0 satisfies (A5 )–(A6 ) and is not a finite Gaussian mixture model, the bias can goes to 0 as G − → ∞ from (13). The variance will increase as G − → ∞ from (14) for fixed n. There is a trade-off between bias and variance for the divergence case (γ > 0, G − → ∞). √ Using Lemma 4.2, we can further establish the n-consistency of θˆF IGM M . The √ following assumptions are the sufficient conditions to obtain the n-consistency. (A7 ) E0 {U 2 (θ; Yi )} < ∞. (A8 ) γ ∈ (0, 2). (A9 ) ǫ = O(n−1/(2−∆) ), for any ∆ ∈ (0, 2). Theorem 4.3 Under assumptions (A5)–(A9), γ + ∆ < 2 and MAR, we have n
G
Mig
1 XXX ∗ ∗(gj) ∼ w U(θ; Yi ) = J1 + op (n−1/2 ), n i=1 g=1 j=1 igj 11
(15)
where J1 = n−1 we have
Pn
i=1
E0 {U(θ; Yi ) | Yi,obs }, if M = √
P
i,g {Mig }
→ ∞. Furthermore, −
n(θˆF IGM M − θ0 ) − → N(0, Σ),
(16)
for some Σ which is positive definite and θ0 satisfies E0 {U(θ0 ; Y )} = 0. The proof of (15) is shown in the Supplementary Material and (16) can be directly derived from (15). From Theorem 4.3, we have G = O(nγ/(2−∆) ) = o(n) − → ∞ with the rate smaller than n. Thus, even under non-Gaussian mixture families, our √ proposed method still enjoys n-consistency.
5
Extension
In Section 3, we assume that Y is fully continuous. However, in practice, categorical variables can be used to build imputation models. We extend our proposed method to incorporate the categorical variable as a covariate in the model. To introduce the proposed method, we first introduce the conditional Gaussian mixture model. Suppose that (X, Y ) is a random vector where X is discrete and Y is continuous. We further assume that X is always observed. To obtain the conditional Gaussian mixture model, we assume that Z satisfies f (Y | X, Z) = f (Y | Z),
(17)
in the sense that Z is a partition of the sample such that Y is homogeneous within each group defined by Z. Furthermore, we assume that f (Y | zg = 1) follows a Gaussian distribution. Combining these assumptions, we have the following conditional Gaussian mixture model f (Y | X) =
G X g=1
αg (X)f (Y | zg = 1),
(18)
where αg (X) = pr(zg = 1 | X) and f (Y | zg = 1) is the density function of the normal distribution with parameter ζg = {µg , Σ}. We also assume that the identifiability conditions in (18) hold. 12
Using the argument similar to (5), the predictive model of Yi,mis under (17) can be expressed as f (Yi,mis | Yi,obs , Xi ) =
G X g=1
pr(zig = 1 | Yi,obs , Xi )f (Yi,mis | Yi,obs , zig = 1),
(19)
where f (Yi,mis | Yi,obs , zig = 1) can be derived from (Yi,obs , Yi,mis ) | (zig = 1) ∼ N(µg , Σ). The posterior probability of zig = 1 given the observed data is f (Yi,obs | zig = 1)pr(zig = 1 | Xi ) pr(zig = 1 | Yi,obs , Xi ) = PG . g=1 f (Yi,obs | zig = 1)pr(zig = 1 | Xi )
Therefore, the proposed fractional imputation using conditional Gaussian mixture models can be summarized as follows: I-step: Creating M imputed values of Yi,mis from (19) can be described in the following two steps. Step 1 : For each g = 1, 2, · · · , G, given the current parameter values (t)
(t)
(αg , ζg ), the posterior probabilities of zig = 1 given (Yi,obs , Xi ) can be obtained from (t)
(t)
f (Yi,obs | zig = 1; ζg )αg (Xi ) (t) . pig = PG (t) (t) f (Y | z = 1; ζ )α (X ) g g i,obs ig i g=1
Step 2 : Generate M imputed values of Yi,mis following the same procedure of I-step in §3. ∗(gj)
∗(gj)
∗ W-step: Update the fractional weights for Yi = (Yi,obs , Yi,mis ) as wigj(t) = (t) P P P M (t) (t) (t) (t) G ig ∗ pig /Mig , for j = 1, 2, · · · Mig and G j=1 wigj(t) = g=1 g=1 Mig = M. Note that
1.
M-step: Update the parameter values by maximizing M
Q∗ (α, ζ | α(t) , ζ (t) ) =
(t)
ig G X n X X
i=1 g=1 j=1
n o ∗(gj) ∗ log αg (Xi ) + log f (Yi | zig = 1; ζg ) , wigj(t)
respect to (α, ζ).
13
Repeat I-step to M-step iteratively until convergence is achieved. The final estimator of θ can be obtained by solving the fractionally imputed estimating equation in (7). Note that the proposed method builds the proportion vector of mixture components into a function of auxiliary variable and assumes that the mixture components share the same mean and variance structure. Thus, the proposed method can borrow information across different X values. Moreover, the auxiliary information is incorporated to build a more flexible class of joint distributions.
6
Numerical Studies
We consider two simulation studies to evaluate the performance of the proposed methods. The first simulation study is used to check the performance of the proposed imputation method using Gaussian mixture models under multivariate continuous variables. The second simulation study considers the case of multivariate mixed categorical and continuous variables. To save space, we only present the first simulation study. The second simulation study is presented in the Supplementary Material. In the first simulation study, we consider the following models for generating Yi = (Yi1 , Yi2 , Yi3 ). 1. M1 : A mixture distribution with density f (Y ) =
P3
g=1 αg fg (Y
), where (α1 , α2 , α3 ) =
(0·3, 0·3, 0·4) and fg (Y ) is a density function for multivariate normal distribution with mean µg and variance 1 ρ ρ2 Σ(ρ) = ρ 1 ρ . ρ2 ρ 1
Let ρ = 0·7 and µ1 = (−3, −3, −3, ), µ2 = (1, 1, 1), µ3 = (5, 5, 5). 2. M2 : Use the same model as M2 except for f1 (Y ), where f1 (Y ) is a product of the density for the exponential distribution with rate parameter 1. 3. M3 : Yi1 = 1 + ei1 , Yi2 = 0·5Yi1 + ei2 and Yi3 = Yi2 + ei3 , where ei1 , ei2 , ei3 are independently generated from N(0, 1), Gamma(1, 1) and χ21 distributions, respectively. 14
4. M4 : Generate (Yi1 , Yi2) independently from a Gaussian distribution with mean (1, 2) and variance � 1 0·5 . 0·5 1
�
Let Yi3 = Yi22 + ei3 , where ei3 ∼ N(0, 1). In M1, a Gaussian mixture model with G = 3 is used to generate the samples. A non-Gaussian mixture distribution is used in M2 to check the robustness of the imputation methods. M3 and M4 are used to check the performance of the imputation methods under skewness and nonlinearity, respectively. The size for each realized sample is n = 500. Once the complete sample is obtained, for yij , j = 2, 3, we select 25% of the sample independently to make missingness with the selection probabilities equal to πij , where logit(πi2 ) = −0·8 + 0·4yi1 , logit(πi3 ) = 0·4 − 0·8yi1, and logit(u) = exp(u)/ {1 + exp(u)}. Since we assume yi1 are fully observed, the response mechanism is missing at random. The overall missing rate is approximate 55%. For each realized incomplete samples, we apply the following methods: [Full ]: As a benchmark, we use the full samples to estimate parameters. Confidence intervals with 95% coverage rates are constructed using Wald method. [CC ]: Only use the complete cases to estimate parameters and construct confidence intervals.
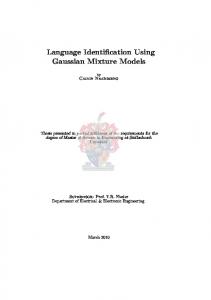
[MICE ]: Apply multivariate imputation by chained equations (Buuren and Groothuis-Oudshoorn, 2011). The predictive mean matching is used as a default. The variance estimators are obtained using Rubin’s formula and confidence intervals are constructed using Wald method. [PFI ]: Parametric fractional imputation method of Kim (2011), where we assume the joint distribution is a multivariate normal distribution. [SFI ]: The proposed semiparametric fractional imputation method using Gaussian mixture models, where the number of components G is selected using the 15
M1
M2
M3
M4
600
400
count
200
0
600
400
200
0 10
2
3
4
5
6
7
8
9
10
2
3
4
5
6
7
8
9
G
Figure 1: The histograms of selected G values using the proposed BIC. BIC in (12). The confidence interval is implemented using the variance estimator presented in Remark 1. The parameters of interest are the population means and the population proportions. For Y = (y1 , y2, y3 ), define θ2 = E(y2 ), θ3 = E(y3 ). The parameters of population proportions are defined as P2 = pr(y2 < c2 ), P3 = pr(y3 < c3 ), where (c2 , c3 ) = (−2, −2) for M1 and M2, (c2 , c3 ) = (2, 3) for M3, (c2 , c3 ) = (2, 5) for M4. The simulation is repeated for B = 2, 000 times. To evaluate the above methods, the relative mean square error (RMSE) is defined as RMSE =
MSEmethod × 100, MSEFull
where MSEmethod is the mean squared error of the parameters of the current method and MSEFull is the mean squared error of the parameters of using full samples. The simulation results of RMSE and average coverage probability are presented in Table 1. The histograms of selected G values using the proposed BIC method are shown in Figure 1. Table 1 presents the relative mean squared errors and the corresponding average coverage probabilities from the above simulation study of size B = 2, 000. Under M1, the joint model is a Gaussian mixture. The proposed method obtains almost the same RMSEs for estimating θ2 , θ3 and P2 with MICE and PFI, but outperforms MICE and PFI for estimating P3 . Moreover, coverage probabilities of MICE and PFI are less than 95% in estimating θ3 and P3 . SFI uniformly achieves approximate 95% 16
Table 1: The relative mean squared errors and coverage probabilities (in parentheses) of the five methods computed from a Monte Carlo simulation of size B = 2, 000. Full, the method uses full samples; CC, the method only uses complete cases; MICE, multiple imputation uses chain equations; PFI, parametric fractional imputation; SFI, the proposed semiparametric fractional imputation method uses Gaussian mixture models. Model
M1
M2
M3
M4
Method Full CC MICE PFI SFI Full CC MICE PFI SFI Full CC MICE PFI SFI Full CC MICE PFI SFI
θ2 100(94·9) 3233(2·9) 100(95·2) 100(94·6) 100(94·6) 100(94·1) 2841(3·0) 102(94·4) 102(93·8) 106(95·1) 100(94·7) 157(77·9) 100(94·8) 100(94·6) 97(95·1) 100(94·9) 386(81·8) 110(94·8) 108(94·8) 126(95·0)
θ3 100(95·0) 3010(3·5) 105(93·9) 104(93·3) 106(95·0) 100(94·6) 2863(3·6) 109(93·7) 108(94·1) 107(95·4) 100(94·7) 155(85·6) 100(93·5) 100(95·2) 83(92·8) 100(95·2) 353(86·2) 114(95·2) 111(94·2) 124(94·7)
P2 100(94·5) 2639(4·5) 102(94·7) 102(94·0) 102(95·3) 100(94·1) 2284(4·8) 103(93·8) 102(93·3) 103(93·8) 100(95·2) 145(77·0) 117(92·5) 117(89·9) 106(93·8) 100(94·3) 317(86·4) 128(93·5) 129(91·6) 135(94·5)
P3 100(94·9) 2407(5·6) 145(90·6) 141(89·1) 134(95·3) 100(94·5) 2233(5·7) 189(86·3) 180(83·8) 177(92·8) 100(95·1) 145(86·6) 128(90·4) 127(89·7) 91(94·3) 100(95·2) 308(86·6) 207(86·7) 197(84·4) 139(94·2)
coverage probabilities. Thus, we can conclude that MICE and PFI are biased, due to model misspecification. The histogram in Figure 1 shows that most of selected G values are 3, which is the true number of mixture components. In M2, instead of Gaussian mixture models, one component is the exponential distribution. Table 1 shows that SFI outperforms MICE and PFI in term of RMSEs for estimating proportions and obtains similar performance for estimating means. The coverage rates for MICE and PFI for P3 are poor. The joint distribution M3 is a skewed distribution. From Tables 1, we can see that SFI outperforms MICE and PFI uniformly. Furthermore, SFI provides better coverage probabilities than MICE and PFI for P2 and P3 .
17
The joint distribution in M4 has a nonlinear mean structure of Yi3 . Under M4, SFI obtains the much smaller RMSE than MICE and PFI in estimating P4 , but larger RMSE in estimating θ2 , θ3 , P3 . However, SFI achieves consistent confidence intervals with approximate 95% coverage probabilities. MICE and PFI are biased in interval estimation and coverage probabilities are much less than 95%. Overall, the performance of SFI is much better than MICE or PFI in terms of coverage probabilities. Interestingly, the imputed estimators are sometimes more efficient than the full sample estimators. This phenomenon, called superefficiency (Meng, 1994), can happen when the method-of-moment is used in the full sample estimator. Yang and Kim (2016) give a rigorous theoretical justification for this phenomenon.
7
Application
In this section, we apply the proposed method in §3 to a synthetic data that mimics monthly retail trade survey data at U.S. Census Bureau. The synthetic monthly retail trade survey data was made for contest in a conference and can be found in http://www.portal-stat.admin.ch/ices5/imputation-contest/. The sampling scheme is a stratified simple random sample without replacement sample with six strata: one certain (take-all) and five non-certainty strata. The sample sizes are computed using Neyman allocation. An overview of the monthly retail trade survey data is presented in Figure 2. The overall response rate is approximately 71%. Current month sales and inventories are subject to missingness. From Figure 2, we can find that this monthly retail trade data are highly skewed. From the normal quantile-quantile plot, normality assumption is violated and there exist three extreme outliers. To impute current month sales and inventories, we applied the proposed fractional imputation method and MICE. After implementation, MICE failed to converge due to high correlations among the survey items. Therefore, we only present the final analysis results using the proposed method. The final results are shown in Table 2. Comparing with the true population statistics, provided by U.S. Census Bureau, we can see that our proposed fractional imputation method with Gaussian mixture 18
mos 20
Sales00
Sales01 20
20.0
20.0
17.5
17.5
15
15 15.0
log(value)
15.0
12.5
10
Inventories00
10
12.5
10.0 1 2 3 4 5 6
1 2 3 4 5 6
1 2 3 4 5 6
Inventories01
asales00
ainventories00
21
1 2 3 4 5 6
21
20
18
18 15
15
15
12
12
10
9 1 2 3 4 5 6
1 2 3 4 5 6
1 2 3 4 5 6
stratum
Figure 2: Overview for log-values of the monthly retail trade survey data:“mos” is frame measure of size; “Sales00” denotes current month sales for unit (subject to missing); “asales00” is current month administrative data value for sales; “Sales01” means prior month sales for unit; “Inventories00” is current month inventories for unit (Subject to missing); “ainventories00” is current month administrative data value for inventories; “Inventories01” is prior month inventories for unit.
Table 2: Imputation results for the monthly retail trade survey data. Parameter estimation, 95% confidence interval and true values are presented. Estimate, the estimators provided by the proposed method; Truth, the true parameter values from U.S. Census Bureau. Parameter Mean of Sales00 (×10−6 ) Mean of Inventories00 (×10−6 ) Correlation of Sales00 and Inventories00
19
Estimate 95% Confidence interval Truth 2·28 (2·10, 2·46) 2·30 4·76 (4·42, 5·10) 4·81 0·97 (0·94, 0·99) 0·97
models works well to preserve the correlation structure and handle skewness and outliers. In Table 2, we can see that all 95% confidence intervals contain their true values.
8
Discussion
Fractional imputation has been proposed as a tool for frequentist imputation, as an alternative to multiple imputation. Multiple imputation using Rubin’s formula can be biased when the model is uncongenial or the point estimator is not self-efficient (Meng, 1994; Yang and Kim, 2016). In this paper, we have proposed a semiparametric fractional imputation method using Gaussian mixture models to handle arbitrary multivariate missing data. The proposed method automatically selects the size of mixture components and provides a unified framework for robust imputation. Even if √ the group size G increases with the sample size n, the resulting estimator enjoys nconsistency. We have also extended the proposed method to incorporate categorical auxiliary variable. The flexible model assumption and efficient computation are the main advantages of our proposed method. An extension of the proposed method to survey data is a topic of future research. An R software package for the proposed method is under development.
References Bacharoglou, A. (2010). Approximation of probability distributions by convex mixtures of Gaussian measures.
Proceedings of the American Mathematical Soci-
ety 138 (7), 2619–2628. Bartlett, J. W., S. R. Seaman, I. R. White, J. R. Carpenter, and A. D. N. Initiative (2015). Multiple imputation of covariates by fully conditional specification: accommodating the substantive model. Statistical Methods in Medical Research 24 (4), 462–487. Berg, E., J.-K. Kim, and C. Skinner (2016). Imputation under informative sampling. Journal of Survey Statistics and Methodology 4 (4), 436–462. 20
Buuren, S. and K. Groothuis-Oudshoorn (2011). MICE: Multivariate imputation by chained equations in R. Journal of Statistical Software 45 (3), 1–67. Chen, H. Y. (2010). Compatibility of conditionally specified models. Statistics & Probability Letters 80 (7-8), 670–677. Chen, J. (1995). Optimal rate of convergence for finite mixture models. The Annals of Statistics, 221–233. Chen, J. and A. Khalili (2008). Order selection in finite mixture models with a nonsmooth penalty. Journal of the American Statistical Association 103 (484), 1674–1683. Cheng, P. E. (1994). Nonparametric estimation of mean functionals with data missing at random. Journal of the American Statistical Association 89 (425), 81–87. Dasgupta, A. and A. E. Raftery (1998). Detecting features in spatial point processes with clutter via model-based clustering. Journal of the American Statistical Association. 93 (441), 294–302. Di Zio, M., U. Guarnera, and O. Luzi (2007). Imputation through finite gaussian mixture models. Computational Statistics & Data Analysis 51 (11), 5305–5316. Elliott, M. R. and N. Stettler (2007). Using a mixture model for multiple imputation in the presence of outliers: the healthy for lifeproject. Journal of the Royal Statistical Society: Series C (Applied Statistics) 56 (1), 63–78. Fan, J. and R. Li (2001). Variable selection via nonconcave penalized likelihood and its oracle properties. Journal of the American Statistical Association. 96 (456), 1348–1360. Fraley, C. and A. E. Raftery (1998). How many clusters? which clustering method? answers via model-based cluster analysis. The di2007imputationurnal 41 (8), 578– 588.
21
Huang, T., H. Peng, and K. Zhang (2017). Model selection for Gaussian mixture models. Statistica Sinica 27 (1), 147–169. Judkins, D., T. Krenzke, A. Piesse, Z. Fan, and W.-C. Haung (2007). Preservation of skip patterns and covariate structure through semi-parametric whole questionnaire imputation. In Proceedings of the Section on Survey Research Methods of the American Statistical Association, pp. 3211–3218. Keribin, C. (2000). Consistent estimation of the order of mixture models. Sankhya A, 49–66. Kim, H. J., J. P. Reiter, Q. Wang, L. H. Cox, and A. F. Karr (2014). Multiple imputation of missing or faulty values under linear constraints. Journal of Business & Economic Statistics 32 (3), 375–386. Kim, J. K. (2011).
Parametric fractional imputation for missing data analysis.
Biometrika 98 (1), 119–132. Kim, J. K. and W. Fuller (2004). Fractional hot deck imputation. Biometrika 91 (3), 559–578. Kim, J. K. and J. Shao (2013). Statistical Methods for Handling Incomplete Data. CRC Press. Little, R. J. and D. B. Rubin (2002). Statistical Analysis with Missing Data. John Wiley & Sons. Liu, J., A. Gelman, J. Hill, Y.-S. Su, and J. Kropko (2013). On the stationary distribution of iterative imputations. Biometrika 101 (1), 155–173. Liu, X. and Y. Shao (2003). Asymptotics for likelihood ratio tests under loss of identifiability. The Annals of Statistics 31 (3), 807–832. McLachlan, G. and D. Peel (2004). Finite Mixture Models. John Wiley & Sons. Meng, X.-L. (1994). Multiple-imputation inferences with uncongenial sources of input. Statistical Science 9 (4), 538–558. 22
Murray, J. S. and J. P. Reiter (2016). Multiple imputation of missing categorical and continuous values via Bayesian mixture models with local dependence. Journal of the American Statistical Association 111 (516), 1466–1479. Raghunathan, T. E., J. M. Lepkowski, J. Van Hoewyk, and P. Solenberger (2001). A multivariate technique for multiply imputing missing values using a sequence of regression models. Survey Methodology 27 (1), 85–96. Rubin, D. B. (1976). Inference and missing data. Biometrika 63 (3), 581–592. Rubin, D. B. (1996). Multiple imputation after 18+ years. Journal of the American Statistical Association. 91 (434), 473–489. Schwarz, G. et al. (1978). Estimating the dimension of a model. The Annals of Statistics 6 (2), 461–464. Tanner, M. A. and W. H. Wong (1987). The calculation of posterior distributions by data augmentation. Journal of the American Statistical Association. 82 (398), 528–540. Wallace, C. S. and D. L. Dowe (1999). Minimum message length and kolmogorov complexity. The Computer Journal 42 (4), 270–283. Wang, D. and S. X. Chen (2009). Empirical likelihood for estimating equations with missing values. The Annals of Statistics 37 (1), 490–517. Windham, M. P. and A. Cutler (1992). Information ratios for validating mixture analyses. Journal of the American Statistical Association. 87 (420), 1188–1192. Yang, S. and J. K. Kim (2016). A note on multiple imputation for method of moments estimation. Biometrika 103 (1), 244–251.
23