work at the same time in a synchronous session always have the same graph layout as the others or should they be able to create their own views? How would ...
Sensemaking and Provenance in Distributed Collaborative Node-Link Visualizations ¨ Zimmer and Andreas Kerren Bjorn
A BSTRACT Various experts often work together during the analysis of large and complex data sets in order to minimize the required time and to improve the quality of the analysis results. Keeping track of the reasoning involved during a collaborative process and using this information later to review and reflect upon it can be a challenging task. For instance, analysts should have the possibility to quickly review changes performed on a graph and get an idea of the most interesting regions according to the user history without the need to replay every single action that was performed by prior users. This paper focuses on challenges during the collection and visualization of the sensemaking process in distributed collaborative node-link visualizations. We raise five challenges that we think need discussion among researchers in this domain and present our tool OnGraX— a web-based collaborative tool for analyzing networks—that addresses some of those challenges. Keywords: Collaboration, graph drawing, heat maps, network exploration, network analysis, sensemaking, provenance. 1 P OSITION S TATEMENT In this paper, we want to point out challenges that arise during the collaborative analysis of large and complex graphs. Analysts often wish to collaborate for increasing the quality of the analysis result as well as the speed of the analysis process. Building an understanding of the collaborative work in node-link visualizations is an interesting challenge and has not yet been discussed in the literature. The first techniques for supporting provenance involved the collection of everything that happened during an analysis session with the intention of somehow making sense of this data later. However, the recorded interaction data quickly grows in size and becomes sometimes more complex than the original data set. Some tools address this issue by reducing the complexity of the interaction history and by filtering unnecessary views [3]. Revisiting old snapshots of an analytic session or replaying every single event is usually not sufficient enough to reveal the same insights that an analyst might have had during the initial analysis. Providing analysts to add data aware annotations [4] to parts of a data set during the sensemaking process is a good method to discuss insights, ideas or questions with other users. Tools such as ManyEyes [8] or Sense.us [5] address this issue, however they focus on the visualization of data sets with standard diagrams and do not support annotations in more complex node-link visualizations, which we see as one of the existing challenges in distributed collaborative graph visualization. The special problem that arises during the distributed analysis of graphs is that topology and structure of a graph are independent to the layout. Analysts might change the layout drastically during the analysis process, which complicates the task of keeping track of the graph objects and areas that users were most interested in. Adding tools for subsequent analysts to be able to quickly review the previous collaborators’ interests is another interesting challenge. It could also be useful to track changes that were performed on graph objects by others, such as renaming a node or changing its attributes.
Abstract Paper, IEEE VIS 2014 Workshop: Provenance for Sensemaking, Paris, France, 2014.
Additionally, annotations pinned to specific graph objects or regions of a graph could loose their context when the layout or the structure of a graph changes. In case of graphs that change their topology during the analysis process (referred to as dynamic graphs in the following), single nodes or complete graph regions could be deleted from a graph, rendering old user annotations useless without the possibility to view them in their historical context. This would require to either having to save a snapshot of the graph for each user annotation or to track all changes performed on the graph layout and structure to be able to undo them on the fly and revisit old graph states and their related annotations. Providing tools for the analysis of dynamic graphs in a distributed collaborative environment proves to be even more complex. Should the users who work at the same time in a synchronous session always have the same graph layout as the others or should they be able to create their own views? How would other users in such a case be able to follow what their collaborators are seeing, and how would it be possible for subsequent analysts to follow the original sensemaking process of multiple collaborating users? We summarize these questions and our challenges of sensemaking and provenance in distributed collaborative node-link visualizations as follows: 1. Give users tools to discuss and review insights in dynamic node-link diagrams. 2. Get an overview of graph objects and regions that users were interested in. 3. Review graph changes performed by former users. 4. Follow the analysis processes of other users while they look at a different layout of the same graph. 5. Review the sensemaking process of multiple users that worked collaboratively with different views of the same graph. Our web-based tool for distributed collaborative graph exploration OnGraX [9, 10] addresses the first three challenges of this list. In the next section, we give an overview of the tool and exemplify it by an application in the domain of systems biology. 2
G RAPH E XPLORATION AND S ENSEMAKING WITH O N G RA X OnGraX supports distributed, synchronous and asynchronous collaboration for graphs with up to 10,000 nodes and edges. In our example, OnGraX is used to revise biochemical networks that were derived from [7]. In more detail, biologists can apply our tool for the interactive exploration and curation/cleaning [6] of networks from the Kyoto Encyclopedia of Genes and Genomes (KEGG) pathway database [1]. The KEGG database contains metabolic and regulatory processes visualized as network diagrams which can be used to explore and retrieve information about biological processes and higher-order functions of biological systems. With the help of our tool, biologists are able to work together from different locations in order to explore and revise those biochemical networks efficiently. In addition to standard collaboration features like event tracking or synchronizing, our system provides visualization and
interaction techniques to support coordination and discussion of insights among users. They can either work simultaneously on a graph to discuss insights in real-time, or asynchronously to avoid having to schedule a virtual meeting with a larger group of colleagues. In the latter case, it is important for the analysts to know which parts of a biochemical network have already been revised, who was responsible for the analysis, and what changes were performed on the graph.
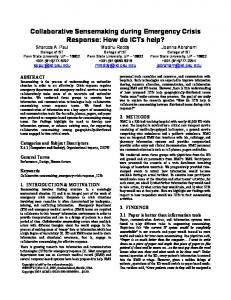
Figure 2: Dialog with all node annotations of the graph. (a) shows a highlighted marker pinned to a node, which is currently hovered by the mouse cursor in the annotations dialog. The graph can be temporarily reverted to the time the annotation was written to provide subsequent analysts with the same view as the original author.
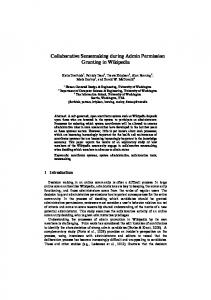
Figure 1: Overview of our system. The blue and green dashed rectangles (see (a) and (b)) are the viewing areas of two other users who are also exploring this graph simultaneously. In this concrete case, the underlying heat map highlights those nodes that have been of interest to all users during the last hour. Clicking on an action in the timeline (c) reverts the graph to a previous state, enabling analysts to review data annotations in their historical context. The persistent chat (d) helps users to discuss changes and link messages to objects or arbitrary positions in the graph. OnGraX uses a heat map-based approach to give subsequent analysts a quick way to determine already revised parts of a network (see Fig. 1). The heat map can show correlated values of all logged user views and node positions; it is robust against changes of the graph layout. A second option shows heat map values based on manual changes performed on nodes in a graph (e.g., node movement, name modifications, node selections, or adding/removing edges). A multiplier can be specified for each individual action to give it more or less weight during the calculation. The heat map can also be configured to only show the data of particular users and specific time frames. This enables analysts to quickly get an estimate of graph changes that where performed by specific users without the need to inspect every single action in the graph’s history log. During their work, analyst should share their thoughts, insights, and questions about specific nodes, edges or regions with other users. This could happen during a synchronous session where collaborators want to discuss their findings, or in an asynchronous session where users would like to share messages and pointers on specific nodes that are persistent against future changes in the graph. Heer and Agrawala discuss these ideas as “Common Ground and Awareness” and “Reference and Deixis” in their work on collaborative visual analytics [2]. OnGraX gives users the option to attach textual annotations to graph objects (see Fig. 2). If there have been any changes to the graph since the message was written, users can undo and redo these changes to get a temporary view of the same graph state that the author looked at while the message was written. 3
D ISCUSSION
AND
C ONCLUSION
In this paper, we pointed out five challenges to the analysis process of node-link diagrams in a distributed collaborative environment. With our visualization tool, we already are concerned with the first
three challenges: the first challenge is addressed by OnGraX’s data aware user annotations and the possibility to temporarily revert the graph view to a previous state. Both features enable analysts to communicate insights to subsequent analysts. The heat map visualization gives attention to the second and third challenges and allows analysts to quickly estimate which regions have been of interest to other users as well as to get an overview of the changes that where performed on graph objects. However, right now the focus of our tool lies in the exploration of biochemical networks, which usually do not require the users to drastically change the layout of the graph. For our application example, all analysts share the same view on the graph. Sensemaking and provenance for other kinds of networks, that require a more dynamic layout raises the need to discuss and address the two remaining challenges. R EFERENCES [1] KEGG: Kyoto Encyclopedia of Genes and Genomes. Accessed 10th July 2014. [2] J. Heer and M. Agrawala. Design considerations for collaborative visual analytics. Information Visualization, 7(1):49–62, Feb. 2008. [3] J. Heer, J. Mackinlay, C. Stolte, and M. Agrawala. Graphical Histories for Visualization: Supporting Analysis, Communication, and Evaluation. IEEE Transactions on Visualization and Computer Graphics, 14(6):1189–96, 2008. [4] J. Heer and B. Shneiderman. Interactive dynamics for visual analysis. Commun. ACM, 55(4):45–54, Apr. 2012. [5] J. Heer, F. Vi´egas, and M. Wattenberg. Voyagers and voyeurs: Supporting asynchronous collaborative information visualization. In ACM Human Factors in Computing Systems (CHI), pages 1029–1038, 2007. [6] S. Kandel, J. Heer, C. Plaisant, J. Kennedy, F. van Ham, N. H. Riche, C. Weaver, B. Lee, D. Brodbeck, and P. Buono. Research directions in data wrangling: Visualizations and transformations for usable and credible data. Information Visualization, 10(4):271–288, 2011. [7] F. Schreiber, C. Colmsee, T. Czauderna, E. Grafahrend-Belau, A. Hartmann, A. Junker, B. H. Junker, M. Klapperst¨uck, U. Scholz, and S. Weise. MetaCrop 2.0: Managing and Exploring Information about Crop Plant Metabolism. Nucleic Acids Research, 40(Database issue):D1173–7, Jan. 2012. [8] A. B. Vi´egas, M. Wattenberg, F. V. Ham, J. Kriss, and M. Mckeon. Many eyes: A site for visualization at internet scale. In Proceedings of Infovis, 2007. [9] B. Zimmer and A. Kerren. Collaborative Graph Exploration in a WebBased Environment. Information Visualization. Submitted to journal in July 2014. [10] B. Zimmer and A. Kerren. Applying Heat Maps in a Web-Based Collaborative Graph Visualization. In Poster Abstracts. IEEE Information Visualization (InfoVis ’14), 2014.