Sensitivity of Coverage-Based Software Reliability Models to Variations in the Operational Profile Odair Jacinto da Silva, Marcos Lordello Chaim, Adalberto Nobiato Crespo (Co-orientador), Mario Jino (Orientador) Departamento de Engenharia de Computação e Automação Industrial (DCA) Faculdade de Engenharia Elétrica e de Computação (FEEC) Universidade Estadual de Campinas (Unicamp) Caixa Postal 6101, CEP 13083-970 – Campinas, SP, Brasil
[email protected],
[email protected],
[email protected],
[email protected]
Abstract Software in production may be utilized by users with diverse profiles. The way software is used affects the reliability perceived by its users; that is, software reliability may not be the same for different operational profiles. Two software reliability growth models based on structural testing coverage were evaluated with respect to their sensitivity to variations in operational profile. An experiment was performed on a real program (SPACE) with real defects, submitted to three distinct operational profiles. Testing coverage was measured according to the following criteria: all-nodes; all-arcs; and all-potential-uses. Reliability measured for each operational profile was compared to the reliabilities estimated by the two models; estimated reliabilities were obtained using the coverage for the three criteria. Results from the experiment show that the predictive ability of the two models is not affected by variations in the operational profile of the program. They also reinforce the soundness of the approach that uses code coverage information to derive software reliability models. Keywords: software reliability, operational profile, software test, test-coverage, testing criteria. 1. Introduction Some of the first studies and models of software reliability were proposed by Jelinski and Moranda [1] and Shooman [2]. In the eighties, research effort on software reliability became more intense and many other models appeared. Software testing time is adopted as the control variable for estimating software reliability by most of these models. Nonetheless, several experiments and studies have shown the existence of a close relationship between code coverage and software reliability [3]. An early experiment using control-flow and data-flow based testing was conducted by Frate, Mathur and Pasquini [4]; their results provide evidence of a relationship between software reliability and coverage of elements required by the testing criteria. Another experiment, by Crespo et al. [5], investigates the relationships between software reliability and coverage of elements required by the following testing criteria: all-nodes, all-arcs, and the data-flow based family of criteria – potential-uses, all-potential-uses, all-potentialuses/du, and all-potential-du-paths [6].
The approach of reliability estimation making use of test coverage based models has been motivated from these studies; this approach has achieved better results than those from the traditional approach [7], [8]. For measuring software reliability, the inputs to the program are chosen according to the estimated probability with which they occur in production, forming the operational profile. Software in production may be utilized by users with diverse profiles. The way software is used affects the reliability perceived by its users; that is, software reliability may not be the same for different operational profiles. Hence, operational profiles are an important factor in software reliability estimation. Many authors report results showing the close relationship between software reliability and operational profile [9], [10]. We aim to assess the robustness, with respect to different operational profiles, of two software reliability models based on code coverage. A robust model can be used to estimate precisely the software reliability for different user profiles. The first model, called Binomial Software Reliability Model Based on Code Coverage – BMBC [7], adopts the main assumption that software contains a finite number of faults. The second model, called
Infinite Failure Software Reliability Model Based on Code Coverage – IFMBC [8], adopts the main assumption that software contains an infinite number of faults. Three distinct operational profiles were used to evaluate the sensitivity of these models to variations in the operational profile of software; for this purpose, results from the application of the two models to estimate the reliability of a program for these operational profiles were analyzed. 2. Description of the Experiment The application software used in the experiment was developed by the European Space Agency – ESA, in the language C; it consists of approximately 10,000 lines of code, 6,000 being lines of executable code. The system comprises a main program and 134 routines interconnected through parameters. 33 faults were revealed, corrected, and recorded during the integration testing and the operational use of the software; thus, the recorded failures in the software were caused by real faults detected in testing and in the operational use of the system. To conduct the experiment 29 faults were reinserted in the software. In the experiment, 24, 28 and 25 faults of the 29 reinserted faults were detected, depending on the operational profile. 2.1 Operational Profiles Operational profiles for program SPACE are defined based on its functions. A control flow graph represents the connections among the functions; each node in the graph represents a function. Two nodes are connected by an arc in the graph if control can flow between them. A path from the start node to the final node of the graph represents one execution of the program. A relative frequency value is assigned to each arc connecting two nodes. An operational profile is defined by assigning relative frequency values to all arcs of the graph. 2.2 Reliability and Coverage Measurement The values of reliability were estimated using Nelson's method [12], that is, the “brute force” method, to establish the relationship of software reliability to other variables. In this method, for each occurrence of a failure and after the removal of the corresponding fault, the software is executed with thousands of randomly generated test data. The ratio is calculated between “ne”, the number of executions with failure, and “n”,
the total number of executions of the software. This ratio is an estimate of the probability of occurrence of a failure in the software. The reliability of the software is then estimated as:
R = 1−
ne n
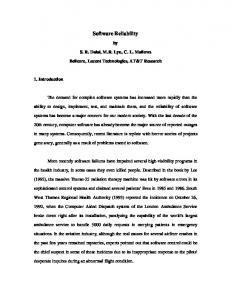
For each fault removed from the software, the method is applied again to recalculate the reliability. Thus, an estimate of the behavior of the reliability growth of the software is obtained as a function of fault removal. Notice that reliability is always calculated after the removal of a fault. This procedure was done for each operational profile. Table 1 shows the measured reliabilities for the three operational profiles. The first column of each table shows the accumulated number of removed faults; the second column shows the removed fault identification; the third column shows the number of test data between consecutive failures; the fourth column, the number of accumulated test data; and the fifth column, the measured reliability. Figure 1 shows graphically the measured reliability for each operational profile. Table 1 – Measured Reliability – OP1 Removed Faults 1 2 3 4 5 6 7 8 9 10 11 12 13 14 15 16 17 18 19 20 21 22 23 24
Fault # Test Data # Accumul. Identifier Between Test Data Failures 6 1 1 10 1 2 15 1 3 16 1 4 20 1 5 21 1 6 24 1 7 28 1 8 9 2 10 11 2 12 19 2 14 25 2 16 13 6 22 5 7 29 14 7 36 2 19 55 23 20 75 17 31 106 7 63 169 8 63 232 22 216 448 27 243 691 12 250 941 18 250 1191
Measured Reliability 0,0078 0,0078 0,0102 0,0102 0,0102 0,0102 0,0102 0,0464 0,1278 0,1585 0,2101 0,5147 0,5879 0,8384 0,8734 0,8995 0,9165 0,9463 0,9710 0,9869 0,9927 0,9961 0,9961 0,9987
Code coverage was determined using POKETOOL, a coverage analysis tool [13], for the following test criteria: all-nodes, all-arcs, and allpotential-uses.
2.3 Steps of the Experiment The following steps were performed for each operational profile (OP1, OP2, and OP3): • Test data generation: test data are generated randomly according to the relative frequencies given by the operational profile.
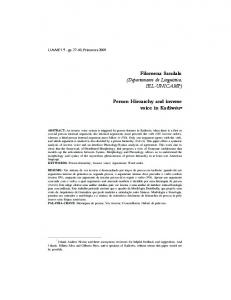
reliability is a software characteristic associated intrinsically to each operational profile. It can also be seen that values estimated by the model, for the three profiles, are well fitted to the values of the measured reliability. For all profiles the hypothesis of equality of the measured reliability and estimated reliability is not rejected. Estimated Reliability BMBC - OP1
Reliability
Nodes
Figure 1 - Measured Reliability for the Operational Profiles
Arcs
PU
Measured
1 0,9 0,8 0,7 0,6 0,5 0,4 0,3 0,2 0,1 0 1
10
100
1000
10000
Number of Test Data
Figure 2 – Reliabilities for BMBC - OP1
• Coverage measurement: for each test criterion, the correspondent coverage achieved by the generated test data is determined. • Reliability measurement: after the occurrence of each failure in the program, the detected fault is removed and the reliability is measured using Nelson’s method. • Reliability estimation: reliability models BMBC and IFMBC are applied to estimate reliability growth for the operational profile. • Reliability comparison: measured reliability is compared to reliability estimated by the models, visually in the figures and statistically by the Kolmogorov-Smirnov test. The results from the comparison between the measured reliability and the reliability estimated by the models, for the three operational profiles, would provide an indication of the robustness of the models with respect to variation in the operational profile.
Table 2 – Kolmogorov-Smirnov Test for Measured and Estimated (BMBC) Reliabilities
K-S Statistics 0,2608
OP1
Decision Accept Ho
3.2 Results and Analysis for IFMBC Figure 3 shows the growth curves for both, the measured reliability and the estimated reliability for profile OP1. It can also be seen that estimated reliability growth curves are practically identical for all the criteria. In this case, the values estimated by the model, for the three profiles, are also well fitted to the values of the measured reliability. For all the profiles the hypothesis of equality of the measured reliability and estimated reliability is not rejected. Estimated Reliability IFMBC - OP1
3. Analysis of the Results
Nodes
Reliability
3.1 Results and Analysis for BMBC Due to space restriction only results from the operational profile 1 will be showed. Figure 2 shows the growth curves for both, the measured reliability and the estimated reliability for profile OP1. Reliability was estimated using the coverage of each test criterion. It can be seen that estimated reliability growth curves are practically identical for all the criteria, as they should be, since
= 1% 0,4347
Arcs
PU
Measured
1 0,9 0,8 0,7 0,6 0,5 0,4 0,3 0,2 0,1 0 1
10
100
1000
Number of Test Data
Figure 3 – Reliabilities for IFMBC – OP1
10000
Table 3 – Kolmogorov-Smirnov Test for Measured and Estimated (IFMBC) Reliabilities
OP1
K-S Statistics 0,3333
= 1% 0,4583
Decision Accept Ho
4. Conclusions We evaluated the sensitivity to variations in the operational profile of two coverage-based software reliability growth models. An experiment was carried out with program SPACE with this purpose, using three distinct operational profiles. • The experiment has shown that models BMBC and IFMBC are sensitive to distinct operational profiles, that is, variations in the operational profile do not affect the predictive ability of the models: estimated reliabilities are very close to measured reliabilities for the three operational profiles. • Graphical analysis (Figures 2 and 3) indicates a very good fitness of the estimated reliabilities to the measured reliabilities. • This good fitness is also shown statistically in Tables 2 and 3. • The desirable property of underestimation of the reliability holds for both models for the three operational profiles. • A threat to the validity of the experiment is that it is a single program experiment; similar experiments should be performed with programs from different application domains. 5. References [1] Jelinski Z. and Moranda P. B., “Software Reliability Research”, Proceedings of the Statistical Methods for the Evaluation of Computer System Performance, Academic Press, 1972, pp. 465-484. [2] Shooman, M. L., “Probabilistic Models for Software Reliability Prediction,” Statistical Computer Performance Evaluation, W. Freiberg, Ed. New York: Academic Press, 1972, pp. 485-502. [3] Garg, P., “Investigating Coverage - Reliability Relationship and Sensitivity of Reliability to Errors in Operational Profile”, Technical Report - Department of Computer Sciences, Purdue University, West Lafayette, May 1994. [4] Frate, F. D.; Garg, P.; Mathur, A. P. and Pasquini, A., “Experiments to Investigate the Correlation Between Code Coverage and Software Reliability”, SERC-TR-162-P, Software Engineering Research Center, Purdue
University, West Lafayette, Indiana 47907, April 1995. [5] Crespo, A. N.; Pasquini, A.; Jino, M. and Maldonado, J. C., “Cobertura dos Critérios Potenciais-usos e Confiabilidade do Software”, Anais do XI Simpósio Brasileiro de Engenharia de Software - Fortaleza, 1997 (in Portuguese). [6] Maldonado, J. C.; Chaim, M. L.; e Jino, M., “Bridging the Gap in the Presence of Infeasible Paths: Potential Uses Testing Criteria”; XII International Conference of the SCCC, Sociedad Chilena de Ciencia de la Computacion, Santiago, Chile, 1992, pp. 323340. [7] Crespo, A. N.; Pasquini, A.; Jino, M. and Maldonado, J. C. “A Binomial Software Reliability Model Based on Coverage of Structural Testing Criteria”. Empirical Software Engineering, Springer US, 2008. [8] Crespo, A. N.; Pasquini, A.; Jino, M. and Maldonado, J. C. “Coverage Based Approach Applied to Derive an Infinite Failure Software Reliability Model”, Technical Report/ DMPS/CenPRA, submitted for publication, 2008. [9] Musa, J. D. “Operational Profiles in Software Reliability Engineering”. IEEE Software, Vol 10, No. 2, March 1993. [10] Pasquini, A., Crespo, A. N.; Matrella, P. “Sensitivity of Reliability-Growth Models to Operational Profile Errors vs Testing Accuracy”, IEEE Transactions on Reliability, Vol 45, nº4, December 1996, pp. 531-540. [22] Weyns, K.and Runesson, P. “Sensitivity of software system reliability to usage profile changes”. Proceedings of the ACM Symposium on Applied Computing, 2007. [11] Musa, John D., Sofware Reliability Engineering, Osborne/McGraw-Hill, July 1998. [12] Nelson, F., “Estimating Software Reliability From Test Data”, Microelectronics and Reliability, 1978, pp. 67-73. [13] M. L. Chaim, "POKE-TOOL - A Tool to support Structural Program Testing based on Data Flow Analysis", School of Electrical and Computer Engineering, University of Campinas, Campinas, SP, Brazil, April 1991, (In Portuguese).