Sensitivity of the INCA model to N process parameters and hydrological input K. Rankinen, A. Lepistö and K. Granlund Finnish Environment Institute, P.O.Box 140, FIN-00251 Helsinki, Finland (
[email protected]) Abstract: The Integrated Nitrogen in CAtchments (INCA) model simulates nitrogen transport and processes within catchments. It was applied to the Simojoki river basin in northern Finland where major human impacts are forest management and atmospheric nitrogen deposition. In this work the main emphasis is to evaluate the sensitivity of the INCA model to hydrological input. Parameters defining vegetation nitrogen uptake and denitrification rate were also studied. A simple univariate parametric (one-at-a-time) sensitivity analysis was conducted for NO3-N leaching, NH4-N leaching and denitrification in forest cut areas. Mineral nitrogen leaching was mainly influenced by hydrologically effective rainfall (HER). The parameter that controls denitrification rate had more influence than hydrological input parameters on the total amount of N that has been denitrified. There were only minor differences in parameter ranking between land use classes studied. Keywords: Dynamic modelling; N processes; Sensitivity analysis; Relative sensitivity 1.
INTRODUCTION
The Integrated Nitrogen in CAtchments (INCA) model [Wade et al. 2002] was applied to the Simojoki river basin (3160 km2) in northern Finland where major human impacts are forest management and atmospheric nitrogen (N) deposition. The INCA model is a semi-distributed, dynamic nitrogen model which simulates nitrogen transport and processes in six land use classes within catchments. Sources of nitrogen can be from atmospheric deposition, from the terrestrial environment or from direct discharges. Hydrologically effective rainfall (HER) is used to drive the nitrogen fluxes through the catchment system. In this application HER was derived from the results of the Watershed Simulation and Forecast System (WSFS), which simulates hydrology either on a sub-basin or on a river basin scale [Vehviläinen 1994]. Forest management can affect many aspects of river basin hydrology and nitrogen dynamics. Total runoff generally increases with forest disturbance as a result of reduced interception and transpiration. Nitrogen is considered to be the growth-limiting factor in most terrestrial ecosystems and natural ecosystems are characterized by a tight internal cycling of N.
317
Leaching losses and gaseous losses are generally less than a few kg N ha-1 [Gundersen and Bashkin, 1994]. High leaching losses may occur after clear cutting due to enhanced mineralization and nitrification, and reduced N uptake of vegetation [Seuna, 1988]. Lowering of the water table by forestry ditching may also increase gaseous losses from nutrient rich peatland although it has a minor effect on poor peatlands [Martikainen et al. 1993]. Sensitivity analysis is primarily concerned with the question of how model outputs are affected by the variability of the model parameters and input values. It gives useful information when these components are incompletely known or if they are subject to changes or misspecifications. Sensitivity analysis provides the modeller with a list of parameters classified according to their influence on the model results. The analysis helps to identify which parameters have the most significant impact on the results. There are several different ways to conduct sensitivity analysis [Hamby, 1994]. In this work the main emphasis is to evaluate the sensitivity of the mineral N leaching and denitrification to the hydrological input. One reason for the study is to find out if hydrological input was described in enough detail this kind of modelling procedure. Also vegetation N uptake is
Lake Simojärvi 64.03
64.06
64.07
64.09 64.05 64.04
. 64.08
4
Hosionkoski 64.01 64.02
Simojoki outlet
0
20
40 km #
Helsinki
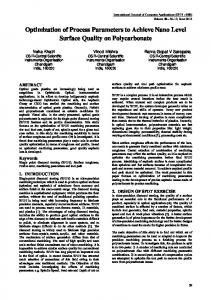
Figure 1. Location of river Simojoki basin (sub-basins 64.01-64.09) in the northern Finland of interest, because the number of the land-use classes is restricted and thus the age-distribution of the vegetation cannot be taken into account. A simple univariate parametric (one-at-a-time) sensitivity analysis is conducted for the INCA model. The model outputs studied are NO3-N and NH4-N leaching and the total amount of N denitrified. 2.
MATERIAL AND METHODS
2.1
INCA model
On the basis of earlier work by [Whitehead et al. 1998], a new version of the INCA model has now been developed. The structure of the new version differs from the original, in which soil-water retention volumes have been added and the process equations are now written in terms of loads rather than concentrations [Wade et al. 2002]. The INCA model is a semi-distributed, deterministic, dynamic nitrogen model which simulates and predicts nitrogen transport and processes within catchments. Sources of nitrogen can be from atmospheric deposition, from the terrestrial environment or from direct discharges. The model can simulate N processes in six land use classes simultaneously. There are three components included; the hydrological model, the catchment N process model and the river N process model. Hydrologically effective rainfall (HER) is used to drive the nitrogen fluxes through the catchment system. In this application HER is derived from the
318
results of the Watershed Simulation and Forecast System (WSFS) [Vehviläinen, 1994]. The basic component of WSFS is a conceptual hydrological model which simulates runoff either on sub-basin or on river basin scale using precipitation, potential evaporation and temperature as inputs. WSFS takes into account soil frost and snow melt processes, which dominate river discharge in winter and early spring. Spatially uniform, lumped input data are calculated for the whole river basin and spatially semi-distributed input data are calculated for each of the nine sub-basins. Rankinen et al. [2000] showed that when comparing discharges simulated by the INCA model with observed values, a better fit was obtained with the semi-distributed hydrological input data (sub-basin scale) than the spatially uniform one (river basin scale). The timing of flow peaks was simulated quite well with both approaches, although the semi-distributed input data gave a more reasonable simulation of low flow periods and the magnitude of spring flow peaks. INCA models plant uptake of NH4-N and NO3-N, nitrification, denitrification, mineralisation and immobilisation within each sub-catchment. It uses a generalised set of equations with parameter sets specifically derived for the six different land use classes. By modifying these parameters N fluxes from each of the transformations for a given land use can be calibrated against experimental and field data available in the literature. Microbial N transformations are temperature and moisture dependent. Soil Moisture Deficit (SMD) and HER are given as inputs.
2.2
Area description
The river Simojoki discharges into the Gulf of Bothnia in the Baltic Sea. The river basin (3160 km2) is composed of nine sub-basins (Figure 1) [Ekholm, 1993]. Over the period 1961-1975, annual precipitation was 650-750 mm, mean annual evapotranspiration about 330 mm and annual runoff 350-450. There are about 170-180 winter days and the mean annual temperature is +0.5 - +1.5 oC. The duration of the snow cover is from the middle of November to May. The river Simojoki freezes at the end of October or at the beginning of November and the ice cover usually breaks up in the middle of May.
where O is the output value, OBC is the output value for the base-case scenario, I is the input value, and IBC is the original input value for the base-case scenario. The larger the index, the more influence a parameter has. A MAROV of unity means that a variation in the model input by x% will result at most in the same variation (x%) in the model output.
The river Simojoki is a salmon river in near-natural state, and the dominant human impact is forestry, mainly forest drainage and cutting. Peatlands and peatland forests are common in the region and an average of 0.5% of the total catchment area is felled annually. Forestry drainage was most intensive during the 1960s and 1970s, and by 1991 over 30% i.e. 1000 km2 of the total catchment area had been drained. Urban areas cover only 0.06% and agricultural fields 2.7% of the catchment [Perkkiö et al. 1995]. In this application the six land-use classes are: forest on mineral soil, cut forest on mineral soil, forest on organic soil, cut forest on organic soil, agriculture and open surface water. Land use classes are derived from the satellite image based land use and forest classification of Finland [Vuorela, 1997], in which the different soil types are based on soil maps. In parameterization of the forest cut areas final cuttings were assumed, as well as forestry ditching on organic soils.
Sensitivity analysis was conducted for HER, SMD and parameters defining vegetation N uptake (NO3 uptake rate, NH4 uptake rate and maximum uptake) and denitrification (denitrification rate). Atmospheric deposition was left out of this study, because it is typically very low in northern Finland. Studied outputs were NO3-N leaching, NH4-N leaching and denitrification. Studied land-use classes were forest cut areas on mineral soil and on organic soil. Total amount of vegetation N uptake and total amount of N denitrified were calibrated to values found in the literature [Mälkönen, 1974, Martikainen et al. 1993, Martikainen et al. 1994, Regina et al. 1996, Nieminen, 1998, Paavilainen and Smolander 1998, Smolander et al. 1998]. Ranges of parameters were based on expert judgement, and spatial field variability and possible measurement errors reported in the literature. The range of HER and SMD were based on the variation between different sub-catchments [Rankinen et al. 2002] and on the effects of forestry measures reported in the literature [Seuna, 1988, Alatalo, 2000]. The base-case scenario was run by using the lumped hydrological input of the year 1996. This year corresponded well with the long-term average flow and, in particular, the volume and timing of the spring flood was in good agreement with observations.
2.3
3.
Sensitivity analysis
One-at-a-time sensitivity analysis is one of the simplest ways of investigating the sensitivity of a model [Hamby, 1994]. It consists in varying one parameter at a time while holding the others fixed. In the current study the method of relative sensitivity is used. The sensitivity of the model is assessed via an index representing the influence of the change of a particular parameter as compared to the base-scenario, in which all the parameters has nominal values. Dubus et al. [1999] and Dubus [2002] presented the procedure of the Maximum Absolute Ratio of Variation (MAROV). Relative sensitivity for each model input parameter was calculated as follows:
(O − OBC ) × I BC MAROV = MAX (I − I BC ) OBC
RESULTS AND DISCUSSION
Relative sensitivity was