Interaction with the Environment: Sensor Data Visualization in Outdoor Augmented Reality Sean White Department of Computer Science, Columbia University Department of Botany, Smithsonian Institution
ABSTRACT Proliferating sensor systems provide a rich source of data for understanding the dynamic characteristics of the environment. Visualization of, and interaction with, such data in outdoor augmented reality poses several challenges for infrastructure, representation, interactive data collection, and information discovery and filtering. We discuss these challenges in the context of our experiences with an example system. KEYWORDS: outdoor augmented reality, situated visualization, sensors INDEX TERMS: H.5.1 [Information Interfaces and Presentation]: Multi-media Information Systems—Artificial, augmented, and virtual realities; H.5.2 [Information Interfaces and Presentation]: User Interfaces—GUI 1
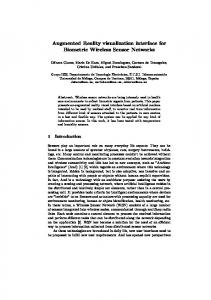
Figure 1. Example situated visualization of carbon monoxide (CO) data. Altitude of spheres represents CO ppm level. Position of spheres represent location of sensor during data acquisition.
INTRODUCTION
In our vision of a future outdoor augmented reality (AR), the world is filled with a media ecology of many co-existing experiences. These experiences include canonical example applications such as annotated buildings or points of interest in urban settings, first person driving or walking guidance (wayfinding), interactive games, helpful avatars and agents, historical or informational overlays on modern sites, and visualizations about the surrounding environment. Each of these different experiences provides new challenges for the AR community and requires new technical advances. Many of the existing outdoor AR challenges are familiar. How do we make optical or video see-through displays that work well in sunlit outdoor conditions? How can we achieve millimeter tracking and registration in urban canyons and difficult settings? In this position paper, we focus on a distinct aspect of the outdoor AR experience: acquiring and visualizing sensor data as a means of enhancing our perception of the physical world. Consider the situated visualization example of carbon monoxide (CO) in our SiteLens system (Figure 1) [8]. From our use and evaluation of the system, several new challenges arise when investigating the integration of sensors, not for tracking, but rather for enhancing perception of the world. • What architecture and infrastructure best supports sensor data visualization? • How are the sensors placed in the physical world? Are they mobile or stationary? Can they be used in tandem with visualization to direct gathering new data? • What are the best representations and layout for individual visualizations and collections for related and unrelated visualizations?
•
2
Given a proliferation of sensor systems, how is a given set of data discovered and how are vast collections filtered?
ARCHITECTURE AND INFRASTRUCTURE
Our current architecture maintains a collection of visualizations under a visualization manager and data input from a data importer and context services (Figure 2) [7]. While the architecture supports multiple visualizations in the scene, it does not support the dynamic discovery or creation of data as part of any larger infrastructure. Reitmayr and Schmalsteig developed an infrastructure for outdoor information browsing that was meant to address large scale data sets[5]. However, the data in their system was static, not dynamic as one would find in sensor data. Existing iinfrastructure for maintaining scalable representations
[email protected] Figure 2. SiteLens architecture diagram
of such dynamic data sources does not meet the needs of AR visualization. Chang et al. have developed the SensorBase system [2] which associates sensor data blogs with geocodes, but groups of sensors are not related and characteristics that might be useful for AR visualization, such as orientation or preferred visual representation, are not present. 3
SCENE AWARE LAYOUT AND REPRESENTATIONS
The specific visual representations and spatial layout of sensor data visualizations are based on the dynamics of the scene and the data itself. Moreover, sensor data visualization is distinct from annotation or display of models in that data may often be interpolated across multiple sensors or extrapolated into simulations. Spatial layout of labels and annotations in AR typically takes into account location and orientation of other objects in the visual field based on existing models of the scene [1]. However, we believe a combination of cues that include the underlying content and texture of the scene together with spatial layout of existing objects will provide a better guide for layout of situated visualization. To achieve this, algorithms for presentation, layout, and even rendering should be guided by perceptual and cognitive principles for combining the physical with the virtual. While Schall et al [6] have developed techniques for visualizing representations of static models, the challenges of dynamic representations may need to take the scene into account. Kalkofen [4] approaches this aspect of representation by looking at the context of the focus of attention in complex models, but remains within the bounds of static scenes. 4
DATA PAINTING AND DIRECTED SENSING
One interesting observation regarding the SiteLens system was that the data was considered “stale” because it had been collected a month prior to the study. As the following quote indicates, participants in our study expressed a desire to have live or dynamic sensing coupled with existing data: It could still add more information to the analysis in different ways, ways that turn passive observation into overt surveillance […] to generate more qualitative information about a place, like how people perceive the environment, or how people sense pollution without really knowing if it’s there. These perceptions could help with the phase of design in which interviews and site surveys are done, but only with a handful of people. (anonymous participant).
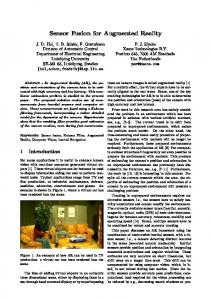
Figure 3. Wireless Bluetooth CO sensor prototype.
need for algorithms and infrastructure for discovering the presence of hidden information and filtering visualizations so that only the salient and useful information is left. Julier et al. [3] have provided some initial work in this area, but we see a need for a comprehensive solution to the problem both in terms of the algorithms and user interface. Our initial interface uses proximity for discovery and simple selection for filtering. However, we must look beyond interfaces that simply provide hierarchical lists for selection and filtering. 6
ACKNOWLEDGEMENTS This research was funded in part by NSF Grant IIS-03-25867 and a grant from the Boston Society of Architects. Steven Feiner, Sarah Williams, Petia Morozov, Ohan Oda, and Steve Henderson have all informed this work through invaluable discussions. REFERENCES [1] [2]
Based on initial usage of the SiteLens prototype, we are interested in increasing the dynamics and symmetry of sensing and visualization by extending the system to live sensor data. In doing this, we want to close the gap between the act of sensing and the act of visualization. One approach to this involves the use of mobile sensors, which can be used for “painting” data as it is sensed, in real time, on the scene. Feedback from our users suggests that this would provide a way for them to further explore unknown regions by guiding them towards areas of interest through their own actions. We have prototyped an example mobile sensor which can be used together with a fiducial marker or similar tracker (Figure 3).
[3]
5
[7]
DISCOVERY AND FILTERING OF VISUALIZATIONS
In our vision of situated visualization, a user will eventually have easy access to a wealth of information for any given object or scene in the world. This, combined with large data sets, will certainly lead to information overload. To address this, we see a
CONCLUSIONS
In this position paper, we have discussed several challenges for sensor data visualization in outdoor augmented reality. In particular, we have focused on architecture and infrastructure, data layout and representation, dynamic and directed sensing, and discovery and filtering issues. While our initial example here deals with CO sensor data, we plan to explore this research in the context of a wider variety of sensor types and applications including geocoded botanical species identification.
[4]
[5]
[6]
[8]
B. Bell, S. Feiner, and T. Höllerer, "View Management for Virtual and Augmented Reality," Proc. ACM UIST, 2001, pp. 101-110. K. Chang, N. Yau, M. Hansen, and D. Estrin, "Sensorbase.org-a centralized repository to slog sensor network data," Center for Embedded Network Sensing 2006. S. Julier, M. Lanzagorta, Y. Baillot, L. Rosenblum, S. Feiner, T. Höllerer, and S. Sestito, "Information filtering for mobile augmented reality," in Proc. ACM and IEEE ISAR, 2000, pp. 3-11. D. Kalkofen, E. Mendez, and D. Schmalstieg, "Interactive Focus and Context Visualization for Augmented Reality," Proc. IEEE and ACM ISMAR, Nara, Japan, 2007, pp. 191-200. G. Reitmayr and D. Schmalstieg, "Collaborative Augmented Reality for Outdoor Navigation and Information Browsing," Proc. Symp. Location Based Services and TeleCartography, pp. 31-41, 2004. G. Schall, E. Mendez, E. Kruijff, E. Veas, S. Junghanns, B. Reitinger, and D. Schmalstieg, "Handheld Augmented Reality for Underground Infrastructure Visualization," Journal of Personal and Ubiquitous Computing, vol. 13, pp. 281-291, May 2009. S. White, "Interaction and Presentation Techniques for Situated Visualizations," PhD Diss., New York: Columbia University, 2009. S. White and S. Feiner, "SiteLens: situated visualization techniques for urban site visits," Proc. ACM CHI, Boston, MA, USA, 2009, pp. 1117-1120.