Sensor Web Interoperability Testbed Results Incorporating Earth Observation Satellites Nadine Alameh, Ph.D. Stuart Frye Dan Mandl Myra Bambacus MobiLaps /NASA GIO NASA GIO NASA EO-1 Mission NASA EO-1 Mission
[email protected] [email protected] [email protected] [email protected] Pat Cappelaere Vightel Inc.
[email protected]
Peisheng Zhao Stefan Falke Linda Derezinski Wash University St. Louis Integrated Business Solutions George Mason University
[email protected] [email protected] [email protected] Greenbelt, Maryland, USA
Abstract—This paper describes an Earth Observation Sensor Web scenario based on the Open Geospatial Consortium’s Sensor Web Enablement and Web Services interoperability standards. The scenario demonstrates the application of standards in describing, discovering, accessing and tasking satellites and groundbased sensor installations in a sequence of analysis activities that deliver information required by decision makers in response to national, regional or local emergencies. Index Terms—NASA, Geoscience, Services, Interoperability, Earth Science, Architecture, Sensor Web I.
OVERVIEW
N
ASA has been experimenting with autonomous sensor webs to improve science return on its earth observing capabilities [1]. Over the last five years, significant research has been performed in this area includes a wide range of scientific applications and national priorities [2]. In support of the Open Geospatial Consortium’s (OGC) Web Services testbed Phase 4 (OWS-4), a team of researchers and technologists in the Earth observing field got together to apply the OGC services and sensor web standards in a scenario involving interoperable discovery, access and integration of geoscience data and sensor results. The goal was to showcase the applications of OGC standards within the Earth Observation community and to demonstrate the value of interoperability in that environment [3].
The team consisted of the NASA Goddard Space Flight Center (GSFC) Geoscience Interoperability Office (GIO) and the Real-time Software Branch, Washington University at St. Louis (WUSTL), Vightel Corporation, Noblis (formerly Mitretek), Innovative Solutions Inc., the Jet Propulsion Laboratory (JPL), and George Mason University (GMU). The scenario aimed at providing Geographic Information
System (GIS)-ready sensor and other infrastructure data to support a response to a simulated emergency. The particular subset of OWS-4 results accomplished by the Earth Observation team used standard web services to task remote sensing satellites and to deliver hyperspectral data of the target area as user-customized classifier outputs. To find out more about the overall OWS-4 results, go to the http://www.opengeospatial.org website. The following suite of OGC standards were implemented by the various components of the scenario - Sensor Observation Service (SOS) - Sensor Planning Service (SPS) - Sensor Alert Service (SAS) - Web Processing Service (WPS) - Catalog Service for the Web (CSW) - Web Coverage Service (WCS) - Web Feature Service (WFS) - Web Map Service (WMS) The scenario demonstrated the value of interoperability in - Quickly discovering relevant and up-to-date assets, services and sensors - Ordering real-time custom products with guaranteed delivery to any location in the world - Subscribing to data/service/sensor feeds and getting real-time notifications when information is available - Integrating needed data on the web for free (using a special click-through license for trusted identity providers) II.
USER/OPERATIONS CONCEPT
The NASA-centric scenario linked the sensor services capabilities by tasking multiple satellites to image the target site based on a request from an emergency response analyst [4]. One of the satellites used in the scenario demonstration was NASA’s Earth Observing-1 (EO-1; http://eo1.gsfc.nasa.gov)
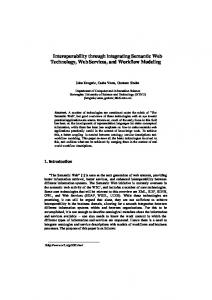
satellite which, due to having the nearest next in-view time for the target, resulted in being the satellite that was tasked. The scenario (Figure 1) began by allowing the user to identify the target location on a web map client selecting the area of interest and then automatically using the latitude and longitude returned by the map to generate a tasking request for the EO-1 satellite. The satellite images of the target were taken on the first available overflight opportunity as determined by the Sensor Planning Service for each of the satellites. Data processing activities were then chained together as a sequence of processing steps into a workflow: that retrieved the Level 1G image data from the satellite Sensor Observation Service, subsetted it, re-projected the subset into a different grid required by an algorithm, ran the algorithm against the data, and displayed the output on a web map client. All data, services and analysis outputs used in the process were discovered by querying the NASA Earth Science Gateway (ESG) [5]. ESG facilitates discovery and access of NASA’s extensive Earth Science information systems and research results. In doing so, ESG supports the science community and NASA’s partners. ESG and the other elements of the testbed implement consensus-based, publicly accessible
ESG in particular provides local and distributed search and harvest; visualization of remote data via Web services; publishing of data and services, and user personalization. In order to function as a GEOSS interoperability platform, ESG is incorporating standards-based technologies to support the observing, processing, and dissemination methods provided by various parties while retaining their ownership and operational responsibilities for such purposes. III.
SATELLITE TASKING AND MONITORING
The EO-1 satellite tasking and data delivery part of the testbed was based on the OGC standard Geobliki data node providing tasking access and data delivery of EO-1 hyperspectral data to a sequence of processing nodes that run a flood classifier thumbnail generator. The Geobliki data node (developed by Vightel and Innovative Solutions) [7] contains a Sensor Observation Service (SOS), a Sensor Processing Service (SPS), and a Sensor Alert Service (SAS). The Geobliki SPS allowed users to query the EO-1 orbital predictions to determine tasking opportunities for acquiring the target location on an upcoming orbit. The lat/lon values supplied by the map query to the EO-1 planning web site reNASA Earth Sciences Gateway
“Register”
Catalog Registry Catalog Registry
1 “Discover” “Subscription”
CSW
AOI Sensor ML Capabilities Documents
GMU GeoBrain
4 “Order”
SAS BPEL XML SCRIPT
OGC SWE Data Node
SAS SOS
L1G Subset GEOTIFF UTM
Servic e Chain
“MAP ”
5 “View” WPS
WCS
WMS L1G L1G
WFS 2 “Task”
SPS
WCTS Publishing to SAS
EO1.GEOBLIKI
WUSTL
GMU
DEMIS
NASA Model
Figure 1 OWS-4 Earth Observing Demo Scenario standards for maximum interoperability, and employ web services in support of Service Oriented Architectures. As such, they can contribute to larger System-of-Systems concepts such as the Global Earth Observing System of Systems (GEOSS) [6].
turned the next 5 in-views for the satellite. In addition, another satellite SPS provided by the SPOT mission participants (http://services.eoportal.org) in the OWS-4 testbed also returned tasking opportunities. The second SPS demonstrated the ability of discovering taskable assets across the earth observing domain. In the OWS-4 demonstration, the next EO-1
in-view happened sooner than that of the SPOT satellite for the target area, so as a result, a tasking request was generated and submitted to the EO-1 priority replacement web page.
open source algorithm, the description of the output feature, and the description of the input sensors.
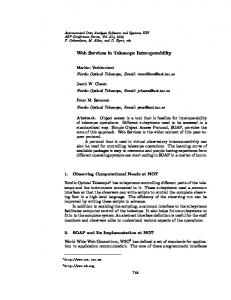
Geobliki monitored the EO-1 operations status web site to determine when the submittal changed from "pending" to "executed" and then submitted a request to the USGS data processing center to order the EO-1 Level 1G data product resulting from that acquisition. When the Level 1G product became available, an Email was sent to the Geobliki client. The Geobliki retrieves the data product and supplies that data to the workflow engine to start the classifier run. IV. WORKFLOW AND WEB PROCESSING SERVICE The flood classifier algorithm was wrapped in a standard processing service by the WUSTL developers providing standard OGC Web Processing Service (WPS) interfaces for GetCapabilities, DescribeProcess, and Execute (http://webapps.datafed.net). The WPS capabilities were documented in an XML formatted package that was published and harvested by sensor web registries (i.e., the ESG). Input sources for the detection algorithm, were also identified in the WPS description so that users could search for the data nodes that supply that type of data and and in addition, could request additional runs on-demand. In addition, those capabilities could be imported and modified to create new outputs. In this workflow, the WPS is a binary grid processing service. The binary operator service combined two grids as inputs, performed a calculation on them, and generated an output grid. The Business Processing Execution Language (BPEL) was used as the workflow engine in the testbed, which required that interfaces to the processing service must use SOAP/WSDL protocols. As a result, the execution of the classifier algorithm processing service was conducted through SOAP/WSDL interfaces rather than the OGC WPS Execute interface. The processing service chain was controlled by the GMU BPEL engine that retrieved 2 selected bands from the Level 1G Hyperion data product provided by the Geobliki data node (http://geobrain.laits.gmu.edu). Those two single band GEOTIFF files were run through a Web Coordinate Transformation Service (WCTS) to convert them from Universal Transverse Mercator (UTM) projection to WMS-84 projection needed by the algorithm, which then were fed into a flood detection algorithm processing service. This process resulted in a final output product which was cataloged. Figure 2 outlines the steps of the BPEL workflow execution, which were translated into a pseudo-code script that executed the desired workflow. In addition, a WPS capabilities document was cataloged and contained the location of the
Figure 2 BPEL Workflow Diagram V.
CONCLUSIONS
The demonstration proved to be successful in showing how disparate systems and components can come together meaningfully and on-demand in order to accomplish scenario objectives and to assist the decision makers in getting the data that they need rapidly. The demonstration success is attributed to the fact that each system/component participating in the scenario implemented consensus-based open standards and services. Interoperability and web services enabled the disparate systems/component to work together to exchange data and information. In terms of future work, the demonstration highlighted the need for the following: - Geospatial Digital Management standards in the sensor tasking step in order to make sure that only authorized users are able to task and control the sensors - Further decouple services in the BPEL engine in order to create a more flexible and extensible overall system - Efficient methods to task sensors in parallel to support further international collaboration - Better understanding of requirements for data access
-
of “raw” and “processed” sensor data, including the relationship between OGC SOS, WCS and WPS specifications Continued work on standards-based web service oriented infrastructures to provide on-demand data to decision makers VI.
FUTURE WORK
During the Spring and Summer of 2007, the sensor web testbed will be expanded to link satellites, an unmanned aerial vehicle (UAV), and in-situ ground sensors in an ad hoc virtual observatory casting every node as a web service that complies with OGC standards. The next scenario is in support of wildfire management. The scenario will start with a set of large wildfires of national importance being selected for sensor web coverage in the Western United States. The selected fires will fall within an upcoming UAV flight path. Local weather data for the demo will be provided by Remote Access Weather Station (RAWS) sensors installed in field locations along the UAV flight line. The Terra satellite Moderate Resolution Imaging Spectroradiometer (MODIS) and Advanced Spaceborne Thermal Emission and Reflection Radiometer (ASTER) instruments direct readouts of hot pixels within the flight path near the selected wildfires will be used to identify the most recent fire locations. EO-1 and UAV data acquisitions of selected targets will be requested based on the most recent fire locations and data products will be automatically delivered according to user-customized subsetting and classification specifications. Wildfires will be selected from the National Interagency Fire Center (http://www.nifc.gov/) daily situation postings. At this website, each fire is identified by fire name, origination point latitude/longitude, and reported start time. The originating location for each of the fires will be retrieved by a web client. The originating fire locations within the UAV flight path will serve as the starting point for construction of sequences of activities that identify the most recent location of each wildfire and then blanket those locations with autonomously triggered follow-up acquisitions by the higher resolution assets. MODIS direct readout hot pixel detections will be provided by the direct readout antenna in Salt Lake City at the Forest Service Remote Sensing Applications Center (RSAC). ASTER classifier outputs will be available at the Jet Propulsion Laboratory (JPL) ASTER website and will be used to provide thermal detection data of particular targets at 30 meters per pixel instead of 250 meters per pixel that is provided by MODIS.
The calculated locations and pixel values from ASTER and MODIS will be collected by a web client based on a query for wildfires. The hot pixel data will be rendered as multi-colored JPG files and overlaid on a map. The recent fire locations will be fed into SPS's for EO-1 and the UAV and the exact targeting opportunities will be calculated based on the MODIS and ASTER detection results. Tasking requests will be constructed and submitted to the SOS's for EO-1 and the UAV to trigger the nearest available data collection opportunity of those targets based on the information provided by the SPS. The tasking requests will contain the location and timing of the future targets of opportunity relative to the flight lines of each platform and in addition will contain requests to run on-board classifiers that will execute on EO-1 and the UAV immediately after the data collection has occurred. The EO-1 and UAV websites will be monitored until confirmation that the image requests have been executed. Automated retrieval of the thumbnails produced on-board EO-1 and the UAV will be performed by the client as soon as those products are available on their respective data nodes. Onboard classifier results will be retrieved by the client based on identifying that the target acquisition has been executed. If the on-board results indicate detection of a phenomena, an alert will be set autonomously by the EO-1 and UAV SOS’s. The on-board thermal thumbnail will be converted/rendered into a .jpg file with a legend by a web rendering service so the results can be displayed on a map by the client. Automated delivery of full Level 1R and Level 1G data products, high resolution browse imagery, and other detection classifier outputs from WPS/WCTS implementations on the ground will also be chained together in workflow sequences. Those results will be made available for retrieval or automatically delivered, depending on the size of the likely transfer (large files retrieved, small files delivered). The UAV is an Ikhana class (civilian version of the General Atomics Predator-B) that will fly out of Dryden with instruments from Ames Research Center (see http://suborbital.nasa.gov/platforms/aircraft/predator-b.html for more information). EO-1 and UAV Level 1G data will be retrieved by a workflow chain which will run web processing services and deliver classifier results consisting of entire images, not just the thumbnails for target area. The RAWS outputs from any installations near the fire are displayed on the web map client along with all the overlaid data products (on-board outputs, browse images, level 1 products, classifier outputs, etc...) from EO-1 and the UAV.
REFERENCES EO-1 alerts will be used to trigger the UAV and UAV alerts will be used to trigger EO-1 acquisitions. This will be in addition to the use of MODIS and ASTER to trigger EO-1 and the UAV. All of this will occur in the same 20 hour block. Cloud cover predictions from the Draper Lab EPOS server will be used to distinguish between multiple potential fire targets along the same flight line as part of a decision support tool used to create the automated workflow service chain. Other geoprocessing models will be added to provide a richer environment for triggering sensor web observation scenarios. ACKNOWLEDGEMENTS
Implementation of the scenario would not have been possible without the support and contributions of the following individuals: Steve Chien (NASA JPL), Danny Tran (NASA JPL), Liping Di (GMU), Kari Hoijarvi (WUSTL), Didier Giacobbo (SPOT).
[1]
[2] [3]
[4]
[5]
[6]
[7]
"Using Autonomy Flight Software to Improve Science Return on Earth Observing One", Journal of Aerospace Computing, Information, and Communication, Vol. 2, April 2005. "An Autonomous Earth Observing Sensorweb", IEEE Intelligent Systems Journal, May/June 2005. "A Service Oriented Architecture to Enable Senor Webs", presented at the Fall 2006 meeting of the American Geophysical Union, San Francisco CA, December 2006. "An Updated Status of Experiments with Sensor Webs and an OGCbased Service Oriented Architecture to Enable Global Earth Observing System of Systems", Mandl D., Frye S., Chien S., Sohlberg R., Cappelaere P., Ungar S., Ames T., presented at Ground System Architecture Workshop 2007, Manhattan Beach CA, March 2007. Alameh, Nadine; Bambacus, Myra & al. “Leveraging Open Standard Interfaces in Providing Efficient Discovery, Retrieval and Integration of NASA-Sponsored Observations and Predictions, 2006 AGU Spring Assembly proceedings (Baltimore, May 2006). Alameh, Nadine; Bambacus, Myra & al. “NASA’s Earth Science Gateway: A Platform for Interoperable Services in Support of the GEOSS Vision”, 2006 IGARSS conference proceedings (Denver, Aug. 2006). "GEOBLIKI: Geo-Data + Blog + Wiki, An OGC Sensor Web Enabled Data Node -- A Data Publisher for Community Collaboration around Geo-Spatial Data", Cappelaere P., Frye S., Mandl D., Derezinski L., presented at the Free and Open Source Software and Geoinformatics (FOSS4G2006) conference in Lausanne, Switzerland, September 2006.