REPORTS variables. Equation 3 can be written as @w1 2 ~1 2 Q !w1~x!#F~x! 5Q
E
f1~x 2 y!w1~y!F~y!d Vy
(5)
V where w1 def [ *w1(y)F(y)d y and this quantity is determined by the condition that F(x) is normalized to unity, namely
E
V
F~x!d x 5 1
(6)
General features of F(x) follow from f1(x 2 y), w1(x) and F(x) being $0. In particular, from Eq. 5, it follows that [ w1 2 (1 2 Q )w1(x)] $ 0. The smallest value of [ w1 2 (1 2 Q )w1(x)] occurs at x 5 (0, 0, . . . , 0) [ 0, where w1(0) 5 1; hence, generally, w1 $ 1 2 Q [closely related results have been derived by Bu¨rger and his collaborators (26, 28, 39)]. The inequality w1 . 1 2 Q and the equality w1 5 1 2 Q lead to qualitatively different forms for F(x), and we discuss these separately. Case i: w1 . 1 2 Q: This case yields, from Eq. 5, Q F~x! 5
E
(7)
F(x) is a peaked but nonsingular function of x, because for x 5 0, the right-hand side is finite. The constant w1 is determined by the condition of normalization (Eq. 6). The application of the normalization condition, Eq. 6, to Eq. 7 leads to the x integral: *f1(x 2 y)/[ w1 2 (1 2 Q )w1(x)]dVx, and this, as a function of w1, is unbounded from above when V 5 1 and V 5 2. As a consequence, irrespective of how small Q is, w1 can be chosen so that F(x) in Eq. 7 is normalized to unity. Therefore, the case w1 . 1 2 Q applies for V 5 1 and V 5 2. If a ,, 1, this case cannot apply for V $ 3. If we do not assume a ,, 1, then w1 . 1 2 Q may apply for larger values of V and hence yield nonsingular distributions for these values of V. As an example, if Vs /m2 5 100, then we numerically find that when a , 0.67, w1 . 1 2 Q will only apply for V 5 1 and V 5 2, but if 1.67 . a . 0.67, w1 . 1 2 Q will apply for V 5 1, V 5 2, and, additionally, V 5 3. Case ii: w1 5 1 2 Q: For this case, we cannot simply solve Eq. 5 to obtain the result of Eq. 7 because [ w1 2 (1 2 Q )w1(x)] vanishes as x 5 0 and the solution to Eq. V d( xi), 5 must include the singular function d(x) [ )i51 where d( x) is a Dirac delta function of argument x. Derivatives of Dirac delta functions cannot be present in the solution because they correspond to distribution functions that are negative for some x. Thus, when w1 5 1 2 Q, Eq. 5 is equivalent to
1
S
Q 12Q
D
E
f1~x 2 y!w1~y!F~y!d Vy 1 2 w1~x!
F1~x1! '
w1 to w1 1 dw1 is, when w1 ' 1, approximately porportional to
(8)
where A ($0) is determined by normalization (Eq. 6). When V 5 1 and V 5 2, the x integral that results from the normalization condition, *f1(x 2 y)/[1 2 w1(x)]dVx, diverges and hence definitely rules out these V values. For V $ 3, the same integral is finite, and when a ,, 1, the delta function term must be present (that is, A Þ 0) in order that F(x) is normalized to unity. Thus, F(x) contains a singular delta function part for V $ 3 when a ,, 1. If, for a given value of V, the mutation rate Q (and hence a) is large enough that the condition of normalization yields A , 0, then we can infer that the case w1 5 1 2 Q does not apply to this value of V. For example, if Vs /m2 5 100, then, when 1.67 . a . 0.67, case ii does not apply to V 5 3, although it does apply for V $ 4. Distributions: We determine approximate forms for the distribution of a single character, say x1, and we denote the single character distribution by F1(x1). We use the house-of-cards approximation (13, 31), which entails replacing *f 1(x 2 y)w1(y)F(y)dVy in
SÎ D a
exp
f1~x!~1 2 w1!~V22!/2dw1
S D 2x21 2m2
(9) x21 2 2 1 pa 2m To obtain the single character distribution, F1( x1), in a pleiotropic model, we integrate F(x) over x2, x3, . . . , xV. When V 5 2, we have
F1~x1! '
2pm2
SÎ D a exp ~c2! 2pm
2
G
S
1 x21 1 c2 , 2 2m2
Î
D
x21 2
(10)
2m 1 c2
where c2 5 exp (2g 2 a21). For V $ 3, we have F1~x1! '
f1~x 2 y!w1~y!F~y!d Vy
w1 2 ~1 2 Q !w1~x!
F~x! 5 Ad~x!
Eqs. 7 and 8 by f1(x)w1 5 f1(x). This approximation can be shown to be highly accurate 2 when a ,, 1. Assuming m / Vs ,, 1, which is apparently reasonable (13), and, furthermore, that V ,, Vs /m2, we can replace the Gaussian w1(x) by 1 2 V x2/(2V ) without any substantial loss of accuracy. Si51 i s When V 5 1, F1( x1) [ F( x1) and we obtain (0)*F(y)dVy
S
F
12
G
2a d~x1! V22
2~V 2 3! x21 1G , 2 2m2
D S Î DS D a
2pm2
x21 2m2
~V23!/2
30. 31. 32. 33. 34. 35. 36.
(11)
In the above, g 5 0.5772 . . . is Euler’s constant a21 e2u du is the incomplete ` and G(a,b) def [ *b u gamma function. Origin and explanation of the results: The fundamental origin of the results we have produced arises from the suppression of beneficial mutations when pleiotropic mutations are present. To see this, consider a single mutation that affects the genotypic value x in one of the sets of V characters. The probability that the mutation will change this genotype to a genotype with associated fitness lying in the range
37. 38. 39. 40.
(12)
When V $ 3, this probability is much smaller than that for V 5 1 or V 5 2. When a 5 QVs /m2 ,, 1, it is the suppression of beneficial mutations to w1 ' 1 that results in singular distributions for V $ 3. Larger values of a may push the delta function singularity to occur at a larger value of V. Inspection of cases i and ii considered above indicates the mathematical reason why delta functions in F(x) are not possible when V 5 1 or V 5 2 yet are possible when V $ 3. The reason is that the integral, with respect to x1, x2, . . . , xV, of 1/( x21 1 x22 1 . . . x2V ) over a region near (and including) the origin, x 5 0, is divergent when V 5 1 or V 5 2 but finite when V $ 3. The extension of the results given in this work to more general fitness functions is straightforward, and the convergence of analogous integrals is the key to the presence of delta functions in F(x). R. Lande, Genet. Res. 26, 221 (1975). J. F. C. Kingman, J. Appl. Probab. 15, 1 (1978). A. S. Kondrashov, Nature 336, 435 (1988). B. Charlesworth, Genet. Res. 63, 213 (1994). P. M. Sharp, J. Mol. Evol. 33, 23 (1991). R. C. Lewontin, The Genetic Basis of Evolutionary Change (Columbia Univ. Press, New York, 1974). W. H. Li, Molecular Evolution (Sinauer, Sunderland, MA, 1997). S. W. Schaeffer and E. L. Miller, Genetics 132, 471 (1992). R. K. Selander et al., Infect. Immun. 58, 1891 (1990). R. Bu¨rger and I. M. Bomze, Adv. Appl. Probab. 28, 227 (1996). We thank N. H. Barton, R. Bu¨rger, B. Charlesworth, A. Eyre-Walker, W. G. Hill, C. H. Langley, J. Maynard Smith, N. H. Smith, and M. Turelli for their kind advice and assistance. 15 October 1997; accepted 6 January 1998
Sensorimotor Adaptation in Speech Production John F. Houde*† and Michael I. Jordan Human subjects are known to adapt their motor behavior to a shift of the visual field brought about by wearing prism glasses over their eyes. The analog of this phenomenon was studied in the speech domain. By use of a device that can feed back transformed speech signals in real time, subjects were exposed to phonetically sensible, online perturbations of their own speech patterns. It was found that speakers learn to adjust their production of a vowel to compensate for feedback alterations that change the vowel’s perceived phonetic identity; moreover, the effect generalizes across phonetic contexts and to different vowels.
When human subjects are asked to reach to a visual target while wearing displacing prisms over their eyes, they are observed to miss the target initially, but to adapt rapidly such that within a few movements their reaching appears once again to be rapid and natural. Moreover, when the displacing Department of Brain and Cognitive Sciences, Massachusetts Institute of Technology, Cambridge, MA 02139, USA. *To whom correspondence should be addressed. E-mail:
[email protected] †Present address: University of California San Francisco, Keck Center, 513 Parnassus Avenue, S-877, San Francisco, CA 94143– 0732, USA.
www.sciencemag.org
prisms are subsequently removed subjects are observed to show an aftereffect; in particular, they miss the target in the direction opposite to the displacement. This basic result has provided an important tool for investigating the nature of the sensorimotor control system and its adaptive response to perturbations (1). The experiment described in this report is based on an analogy between reaching movements in limb control and articulatory movements in speech production. Although reaching and speaking are qualitatively very different motor acts, they nonetheless share the similarity of having sensory goals—
z SCIENCE z VOL. 279 z 20 FEBRUARY 1998
1213
reaching movements are made to touch or grasp a target, and articulatory movements are made to produce a desired acoustic pattern. It is therefore reasonable to ask whether the speech motor control system might also respond adaptively to alterations of sensory feedback (2). However, beyond the intrinsic interest of speech motor control and the importance of discovering commonalities between different effector systems, there are also advantages to studying sensorimotor adaptation in the speech domain. Whereas in arm movement research there is little agreement as to the nature of the underlying discrete units of complex movements (and indeed there is controversy as to whether or not such discrete units exist), in speech there is substantial evidence regarding an underlying discrete control system. In particular, the disciplines of phonology and phonetics have provided linguistic and psychological evidence for the existence of discrete units such as syllables (3), phonemes (4), and features (5). There are still major controversies, however, regarding the role of such discrete units in the online control of speech production (6). An important reason for the lack of agreement is methodological; in particular, there is no agreed-upon methodology for decomposing articulatory and acoustic records into segments that might be identified with underlying control structures. Thus, while linguistic and psychological evidence have provided useful hypotheses as to the putative discrete control structures underlying speech motor control, it has proven difficult to evaluate these hypotheses directly in experiments on speech motor control. Our research provides a new line of attack on this problem. In an adaptation paradigm, we can expose subjects to acoustic perturbations of their articulatory output in
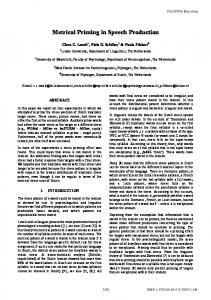
one linguistic context and ask whether any adaptation that is found transfers to another linguistic context. For example, if the formants of the vowel [ε] are altered in the context of “pep,” we can ask whether adaptation generalizes to [ε] in the context of “set” or in the context of “forget.” We can also ask whether adaptation is observed for other vowels. Such manipulations provide a direct probe of the putative hierarchical, segmental control of speech production. We built an apparatus to alter subjects’ feedback in real time (Fig. 1). The apparatus allows us to shift formant frequencies independently so as to impose arbitrary perturbations on the speech signal within the two-dimensional (F1, F2) formant space (7– 9). This apparatus was used in an experiment in which a subject whispered 4220 prompted words over approximately 2 hours. The experiment consisted of the following: a 10-min acclimation phase; a 17min baseline phase; a 20-min ramp phase; a 1-hour training phase; and a 17-min test phase. During the ramp phase, the feedback heard by the subject was increasingly altered, reaching a maximal alteration strength at which it was held for the duration of the training and test phases (10). During the experiment, the subject was prompted to produce words randomly selected from two different sets: a set of training words (in which adaptation was induced) and a set of testing words (in which carryover of the training word adaptation was measured). Test and training words were interspersed with one another throughout the experiment. However, only when the subject produced training words was he exposed to the altered feedback. The training words were all bilabial consonant-vowel-consonants (CVC) with [ε] as the vowel (“pep,”
Fig. 1. The apparatus used in the experiments. CVC words were prompted on the personal computer (PC) video monitor. Subjects were instructed to whisper the word; we used whispered speech to minimize the effects of bone conduction which are strong in voiced speech. While the subject whispered, the speech signal was picked up by a microphone and sent to a digital signal processing (DSP) board in the PC. The DSP board processed successive intervals of the subject’s speech into synthesized, formant-altered feedback with only a 16-ms processing delay [such a delay is nondisruptive; see reference to DAF in (2)]. Each interval was first analyzed into a 64-channel, 4 kHz–wide magnitude spectrum from which formants (which are generally peaks in the spectrum) were estimated (all graphs are schematic plots of magnitude versus frequency). The frequencies of the three lowest frequency formants (F1, F2, and F3) were then shifted to implement a desired feedback alteration (as explained below). The shifted formants were then used to synthesize formant-altered whispered speech. This synthesized speech was fed back to the subject via earphones at sufficient volume that he essentially heard only the synthesized feedback of his whispering. 1214
SCIENCE
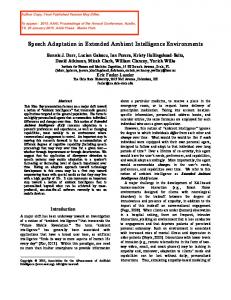
“peb,” “bep,” and “beb”) and the subject produced them while hearing either feedback of his whispering or masking noise that blocked his auditory feedback (11). The set of testing words was divided into two subsets, each designed to assess different types of carryover of the training word adaptation. Three of the testing words—“peg,” “gep,” and “teg”—were included to determine if the adaptation of [ε] in the bilabial training word context carried over to [ε] in different word contexts. The remaining testing words— “pip,” “peep,” “pap,” and “pop”—were included to determine if the adaptation of [ε] caused similar production changes in other vowels. Eight male Massachusetts Institute of Technology (MIT) students participated in the study. All were native speakers of North American English and all were naı¨ve to the purpose of the study (12). Each was run in the adaptation experiment and also in a control experiment that was identical to the adaptation experiment except that no feedback perturbations were introduced. Figure 2 shows the feedback transformations and resulting compensation and adaptation for a single subject. The diamonds show mean formant positions of the subject’s productions of the vowels [i], [i], [ε], [æ], and [ɑ], as measured in a pretest procedure several days before the actual adaptation experiment. Formants were shifted along the path linking the positions of these vowels (dotted line) (13). Formants were shifted in one direction along this path for half the subjects; they were shifted in the opposite direction for the other subjects. The formant shifts were large enough that if the subject produced [ε], he heard either [i] or [ɑ], depending on the direction of shift. For the subject in Fig. 2, formants were shifted toward [i]. Formants were shifted in proportion to the spacing between vowels on
Fig. 2. Altered feedback and resulting compensation and adaptation for a single subject (subject OB).
z VOL. 279 z 20 FEBRUARY 1998 z www.sciencemag.org
REPORTS the path: If the subject produced [ε] his formants were shifted so he heard [i]; if he produced [æ] he heard [i]; and if he produced [ɑ] he heard [ε]. Position B (Fig. 2) corresponds to the mean vowel formants for the training words produced by the subject in the baseline phase of the adaptation experiment. B9 shows the formants presented to the subject as a result of the altered feedback. The arrow labeled “compensation” is the subject’s compensation to the altered feedback: The arrow shows that, in response to hearing B as B9, the subject has, by the test phase of the experiment, changed his production of B to T. The arrow labeled “altered feedback” shows that the altered feedback causes the subject to hear the production change as a shift from B9 to T9. The arrow shows that, by the experiment’s test phase, the subject now hears his formants at T9, which are close to the baseline, B. The subject has thus compensated for the altered feedback. The arrow labeled “adaptation” shows how much of the compensation is retained when the feedback is blocked by noise (in this case, about 72% is retained). The analysis of mean compensation and mean adaptation across subjects is shown in Fig. 3 (14). The figure shows that the majority of subjects significantly compensated (P , 0.006) and adapted (P , 0.023) (15). The figure also shows other features commonly seen in adaptation experiments in the reaching domain: compensation varies across subjects, each subject compensates more than he adapts, and subjects that tend to compensate more also tend to adapt more. Figure 4 shows mean generalization for
the test words—a ratio expressing the fraction of the adaptation of [ε] in the training words that carried over to the vowel production in a testing word (16). Adaptation to the training set affected the production of the vowels in test words containing the same vowel but in different consonant contexts (Fig. 4A). Overall, there is significant generalization of the training word adaptation to these test words (P , 0.040) (17). However, the apparently greater mean generalization to “peg” than to “gep” and “teg” is not statistically significant. This lack of significance is traceable to coarticulatory influences that caused imperfect estimates of steady-state vowel formants of [ε] in “gep” and “teg”. Adaptation to the training set affected the production of the vowels in words containing different vowels (Fig. 4B) (18). Again, there is overall significant generalization of the training word adaptation to these test words (P , 0.013), but again, the apparent differences in mean generalization between the words is not statistically significant. In summary, our experimental results show that control of the production of vowels adapts to perturbations of auditory feedback. This adaptation is analogous to the adaptation seen in the control of reaching. Moreover, the generalization observed for [ε] in the testing words provides direct evidence that the testing and the training words share a common representation of the production of [ε]; it is of course natural to hypothesize that this common representation is the phoneme [ε]. Finally, the significant generalization to “pip” and “pap” considered together
Fig. 3. Mean compensation (top) and adaptation (bottom) for all subjects (designated CW through AH) in the adaptation (black bars) and control (white bars) experiments.
Fig. 4. Mean generalization for the analyzable testing words in the experiment. Shown are (A) words with the same vowel ([«]) used in the training words, but different consonants; and (B) words with different vowels.
www.sciencemag.org
shows that the adaptation of a vowel can spread not only across contexts but also to other vowels. This suggests that the control process underlying the production of the trained vowel is partially shared in the control of the productions of other vowels; moreover, it is natural to attempt to identify these control structures with the featural decompositions studied in phonology. REFERENCES AND NOTES ___________________________ 1. H. V. Helmholtz, Treatise on Physiological Optics, vol. 3 (1867) (Optical Society of America, Rochester, NY, 1925); G. M. Stratton, Psychol. Rev. 3, 611 (1896); I. Kohler, Acta Psychol. 11, 176 (1955); R. Held, J. Nerv. Ment. Dis. 132, 26 (1961); for a review, see R. B. Welch, Perceptual Modification: Adapting to Altered Sensory Environments (Academic Press, New York, 1978). 2. The studies reported in W. E. Cooper [Speech Perception and Production (Ablex Publishing, Norwood, NJ, 1979)] showed the interdependence of speech perception and production: repetitive hearing of voiceless consonants decreases the perceived voice-onset time ( VOT ) of test stimuli and also decreases the VOT of produced consonants. Masking noise feedback increases speech volume [E. Lombard, Ann. Maladies Oreille Larynx Nez Pharynx 37, 101 (1911), as cited in H. Lane and B. Tranel, J. Speech Hear. Res. 14, 677 (1971)]. Investigations of delayed auditory feedback (DAF) show that delays of 30 ms can disrupt speech [B. S. Lee, J. Acoust. Soc. Am. 22, 639 (1950); see A. J. Yates, Psychol. Bull. 60, 213 (1963) for a review]. Frequency translations of the spectrum of the auditory feedback have also been shown to affect speech [ V. L. Gracco et al., J. Acoust. Soc. Am. 95, 2821 (1994)]. Recent investigations of pitch perturbations have shown adaptive responses by speakers to alterations in their pitch frequency [H. Kawahara, ibid. 94, 1883 (1993)]. 3. C. W. Eriksen, M. D. Pollack, W. E. Montague, J. Exp. Psychol. 84, 502 (1970); S. T. Klapp, W. G. Anderson, R. W. Berrian, ibid. 100, 368 (1973); S. Sternberg, S. Monsell, R. L. Knoll, C. E. Wright, in Information Processing in Motor Control and Learning, G. E. Stelmach, Ed. (Academic Press, New York, 1978), pp. 117–152. 4. R. Wells, Yale Sci. 26, 9 (1951); S. Shattuck-Hufnagel, in Sentence Processing: Psycholinguistic Studies Presented to Merrill Garrett, W. E. Cooper and E. C. T. Walker, Eds. (Erlbaum, Hillsdale, NJ, 1979), pp. 295 –342; F. Ferreira, J. Mem. Lang. 30, 210 (1991); A. S. Meyer ibid., p. 69; G. S. Dell and P. G. O’Seaghdha, Cognition 42, 287 (1992). 5. N. Chomsky and M. Halle, The Sound Pattern of English (MIT Press, Cambridge, MA, 1968); G. N. Clements, Phonol. Yearb. 2, 225 (1985). 6. For reviews of these issues, see W. J. M. Levelt [Speaking: From Intention to Articulation (MIT Press, Cambridge, MA, 1989)], A. S. Meyer [Cognition 42, 181 (1992)], and R. A. Mowrey and I. R. A. McKay [J. Acoust. Soc. Am. 88, 1299 (1990)]. 7. As Fig. 1 shows, we actually perturbed speech sounds in the three dimensions F1, F2, and F3. However, because F3 shows small variation across the vowel sounds we studied, our perturbations acted principally on only F1 and F2. 8. Given that subjects show substantial variation in the location of their vowels within this space, we collected baseline data for each subject that allowed us to tailor the transformations to individual subjects. 9. Details on the implementation of the feedback transformations and methods of data analysis are provided below and in J. F. Houde, thesis, Massachusetts Institute of Technology, Cambridge, MA (1997). 10. The gradual introduction of the feedback perturbation was intended to reduce a subject’s awareness of it. Indeed, postexperiment interviews revealed that all subjects claimed to be unaware that their feed-
z SCIENCE z VOL. 279 z 20 FEBRUARY 1998
1215
back was altered during the experiment. 11. A sound-pressure level of 60 dB was sufficient to block subjects’ ability to hear their own whispering. 12. Informed consent was obtained from all subjects after the nature and possible consequences of the study were explained. 13. Feedback transformations were defined geometrically with respect to a subject’s [i]-[ɑ] path. The subject’s unaltered formant frequencies were represented as a point in formant space. This point was then rerepresented in terms of two measures: (i) path deviation—the distance to the nearest point on the [i]-[ɑ] path, and (ii) path projection—the position on the [i]-[ɑ] path of this nearest point. The feedback transformation then shifted only the point’s path projection; the point’s path deviation was preserved. 14. Mean compensation measures how much a subject’s mean training word vowel formant change (test phase – baseline) countered the shift of the feedback transfor-
mation. It was measured as: (path projection of mean vowel formant change)/(–path projection shift of transform) [see (13) for explanation of path projection]. This ratio is 1.0 for perfect compensation. Mean adaptation measured how much compensation was retained in the absence of feedback. Thus, mean adaptation was calculated with the same ratio shown above, except it used only formant data collected when the subject whispered with feedback blocked by noise. (In the control experiment, because feedback was not altered, mean compensation and adaptation for each subject were calculated with respect to the feedback alteration used in the adaptation experiment.) 15. Analysis-of-variance tests of path projection changes (test phase – baseline) across subjects in the adaptation and control experiments were computed from formant data collected when subjects whispered while hearing feedback (for the compensation analysis) or while hearing was blocked by masking
Mass Spectrometric Analysis of the Anaphase-Promoting Complex from Yeast: Identification of a Subunit Related to Cullins Wolfgang Zachariae, Andrej Shevchenko, Paul D. Andrews, Rafael Ciosk, Marta Galova, Michael J. R. Stark, Matthias Mann,* Kim Nasmyth* Entry into anaphase and exit from mitosis depend on a ubiquitin–protein ligase complex called the anaphase-promoting complex (APC) or cyclosome. At least 12 different subunits were detected in the purified particle from budding yeast, including the previously identified proteins Apc1p, Cdc16p, Cdc23p, Cdc26p, and Cdc27p. Five additional subunits purified in low nanogram amounts were identified by tandem mass spectrometric sequencing. Apc2p, Apc5p, and the RING-finger protein Apc11p are conserved from yeast to humans. Apc2p is similar to the cullin Cdc53p, which is a subunit of the ubiquitin–protein ligase complex SCFCdc4 required for the initiation of DNA replication.
16.
17.
18.
19.
noise (for the adaptation analysis). The interaction of experiment type (adaptation versus control) and path projection changes was used to judge significance. For a given test word, mean generalization was computed as: (mean test word relative adaptation)/(mean training word relative adaptation), where relative adaptation was computed by subtracting adaptation seen in the control experiment from that seen in the adaptation experiment. Tests of significant generalization were based on computing the significance of test word adaptations, which were computed the same way as the training word adaptation significance tests described in (15). We had technical problems estimating the formants of whispered [i] and [ɑ]; thus, productions of “peep” and “pop” were excluded from our results. We thank J. Perkell, K. Stevens, R. Held, and P. Sabes for helpful discussions. 15 September 1997; accepted 29 December 1997
To analyze the composition of the APC, we labeled cells expressing Cdc16p with Myc epitopes (Cdc16-Myc6p) with 35 S, and the complex was immunoprecipitated with an antibody to Myc (11). Proteins of ;90 (Apc2p) and 70 kD were detected in addition to Apc1p, Cdc16Myc6p, Cdc27p, and Cdc23p (Fig. 1A). Mass spectrometric analysis revealed that the 70-kD band consists of two proteins, p70 (Apc5p) and p68 (Apc4p). Proteins migrating at ;40 (Apc9p), 32 (Apc10p), 23 (Apc11p), 20 [Cdc26p (8)], and 19 kD (Apc13p) were also detected (Fig. 1B). All of these proteins were detected in precipitates from strains expressing different epitope-tagged APC subunits but not from control strains, indicating that the yeast complex contains at least 12 different subunits. To identify these proteins, we purified the APC from CDC16-myc6 or CDC23myc9 strains (12). One-step immunoprecipitations from unfractionated cell extracts yielded enough material to detect individual subunits on silver-stained gels (Fig. 1A).
The
APC mediates cell cycle–regulated ubiquitination, and thereby degradation, of proteins containing sequences called destruction boxes (1–4). Entry into anaphase depends on the degradation of proteins such as Pds1p and Cut2p, which inhibit sister chromatid separation (5, 6). Degradation of mitotic cyclins inactivates cyclin-dependent kinases (CDKs), which is important for exit from mitosis and is a prerequisite for DNAreplication in the subsequent cell cycle (7). Five subunits of the yeast APC (Apc1p, Cdc16p, Cdc23p, Cdc26p, and Cdc27p) have been identified through genetic analysis (3, 8). However, additional subunits were detected in APC particles purified from yeast and Xenopus oocytes (8, 9). Advances in the analysis of proteins by mass spectrometry and sequencing of the entire
yeast genome provide a strategy to identify the components of multiprotein complexes that can be biochemically purified (10). We used this approach to identify five additional subunits of the APC.
W. Zachariae, R. Ciosk, M. Galova, K. Nasmyth, Research Institute of Molecular Pathology, Dr. Bohr-Gasse 7, A-1030 Vienna, Austria. A. Shevchenko and M. Mann, European Molecular Biology Laboratory, Meyerhofstrasse 1, D-69012 Heidelberg, Germany. P. D. Andrews and M. J. R. Stark, Department of Biochemistry, University of Dundee, Dundee DD1 4HN, UK.
Fig. 1. Subunit composition of the APC. (A) Detection and purification of APC subunits. Proteins immunoprecipitated with an antibody to Myc from extracts from CDC16 (wild type or PDS1-myc18) and CDC16-myc6 cells were separated in SDS-polyacrylamide gels. Proteins from 35S-labeled cells (5 3 107 ) were detected by fluorography (11) (left). For mass spectrometry, immunoprecipitates from 1010 cells were detected by silver staining (12, 13) (right). () A protein coimmunoprecipitating with Pds1Myc18p. Pds1p is stained only weakly. (p) Proteins whose precipitation is not Myc-dependent. (B) Small APC subunits. Immunoprecipitates from 35S-labeled cells expressing Myc-tagged APC subunits were separated in a 4 to 20% gradient gel. Molecular sizes are indicated on the left (in kilodaltons).
* To whom correspondence should be addressed.
1216
SCIENCE
z VOL. 279 z 20 FEBRUARY 1998 z www.sciencemag.org