Jun 23, 2013... (Olympus, Hamburg, Germany) with a 200 µm fiber optic light guide .... (
Femto2D, Femtonics Ltd., Budapest) equipped with a femtosecond ...
Aus dem Neurowissenschaftlichen Forschungszentrum der Medizinischen Fakultät Charité – Universitätsmedizin Berlin
D I S S E R T A T I O N
S
E N SO RY
A N D
A S SO C I ATI V E
M I C R O C I R C U I T S O L FA C TO RY
I N
TH E
CO RTE X
zur Erlangung des akademischen Grades Medical Doctor – Doctor of Philosophy (MD/PhD) im Rahmen des International Graduate Program Medical Neurosciences vorgelegt der Medizinischen Fakultät Charité – Universitätsmedizin Berlin von Hauke Felix Wiegand aus Achim, Niedersachsen, Deutschland
T A B L E
C O N T E N T S
O F
Gutachter/in:
1. Prof. Dr. D. Schmitz
2. Prof. Dr. M. P. Nawrot
3. Prof. Dr. M. Larkum
Datum der Promotion: 23.06.2013
2
T A B L E
O F
C O N T E N T S
Acknowledgements I would like to thank: Dietmar Schmitz and Friedrich Johenning for being so present as supervisors, always open to questions and suggestions, and paying attention not only to the project but the preferences and individuality of the lab members, Prateep Beed, Christian Leibold and Michael Bendels for the constructive cooperation and many explanations in data analysis, Claudia Böhm and Moritz Wigand for critical reading of this thesis, Anke Schönherr und Susanne Walden for very helpful technical assistance, and the Schmitzlab crew for the always friendly and cooperative atmosphere in the lab.
3
T A B L E
1
T
O F
C O N T E N T S
A B L E
O F
C
O N T E N T S
1 Table of Contents ........................................................................................................................ 4 2 List of Figures and Tables........................................................................................................ 6 3 Abbreviations ............................................................................................................................... 7 4 Introduction .................................................................................................................................. 9 4.1 The mammalian olfactory system .............................................................................10 4.2 The Piriform Cortex .........................................................................................................13 4.2.1 Horizontal organization..........................................................................................13 4.2.2 Anterior-‐posterior and dorsal-‐ventral organization .................................14 4.2.3 Olfactory coding.........................................................................................................15 4.2.4 Plasticity ........................................................................................................................17 4.2.5 Oscillations...................................................................................................................18 4.2.6 Inputs and Outputs ...................................................................................................19 4.3 Diseases affecting the olfactory system ..................................................................20 4.4 Cell Type Specific Subcircuits – Hypothesis..........................................................21 5 Methods.........................................................................................................................................23 5.1 Experimental Procedures..............................................................................................23 5.1.1 Slice Preparation........................................................................................................23 5.1.2 Electrophysiology......................................................................................................23 5.1.3 Glutamate uncaging and scanning of glutamate-‐evoked activity.........24 5.1.4 Histological procedures..........................................................................................26 5.1.5 Two-‐Photon Calcium Imaging (TPCI)...............................................................27 5.2 Data analysis and statistics...........................................................................................28 5.2.1 Analysis of LSPS data ...............................................................................................29 5.2.2 Analysis of Population Calcium Imaging Data ..............................................30 5.2.3 Statistics ........................................................................................................................31 6 Results ...........................................................................................................................................32 6.1 Cell Types and Calibration ............................................................................................32 6.1.1 Principle Cell Types in the Piriform Cortex ...................................................32
4
T A B L E
O F
C O N T E N T S
6.1.2 Calibration of Spatial Resolution ........................................................................35 6.2 Probing associative inputs by LSPS ..........................................................................37 6.2.1 Generation of principal cell-‐type specific afferent input maps from different APC layers..................................................................................................37 6.2.2 L2S, L2Ps and L3Ps: comparison of intracortical connectivity .............40 6.2.3 Layer III pyramidal cells: dorsal-‐ventral asymmetry of recurrent feedback excitation...................................................................................................43 6.3 Analysis of sensory input by fast TPCI reveals stronger recruitment of superficial layer II cells...................................................................................................45 7 Discussion ....................................................................................................................................49 7.1 Limitations...........................................................................................................................49 7.2 The organization of intracortical and sensory circuits in aPC layer II can be described as a converse gradient.........................................................................50 7.3 Specialized superficial microcircuits........................................................................51 7.4 Output firing, cortical odour coding, plasticity ....................................................52 7.5 Intracortical connections along the dorso-‐ventral axis: Asymmetry and the role of deep cells........................................................................................................53 7.6 An updated (and speculative) PC network model..............................................54 8 Summary/Abstract...................................................................................................................59 9 Literature......................................................................................................................................60 10 Selbständigkeitserklärung .................................................................................................70 11 Curriculum Vitae.....................................................................................................................71 12 Publikationen und Poster ...................................................................................................74
5
L I S T
F I G U R E S
O F
A N D
T A B L E S
2
L
I S T
O F
F
I G U R E S
A N D
T
A B L E S
Figure 1 – Location and structure of the PC ..............................................................................12 Figure 2 – slicing plane .......................................................................................................................23 Figure 3 – laser scanning photostimulation setup..................................................................25 Figure 4 – Inhibitory effect of MNI-‐Glutamate .........................................................................26 Figure 5 – two-‐photon population imaging setup...................................................................28 Figure 6 – Biocytin reconstructions and Input-‐Output-‐Curves demonstrating the vertical transition ........................................................................................................................32 Figure 7 – aPC principal cells are organized in a continuous gradient..........................35 Figure 8 – Resolution of photoactivation by glutamate uncaging....................................36 Figure 9 – Mapping local recurrent feedback excitation......................................................39 Figure 10 – L2S and L2P example maps......................................................................................41 Figure 11 – Intracortical connectivity increases from superficial to deep ..................42 Figure 12 – L3Ps receive asymmetric inputs on the ventrodorsal axis.........................44 Figure 13 – Single cell excitability probing of sensory layer Ia inputs to deep and superficial layer II neurons by fast TPCI ...........................................................................46 Figure 14 – Schematic aPC circuit diagram................................................................................56
6
A B B R E V I A T I O N S
3
A
B B R E V I A T I O N S
α-‐amino-‐3-‐hydroxy-‐5-‐methyl-‐4-‐isoxazolepropionic acid
AMPAR
–
AP
–
action potential
aPC
–
anterior piriform cortex
EPSC
–
excitatory postsynaptic current
EPSP
–
excitatory postsynaptic potential
DL2
–
deep layer II cell
GABA
–
gamma amino buteric acid
IPSC
–
inhibitory postsynaptic current
IPSP
–
inhibitory postsynaptic potential
L2P
–
layer II superficial pyramidal cell
L2S
–
layer II semilunar cell
L3M
–
layer III multipolar cell
L3P
–
layer II deep pyramidal cell
LOT
–
lateral olfactory tract
LSPS
–
laser scanning photo stimulation
LTD
–
long term depression
LTP
–
long term potentiation
M and T cells
–
mitral and tufted cells
NMDAR
–
N-‐methyl D-‐aspartate receptor
OB
–
olfactory bulb
PC
–
piriform cortex
pPC
–
posterior piriform cortex
PSC
–
postsynaptic current
SD
–
standard deviation
SEM
–
standard error of the mean
SL2
–
superficial layer II cell
SWR
–
sharp wave ripples
TPCI
–
two-‐photon-‐Calcium-‐Imaging
receptor
7
A B B R E V I A T I O N S
„Grenouille aber roch alles wie zum ersten Mal. Und er roch nicht nur die Gesamtheit dieses Duftgemenges, sondern er spaltete es analytisch auf in seine kleinsten und entferntesten Teile und Teilchen. Seine feine Nase entwirrte das Knäuel aus Dunst und Gestank zu einzelnen Fäden von Grundgerüchen, die nicht mehr weiter zerlegbar waren. “ Patrick Süßkind, Das Parfüm
8
I N T R O D U C T I O N
4
I
N T R O D U C T I O N
The olfactory system of mammals is specialized to detect odours, to form and recognize olfactory objects and to link them to other modalities and behaviour. This is a complex and important task: Real-‐world aromas are complex mixtures of odorant molecules that contain information about pleasures, dangers, attractive and aversive properties of the surrounding world – like quality, condition and location of food – and about other creatures – like dangerous predators, rivalling fellows and potential partners. Probably, more than 400 000 different substances are perceptible as odours for humans and many more for some other animal species (Nagao et al., 2002). Relevant odours have to be discriminated from a “noisy” background. This is challenging, as they are varying in their quantitative presentation through variables like wind direction, humidity and air temperature and in their qualitative chemical signature, as the chemical composition emitted by an odour source may vary through time by ecological factors like dilapidation. In addition to the constant processing of odours from the surrounding environment, many species actively sniff at their environment, thereby allowing for a defined timing and localization of the perceived odours (Gottfried, 2010). How can we understand at least in part how the olfactory system tackles this challenge? The olfactory system is a sensory system and part of the mammalian central nervous system. Of course, it is impossible to describe state and development of every single element of the system, as this would overtax both our own cognitive capacities as well as the computation capacity of today’s computer systems (Douglas and Martin, 2007). Instead, in order to ‘understand’ such a (neuro-‐) biological system, one can try to define forms of appearance, principles of organization and laws and rules of dynamic change that relate to known concepts. In neurobiology such definitions are made on different levels of description: Macroanatomy and topographical anatomy describe forms, structures and their relations delimitable with the naked eye. Histology characterizes the cell types that compose a tissue and their structural composition. Microanatomy relates these descriptions to the macroanatomically visible forms and structures. Physiology
9
I N T R O D U C T I O N
describes dynamic properties of biological systems and tries to define laws and rules in the language of physics and biochemistry. Functional anatomy links anatomical organization to physiological function. Behavioural sciences systematically analyze activities in defined situations and interactions among organisms. In order to find principles of form, organization and function that are not immediately falsifiable (Popper, 2002) one has to generalize and thereby reduce complexity. In this work I will describe our research on the principles of connectivity and processing of information by classes of cell types in the piriform cortex (PC), the largest part of the olfactory system. As a model system we were working in slices of rat brains. In our work we thus tried to find principles of organization and function on the level of functional microanatomy. In order to understand the motivation for this choice and the relevance of our findings, I will first give a short introduction to the anatomical structure and coarse function of the olfactory system and then describe functional microanatomical characteristics of the PC more in detail. If not otherwise indicated, I cite studies done in rodents. 4.1
The mammal i an ol factor y syste m
In humans and rodents, odours are detected by olfactory sensory neurons in the olfactory epithelium in the nose. Odour molecules bind to odorant receptors on the surface of these cells. Individual sensory neurons are equipped only with one type of odorant receptor. However, they can respond to a range of odour molecules with different affinities. Vice versa, a distinct odour molecule mostly activates many different receptors with varying efficacies (Murthy, 2011). Olfactory sensory neurons project exclusively to the olfactory bulb (OB), the first processing stage in the olfactory system. Their axons converge onto structures called “glomeruli”, a kind of first signal processing module in the OB (Mori et al, 1999). A single glomerulus receives input only from sensory neurons expressing the same receptor type (Murthy, 2011). In a glomerus the axons of olfactory sensory neurons contact different targets: They make connections with excitatory glutamatergic mitral and tufted cells (M and T cells) that are the major output
10
I N T R O D U C T I O N
neurons of the OB, and with diverse classes of GABAergic, glutamatergic and dopaminergic juxtaglomerular neurons. The largest neuron population in the OB are granule cells that receive inputs from M and T cells and backprojections from cortical neurons. A part of the granule cell and juxtaglomerula cell population is subject to a continuous turnover, whereby newborn and more plastic cells get integrated into the existing circuitry (Isaacson, 2010, Lazarini and Lledo, 2011). The OB M and T output neurons are connected to higher cortical areas. Olfactory cortices are areas in the basal frontal and medial temporal lobes of the brain that receive direct input from the OB. In contrast to the processing of information from other senses, such as vision, audition or somatosensation, the thalamus does not serve as a relay between the cortex and the periphery. Some authors speculate that the OB is fulfilling the function that the thalamus serves in other sensory systems (Gottfried, 2010). Additionally, no clear hierarchical and functional order of cortical regions (like V1, V2, V3, V4 in the visual cortex) can be found. On the basis of macro-‐ and mircoanatomical properties olfactory cortical areas can be distinguished, but their relation is unclear (Fig. 1A). The largest area is the piriform cortex (PC), which receives strong input from the OB via the lateral olfactory tract (LOT). Based on axonal connections and cytoarchitectural properties different subregions of the PC can be described: The anterior piriform cortex (aPC) has a ventral subdivision covered by the superficial LOT fiber bundle and a dorsal subdivision dorsal to the LOT, whereas the posterior piriform cortex (pPC) is situated posterior to the LOT (Fig. 1A) (Nevile and Haberly, 2004). Which broad behavioural functions can the olfactory areas be linked to? It has been suggested that the glomerular structure of the OB that bundles information from different olfactory sensory neurons and distributes it to the cortex serves as a kind of "information look up table” (Isaacson, 2010). Periglomerular cells and granule cells modify M and T cell output, thereby sharpening contrasts and controlling output gain (Lazarini and Lledo, 2011; Isaacson, 2010). The anterior olfactory nucleus (Fig. 1A) is involved in interhemispheric information exchange and coordination (Brunjes et al., 2005; Illig and Eudy, 2009), whereas the functions of the tenia tecta and the peduncular cortex in olfaction remain unknown. The function of the PC is still under debate: On the one hand, it is the primary olfactory
11
I N T R O D U C T I O N
A
B Rhinal sulcus
AON
OB APCD APC V OT
Entorhinal Cere- Ctx bellum Amyg Ctx PPC
Brainstem
C
GABAergic cells surface
100 µm
cortex
Figure 1 – Location and structure of the PC A and B Sketches of an isolated rodent (A) and human (B) brain. The first processing station of olfactory information is the olfactory bulb (OB). Via the LOT (violet) axons from OB cells reach the piriform cortex (PC, blue; parts covered by the LOT in dark violet) that constitutes the largest part of the olfactory cortex. Anatomically, several subdivisions can distinguished: The anterior piriform cortex (aPC) has a ventral subdivision deep to the LOT and a dorsal subdivision dorsal to the LOT, whereas the posterior piriform cortex (pPC) is situated posterior to the LOT and has a prominent layer III. Higher areas engaged in olfactory processing are the orbitofrontal cortex, amygdala, perirhinal cortex and entorhinal cortex. C Layering of the PC: As a phylogenetically old paleocortex, PC shows a three-‐layerd structure. Layer Ia contains fibers transmitting exclusively sensory information from the OB. Layer Ib consists of both local and long-‐range associative fibers. Layer I and II horizontal and neurogliaform cells are implied in early feedforward inhibition, layer II and III neurogliaform and inhibitory multipolar cells in late perisomatic inhibition. Current descriptions described so far semilunar and superficial pyramidal cells as two different excitatory cell populations in layer II. Layer III contains deep pyramidal cells and spiny multipolar cells as excitatory neurons. Deep to layer III lays the endopiriform nucleus with predominantly multipolar cells. A modified from Ekstrand et al., 2001; B modified from http://dasgehirn.info /entdecken/anatomie/der-‐paleocortex/; (C) modified from Neville and Haberly, 2004.
12
I N T R O D U C T I O N
cortex and was thus seen analogous to other primary sensory areas as a feedforward sensory processing module, on the other hand it shows typical characteristics of associative cortices (see 4.4). Functional magnetic resonance imaging studies in humans imply that odour background differentiation is processed by the OB and the aPC. Representations of the chemical identity of the components of an odour (like 'ethyl acetate, α-‐farnesene and butanol') are found in the aPC, whereas the pPC is coding its perceptual quality (like 'pear' for the before mentioned substances). Perceptual and associative learning, attention selection and conscious odour perception rely on pPC and orbitofrontal cortex networks (Gottfried, 2011). 4.2
The Pi r i for m Cor te x
4 .2 .1 H o riz o n ta l o rg a n iz a tio n
The PC has a three-‐layer laminar organisation (Fig. 1C and 12D) in its vertical plane – another important difference of this palaeocortical system from sensory systems that emerged later in evolution and that have a six-‐layered neocortical vertical structure: The superficial plexiform layer I contains dendrites, fibre systems, and only a small number of neurons. These are mainly interneurons called horizontal cells. Its superficial part, layer Ia, receives exclusively sensory olfactory bulb input via the LOT, its deep part, layer Ib, consists of corticocortical association fibers from other olfactory cortical areas and the PC itself (Neville and Haberly, 2004; Suzuki and Bekkers, 2010). Layer II is a compact layer containing cell bodies and associational fibers. Current descriptions propose two separate populations of excitatory cells: in the superficial part semilunar cells, that lack basal dendrites and have apical dendrites with two major branches (Fig.1C) and large spines primarily located in layer Ia and in its deep part pyramidal cells. Apical dendrites of these layer II superficial pyramidal cells extend to layer Ia, and for the majority of cells, basal dendrites extend into layer III. Semilunar cells get nonfacilitating sensory excitatory inputs and fire nonbursting action potentials (APs) that are followed by a strong
13
I N T R O D U C T I O N
afterhyperpolarization. Depending on the strength of input, they tend to fire output APs at frequencys < 40 Hz. Superficial pyramidal cells receive heavily facilitating sensory inputs and produce bursts of APs. They tend to fire at frequencies > 40 Hz (Suzuki and Bekkers, 2006). It is important to note that Suzuki and Bekkers compared cells at extreme spatial locations: a semilunar population at the border to layer I and a pyramidal cell population close to the border to layer III, but probably they did not sample any neurons in the intermediate part. Layer III in its superficial part contains mainly pyramidal cells. These deep pyramidal cells have dendrites extending to layer Ia, too. In their electrophysiological properties they differ from superficial pyramidal cells, for example by having a lower spike threshold (Neville and Hyberly, 2004). In the deep part of layer III, large GABAergic inhibitory multipolar cells and a smaller number of spiny excitatory multipolar cells are the principal neurons. Deep in the cortex, under dorsal parts of layer III the endopiriform nucleus can be found that is termed by some authors layer IV. Here the predominant excitatory cell type are spiny excitatory multipolar neurons (Neville and Haberly, 2004). Several classes of structurally different inhibitory cell types exist in the piriform cortex: horizontal and neurogliaform cells in layer I and II, bitufted cells in layer II and neurogliaform and fast-‐spiking-‐ and regular-‐spiking inhibitory multipolar cells in layer III (Neville and Haberly 2004, Suzuki and Bekkers, 2010; Fig. 1C). 4 .2 .2 A n te rio r-‐p o ste rio r a n d d o rsa l-‐v e n tra l o rg a n iza tio n
Whereas the PC shows a clear vertical laminar organisation, the horizontal structure is much more diffuse: First, the thickness of layer Ib (thus the strength of the associative input fibre bundle) in comparison to Ia (the sensory input fibre bundle) increases from anterior to posterior, thus from APC to PPC, and from ventral to dorsal in the APC (Neville and Haberly, 2004). Second, the area of termination of intrinsic association fibres in the horizontal laminar organisation depends on their area of origin, and, furthermore, appears to follow the sequence of activation of the different subregions. For example, association projections from ventral APC are only in the
14
I N T R O D U C T I O N
superficial part of layer Ib throughout all the other PC, whereas association connections from dorsal APC synapse rather in middle parts of Ib, and fibers from PPC mostly terminate in layer III (Neville and Haberly, 2004). Third, aPC inhibitory inputs to pyramidal cells are asymmetrically organized with a posterior shift on the anterior-‐posterior axis (Luna and Pettit, 2010). Fourth, associational projections (as well as commissural projections) between the different PC subregions show a clear asymmetry. For example, projections from ventral APC to dorsal APC and from APC to PPC are mainly one-‐way connections (Neville and Haberly 2004). Afferent input to the PPC is much more broadly distributed than in APC. In functional experiments higher concentrated odorants activate larger regions of the cortex, and anterior sites show lower activation thresholds than posterior sites. In response to defined odorants, individual PPC cells seem to be more selective than cells in the APC (Sugai et al., 2005; Wilson et al., 2006). 4 .2 .3 O lfa c to ry c o d in g
How do these structures and the different cell types contribute to the coding of olfactory information? M and T cell axons from the olfactory bulb glomeruli synapse exclusively in layer Ia on dendrites of layer II excitatory cells and interneurons. Whereas the OB shows a clear “recepterotopic” spatial arrangement of inputs, PC activation by sensory inputs seems to follow different organisation principles: Different odorants seem to activate 3–15% of the superficial excitatory cell population in the aPC. Each odorant activates distinct but overlapping cell ensembles that show no spatial clustering (Illig and Haberly, 2003; Rennacker et al., 2007; Stettler and Axel, 2009; Poo and Isaacson, 2009; Apicella et al., 2010). An interesting additional finding is that olfactory cortical ensembles activated in response to complex mixtures of odorants are invariant to small variations in their composition (as is the related behavioural performance). Therefore they may function as a kind of pattern completion mechanism that allows perceptual stability (Barnes et al., 2008). OB and PCX principle cells have no “exclusive” connections: genetic tracing studies
15
I N T R O D U C T I O N
showed that individual cortical excitatory cells receive input from on average at least four M/T cells. At the same time, M and T cells getting input from the same glomerulus project independently to different PC neurons (Miyamchi et al, 2011). In an in vivo imaging study individual cells responded to several, even structurally different odorants and a subpopulation of cells responded only to mixtures of odorants but not to their components (Stettler and Axel, 2009). The response to increasing odorant concentrations does not increase linearly with the concentration but saturates (Stettler and Axel, 2009). “Global inhibition” is tuning the dispersed activity in the highly associative network to the locally sparse and temporally precise ensemble coding. “Global inhibition” thereby means a widespread and nonselective suppression of excitation by inhibtion (Poo and Isaacson, 2009). Different inhibitory circuits can be distinguished that fall into two broad classes: Dendritic feedforward and somatic feedback inhibition. Feedforward apical dendritic inhibition is mediated by layer I horizontal and neurogliaform cells. Horizontal cells are found only close to the LOT, whereas neurogliaform cells are widely distributed throughout layer I (Suzuki and Bekkers, 2010 and 2012). These feedforward interneurons receive input from a broader set of glomeruli than excitatory neurons and the synapses between M and T cells and feedforward interneurons have a higher release probability then contacts between M and T cells and excitatory cells. It is speculated that feedforward inhibition in PC acts as a kind of “salience filter” that can be overcome only by strong burst inputs (Stokes and Isaacson, 2010; Suzuki and Bekkers, 2012). It is most effective when M and T cells fire sparsely. However, when bursts of sensory input by M and T cells arrive, it wanes strongly, a mechanism that allows activation of excitatory cells (Stokes and Isaacson, 2010). Instead, by this stronger excitation, somatic feedback inhibition is recruited, but follows later in bursts of input. It leaves open a 2-‐10 ms time window for output firing of excitatory cells (Luna and Schoppa, 2008; Stokes and Isaacson, 2010). This inhibitory feedback mechanism might be provided by layer 3 interneurons, thus neurogliaform, bitufted, fast-‐spiking inhibitory multipolar and regular-‐spiking inhibitory multipolar cells (Suzuki and Bekkers, 2010 and 2012) (Fig. 1C and 12D).
16
I N T R O D U C T I O N
These neurons make connections with a large fraction of neighbouring pyramidal cells so that it is speculated that they may be implied in “lateral inhibition” mechanisms (Stokes and Isaacson, 2010). A detailed quantification of synaptic contacts originating from single superficial layer II pyramidal cells reveals an even distribution of long-‐range connections in the piriform cortex without a tendency towards a stereotype local clustering (Illig and Haberly, 2003). However, local collateral regions of intense axonal branching around the pyramidal cell body were found, too (Johnson et al., 2000). This hints at the existence of local associative microcircuits between principle excitatory piriform cortex neurons, but how these microcircuits are organized and what functional role they are playing was unclear so far. 4 .2 .4 P la sticity
The cell groups that are connected in microcircuits are not static hard-‐wired ensembles, but plasticity mechanisms allow dynamic changes in their modes of input processing, connectivity and output firing. Some authors relate synaptic and cellular plasticity to learning and memory phenomena (e.g. Malenka and Nicoll, 1997; Rogan et al. 1997; Best and Wilson, 2004). Dependent on timescale and synapse, different modes of plasticity are found in PC: The M and T to pyramidal cell synapse shows short-‐term depression on a timescale of a minute. It is mediated at least in part by a presynaptic mechanism downstream of calcium influx and intracellular release (Wiegand et al, 2010) and can be influenced by presynaptic metabotropic glutamate receptors group III and beta-‐ adrenergic receptors (Best and Wilson, 2004). It has been suggested that this mechanism mediates odour habituation, which can be observed on a behaviour level (Best and Wilson, 2004). PC pyramidal cell dendrites possess two different compartments corresponding to the clear anatomical segregation of LOT and associative inputs: a more distal compartment where the sensory inputs synapse and a more proximal compartment where associative synapses are located. The associative synapses on L2P in layer Ib can undergo strong NMDA-‐dependent longterm potentiation (LTP)
17
I N T R O D U C T I O N
(Kanter and Haberly, 1990; Quinlan et al., 2004; Franks and Isaacson, 2005), whereas in layer Ia M/T to pyramidal cell synapses LTP is not reliably or just very modestly inducible after a short critical period during development (Jung et al., 1990, Kanter and Haberly, 1990 and 1993). Several mechanistic explanations for the differences between layer Ia and layer Ib were found: First, LTP induction by pairing EPSPs with subsequent AP bursts under physiological conditions seems to be possible only in layer Ib mediated by much larger spine Ca2+ signals. The smaller layer Ia signals are partially due to a smaller VGCC mediated Ca2+ influx and a more robust Mg2+ block of the NMDAR (Johenning et al., 2009). Second, LTP expression in layer Ia is altered by an AMPAR/NMDAR ratio change dependent on olfactory experience (it can be prevented by a unilateral naris occlusion) during development towards a downregulation of NMDAR and a modest upregulation of AMPAR (Franks and Isaacson, 2005). Additionally, different forms of learning influence the composition of NMDARs, an important factor detemining LTP expression (Quinlan et al., 2004). The associative synapses on pyramidal cells are able to express long-‐term depression (LTD) in synaptic strength, too. It is unclear if pre-‐ and postsynaptic mechanisms both play a role, but presynaptic metabotropic glutamate receptors seem to be involved (Young and Sun, 2007). 4 .2 .5 O sc illa tio n s
Not only the spatial organisation of a network but also temporal organisation patterns are crucial for information processing. In this regard network oscillations are important phenomena. In PC two basal oscillatory states have been described (local field potentials and single cell membrane potentials): Slow wave states (0,5-‐ 2 Hz), which can be found in many networks during natural sleep or deep anaesthesia, and faster beta (15-‐30 Hz) or theta frequency states (4-‐12 Hz,) which correspond to shallower states of anaesthesia or some forms of awake behaviour. During slow-‐wave sleep states sharp wave ripple complexes (SWR) can be observed, too, that are independent from hippocampal SWRs. APC generated SWRs drive OB SWRs and it is speculated that these oscillations contribute to the reorganisation of OB granule cell circuits (Manabe et al., 2011).
18
I N T R O D U C T I O N
In contrast to OB neurons, the majority of PC neurons respond only during fast wave states to presented odours, but not during slow wave states (Murakami et al, 2005). These findings suggest, that the PC has a state-‐dependent gating function for the olfactory system, which is similar to parts of the thalamus in other sensory systems. It has been speculated, that the switch between slow and fast wave states is modulated by acetylcholine, which suppresses intrinsic association fiber synapses and thereby makes the system more sensitive to afferent activity (Hasselmo and Bower, 1992; Wilson and Yan, 2010). During weak anaesthesia odours evoke respiration-‐coupled, beta-‐frequency oscillations in the PC local field potential: The firing activity of not specified single layer II/III cells is slowly modulated over time by respiration and precisely phase-‐ locked to the local field potential beta oscillation. Oscillating excitation precedes inhibition by a few milliseconds, restricting spike timing to a brief temporal window. This allows precise spike timing despite the slow respiratory patterning and opens the possibility of a temporal dimension in odour coding (Poo and Isaacson, 2009). A PC network isolated from the OB generates slow wave oscillations spontaneously, with up states and down states alternating at an average frequency of 1.8 Hz. These oscillations seem to be initiated at the border between layer III and the endopiriform nucleus (Sanchez-‐Vives et al, 2008), a region with highly excitable principle cells (Tseng and Hyberly, 1989a and 1989b) and very dense recurrent connections (Hoffman and Haberly, 1991 and 1993). The activity within slow-‐wave states is influenced by recent odour experience (Wilson, 2010) and more coherent with the activity of other cortical forebrain structures (Wilson and Yan, 2010). 4 .2 .6 In p u ts a n d O u tp u ts
The PC is highly interconnected with other brain areas, most of these inputs are not one-‐way connections but reciprocal: As mentioned before the primary sources of afferent input are olfactory bulb mitral cell axons, reaching the PC via the LOT. PC neurons project also back to the olfactory bulb, mainly to inhibitory granule cells
19
I N T R O D U C T I O N
(Murthy, 2011). Via superficial and deep pyramidal cells as well as spiny multipolar cells, the piriform cortex is interconnected with other olfactory areas (both strong associational and less strong commissural projections) and higher cortical areas (Fig. 1A). That means, that olfactory information is linked to systems implied in memory formation and retrieval, affective learning, emotional evaluation and cognitive processing of decision (Gottfried, 2011; Yeshurun et al, 2009; Chu and Downes, 2000). Like other cortical areas, the PC receives diffusely distributed inputs from cholinergic, noradrenergic, serotonergic, dopaminergic and histaminergic cells located in the basal forebrain, brainstem, and hypothalamus (Neville and Haberly, 2004). 4.3
Dise ase s affe cting the olfactor y syste m
Olfactory dysfunction is a cardinal symptom in several disease entities: It is globally impaired in idiopathic Parkinson’s disease, Alzheimer’s and Lewy body dementia, and multisystem atrophy (Herting et al., 2008; Wattendorf et al., 2010). It might be even a prodromal sign of Alzheimer’s disease (Baba et al., 2012). In Schizophrenia no reliable change in odour sensitivity is reported, but deficits in odour identification, recognition and discrimination. In major depression hedonic aspects of odour perception and in some cases, alterations in sensitivity and identification were seen (Atanasova et al., 2008). Whereas olfactory function cannot serve to make the important differential diagnosis between Alzheimer’s disease and geriatric depression, it might be useful to distinguish idiopathic parkinson’s disease from progressive supranuclear palsy, essential tremor, vascular parkinson’s disease or corticobasal degeneration (Liberini et al., 2000; Atanasova et al., 2008; Herting et al., 2008). Olfactory function seems to be disturbed very early in Alzheimer’s and Parkinson’s disease progression. In contrast to depression and schizophrenia, dysosmia and anosmia correspond to alterations specific to the OB and PC (Wattendorf et al., 2009; Li et al., 2010; Wesson et al., 2010). Another disease affecting specifically the PC and sourrounding regions is temoral lobe epilepsy (McIntyre and Gilby, 2008).
20
I N T R O D U C T I O N
Understanding physiological information processing in the PC thus might help to understand early changes in disease processes. 4.4
Ce l l Ty p e Sp e c i f i c Su b c i r c u i t s – H y p o t h e si s
From the network theory perspective, different elements of microcircuit organization underlie sensory and associative memory-‐related cortical processing: Afferent feed forward excitation in sensory microcircuits from relays like the thalamus (or OB) supports sensory (serial) processing. Recurrent feedback excitation in intracortical microcircuits mainly mediates associative memory-‐ related processing in associative brain areas like the CA3 region of the hippocampus (parallel processing; Treves and Rolls, 1992; Douglas and Martin, 2010). These concepts underlie opposing theoretical network models of the PC: some authors describe a serial processing architecture (Ambros-‐Ingerson et al., 1990), others focus on features of parallel processing (Barkai et al., 1994). In vivo current source density analysis in the aPC revealed the sequential activation of sensory and intracortical synapses on aPC principal cells (Ketchum and Haberly, 1993). Therefore, more recently these concepts have been merged into the proposition of the anterior Piriform Cortex (aPC) as a ‘hybrid recurrent/feed forward pattern correlation network’ (Haberly, 2001). In our research, we aimed at assessing the role of these feedforward sensory and local corticocortical associative subcircuits in driving principle cells in the aPC. Most current descriptions of PC sensory activation and local microcircuitry ignore the existence of different populations of excitatory cells in layer II and III. Mostly they put together superficial layer II and deep layer III pyramidal cells, do not mention semilunar cells at all and imply a convergence of sensory and associative inputs on the pyramidal neurons. However, Suzuki and Bekkers (2006) characterised superficial pyramidal cells and semilunar cells as two cell classes having distinct locations, input synaptic properties and output firing properties. For the six-‐layered neocortex it is known that the layering and physiological differentiation of principle cells corresponds to a functional specialisation: Ascending sensory and descending intracortical microcircuits are distributed
21
I N T R O D U C T I O N
(however overlapping) to distinct cell populations in different layers. Sensory inputs from the thalamus mostly target on small layer IV granule pyramidal or stellate cells and to a lesser degree on layer III pyramidal neurons. Layer IV subsequently projects onto layer II/III, which shows extensive lateral connections and distributes intracortical associative fibers. These descending inputs terminate mostly in layer V/IV (Douglas and Martin, 2004; Shipp, 2007; De Felipe and Jones, 2010). In analogy, the differences in anatomical location and physiological characteristics of PC principle cells lead to the hypothesis that they exhibit a distinct integration into ascending sensory and local associative microcircuits and might thereby fulfil a different function. In our study, we therefore aimed at a quantitative assessment of aPC functional microcircuit organization in acute slices of rat brains with respect to these two sensory and intracortical subcircuits and the role of the different cell types in these circuits. We used fast population two-‐photon Ca2+ imaging to probe LOT-‐mediated afferent sensory inputs to layer II and laser scanning photostimulation (LSPS) to quantify intracortical circuitry in layer II/III principal cells of the aPC (Wiegand et al., 2011).
22
M E T H O D S
5
M
5.1
Expe rime ntal Proce dure s
E T H O D S
5 .1 .1 S lic e P re p a ra tio n
Experiments followed approved national and institutional guidelines for animal use. Acute slices of the APC (400 µm thickness) were prepared from wistar rats of either sex (age: postnatal 18–25) in a coronal plane perpendicular to and containing the LOT (Fig. 2) (Johenning et al., 2009). 5 .1 .2 E le ctro p h y sio lo g y
Whole-‐cell voltage and current-‐clamp recordings were performed with a Multiclamp 700B Amplifier (Molecular devices). Data were digitized (National Instruments BNC-‐2090, Austin, TX, USA) at 5 kHz, low-‐pass filtered at 2 kHz and recorded stimulation point-‐specific with Morgentau M1 microscope software (Morgentau Solutions, Munich, Germany) or Igor Pro (Wavemetrics, Lake Oswego, OR). For calibration experiments, patch electrodes (with electrode resistances ranging from 3 MΩ to 6 MΩ) were filled with (in mM): 135 K-‐gluconate, 20 KCl, 2 MgATP, 10 Hepes, 0.2 EGTA, 5 phosphocreatine, 0.2% Biocytin, pH 7.3. For mapping experiments, the intracellular solution consisted of (in mM): 150K-‐ gluconate, 0.5 MgCl2, 1.1 EGTA, 10 phosphocreatine, 0.2% Biocytin, pH ,%#%-%'())%&
7.2. Cells were held in voltage
!" #"$ %&
clamp between –65 and –75 mV. Initial access resistances were below 25 MΩ after breakthrough and not allowed to vary more than &"$'()*+($%&
Figure 2 – Slicing plane All experiments were done in acute aPC slices in a coronal slicing plane. (modified from Demir et al., 2001) 23
M E T H O D S
30% during the course of the experiment in the voltage clamp mode. No access resistance compensation was used. 5 .1 .3 G lu ta m a te u n c a g in g a n d sc a n n in g o f g lu ta m a te -‐e v o k e d a c tiv ity
Laser scanning photostimulation (LSPS) by glutamate uncaging and recording of the glutamate-‐evoked activity were performed on the setup described in Figure 3. For a detailed description see Bendels et al., 2008. In brief, the laser beam of a modified DPSS laser System (Rapp Optoelectronics, Wedel, Germany; DPSS Lasers, Santa Clara, CA, USA) with 355 nm wavelength, frequency-‐tripled Nd:YVO 4, 100 kHz pulse repetition rate) was delivered to a standard Olympus BX-‐51 WI microscope (Olympus, Hamburg, Germany) with a 200 µm fiber optic light guide coupled into the epifluorescence port of the microscope and focused on the specimen by the objective lens. The duration of the light stimulus was controlled by a fast galvanometric driven shutter system controlled via a computer-‐internal PCI-‐ I/O card (Multifunction-‐Data-‐Aquisition NI-‐PCI-‐6221, Shielded Connector Block NIBNC-‐2110, National Instruments, Austin, TX, USA). The microscope optics and, hence, the laser spot was positioned by a motorized XYZ-‐shifting table with a stepsize of 0.1 µm (Shifting Table 380, Luigs & Neumann, Ratingen, Germany), so that the specimen and the recording electrode remained in a fixed position. For the optical control of the experiment a VX55 IR-‐camera (Till Photonics, Munich, Germany) generated an analog video signal, which was read out by a computer-‐ internal frame-‐grabber card (DT-‐3120, Data Translation, Bietigheim Bissingen, Germany) and displayed in real-‐time. The communication software (on the operating system Windows) was hosted on a standard personal computer with a 1.2 GHz Pentium processor and 1 GB of RAM. For triggering of the laser stimulus, control of the XYZ-‐table, planning and execution of the experiment and data acquisition, we used the Morgentau M1 microscope software (Morgentau Solutions, Munich, Germany) (Bendels et al, 2008). For the experiment, 20 ml of 200 µM 4-‐methoxy-‐7-‐nitroindolinyl-‐caged-‐l-‐ glutamate (Tocris, Bristol, UK) were recirculated at 3–5 ml/min. The maximum time period of recirculation was 3 hours. The duration of the laser flash was 2 ms,
24
M E T H O D S
the laser power under the objective, corresponding to the stimulus intensity levels used, was calibrated (see 6.1.2 and 7.1) with a photodiode array-‐based photodetector (PDA-‐K-‐60, Rapp Optoelectronics, Wedel, Germany). The optical system was adapted to achieve an effective light spot diameter of 15 µm in the focal plane. Generally, stimulation points were defined in a hexagonal grid with a raster size of 30 µm. For all experiments, the focal depth of the uncaging spot was set at 50 µm below the slice surface. To correct for differences in focal depth of the uncaging spot due to variability in slice surface height, we adjusted the focal depth for
Figure 3 – Laser scanning photostimulation setup Principle components light path and experiment configuration of the laser scanning photo stimulation setup. The Morgentau M1 software controls all components. The 2 ms laser light beam uncages at a defined location chemically inactivated glutamate. This drives nearby cells (if they are in the critical distance d*, see figure 4 and section 6.1.2) to spike. If the spiking cell is connected to the recorded cell, postsynaptic currents can be observed. By rastering the slice surface, a map of presynaptic input sites can be obtained.
25
M E T H O D S
different subregions (Fig. 10A and B, 11A and 12A and B). These subregions were scanned in a randomized order. It is known that MNI-‐caged-‐Glutamate influences inhibition (see Tocris product description of MNI caged L-‐Glutamate, Cat. Nr 1490, http://www.tocris.com/ dispprod.php?ItemId=22603). We therefore tested the effect of 200 µM MNI-‐caged-‐glutamate, the same concentration that we used in our mapping experiments, on stimulation evoked IPSCs in superficial pyramidal cells. Drug application was reducing IPSCs by about 30-‐50 % (Fig. 4). However, we were considering inhibition as relatively intact, as in our hands, blocking of inhibition with 2 µM of gabazine resulted in large depolarizing events (see Beed et al., 2010), that we did not see during our LSPS-‐Exeperiments with MNI-‐Glutamate. 5 .1 .4 H is to lo g ic a l p ro c e d u re s
Slices with biocytin-‐filled cells were fixed in 0.1 mM phosphate buffer (pH 7.4) containing 4% paraformaldehyde, for 24–48 h. Staining and reconstruction were performed with two methods: Either the filled neurons were visualized by incubating sections in avidin-‐biotin-‐ conjugated horseradish peroxidase (ABC, Vector Laboratories, Ltd., UK) and reacted with diaminobenzidine and hydrogen peroxide. Sections were then dehydrated and embedded on glass slides. Reconstruction and morphological analysis of the biocytin-‐labeled neurons were made with an Olympus BX61WI (Olympus, Hamburg, Germany) attached to a computer system (Neurolucida; Micro-‐ brightfield Europe, Magdeburg, Germany) (Beed et al., 2010).
A 100 pA 300 ms
80 60 40 20 0
26
MNI-Glutamate
100
IPSC in pA
B
0
5
15 10 Time in min
20
Figure 4 – Inhibitory effect of MNI-Glutamate Effect of 200 µM MNI-‐Glutamate on stimulation evoked IPSCs in a L2P cell. The LOT was stimulated with a stimulation electrode with strength from 3.5 to 8 pA. IPSCs amplitudes were between 50 and 100 pA. Excitation was blocked with 50 µM APV and 10 µM NBQX. A Example Traces: Black traces – baseline and after washout, red trace – presence of MNI-‐ Glutamate. B IPSC Amplitudes: baseline – 200 µM MNI-‐ Glutamate – washout. 0.03 Hz stimulation frequency
M E T H O D S
Micro-‐ brightfield Europe, Magdeburg, Germany) (Beed et al., 2010). Alternatively, slices were incubated with Avidin-‐coupled Alexa 488 (Sigma-‐Aldrich, München) in phosphate buffer, washed in ethanol, embedded on glass slides with Fluoromount (Sigma-‐Aldrich, München). Images were taken with a laser-‐scanning confocal microscope and the pictures were processed with the open source image processing software ImageJ. Data were not corrected for tissue shrinkage. The reconstructed cells were superimposed onto the photomicrograph of the native slice with standard graphics software. 5 .1 .5 T w o -‐P h o to n C a lciu m Im a g in g (T P C I)
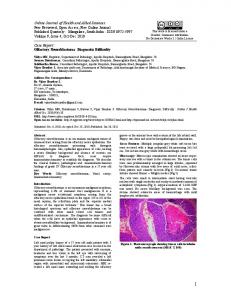
For fluometric Ca2+ measurements, we modified the multi-‐cell-‐bolus-‐loading procedure (Stosiek et al., 2003) adapted to slice preparations (Johenning and Holthoff, 2007). In brief, 200 µM of the red morphological marker CellTracker Red CMTPX were added to 1mM OG-‐BAPTA1-‐AM. Application was performed at three different locations (between layer I and II, in layer II and between layer II and III) at 100 mbar. The application pipette was inserted dorsally from the LOT and the imaged field of view (towards the perirhinal fissure) (Fig. 5B). The stimulation electrode was placed in layer 1a, ventrally between the LOT and the imaged field of view (i.e. towards the LOT). Intracortical inputs were selectively blocked by 30 µM baclofen (Tang and Hasselmo, 1994; Franks and Isaacson, 2005; Johenning et al., 2009). Stimulation strength was adjusted to be at the threshold for activation of at least one cell in the population with two consecutive stimuli. Two-‐photon imaging was performed on a two-‐photon laser-‐scanning system (Femto2D, Femtonics Ltd., Budapest) equipped with a femtosecond laser tuned to 810 nm (Chameleon, Coherent). For epifluorescence, we used an Olympus XLUMPLFL 20x/0.95 N.A: water immersion objective, trans-‐fluorescence and transmitted IR were collected with an Olympus oil immersion condenser. A diagram of the light path is shown in Figure 5A (Chiovini et al., 2010). Multiple cells (20-‐30) within a field of view were scanned at constant speed (125 Hz or 250 Hz) (Fig. 5C, red path sections) while intermediate sections were jumped over within olfactory
27
M E T H O D S
Figure 5 – Two-photon population imaging setup. A Principle components and light path of the two-‐photon population imaging setup. Abbreviations: CCD – charge-‐coupled device camera; Cond – condensor; IR – infrared light source, Obj – objective; PMT – photomultiplier; TIR - transmission infra red detector (from Chiovini et al., 2010). B Cell Tracker Red CMTPX as a red morphological marker and OG-‐BAPTA1-‐AM as a voltage sensitive dye are injected with 100 mbar into the slice. Sensory inputs are stimulated with a stimulation electrode positioned in layer Ia, intracortical inputs were selectively blocked by 30 µM baclofen. C The calcium response of multiple cells is imaged using multiple line scanning. Only red parts of the indicated track are scanned, while the yellow intermediated sections are jumped over within 60s.
60 µs, using a spline-‐interpolated path (Multiple Line Scanning; Lorincz et al.,2007) (Fig. 5C, yellow path sections). Measurement control, data acquisition and analysis were performed using the Matlab-‐based MES program package (Femtonics Ltd., Budapest). Cells covered by the multiple line scan were blindly and randomly picked before stimulation. 5.2
Data analysis and statistics
For cell type classification, we used three parameters: input resistance, burst index and normalized depth for layer II cells. The burst index was calculated as Δt2/Δt1, where t1 is the time interval between the first and second AP, and t2 between the second and third AP, in a 600-‐ms-‐long train of eight APs (Suzuki and Bekkers,
28
M E T H O D S
2006). The superficial and deep border of layer II were defined on visual inspection of low-‐magnification DIC images. Cells were localized on a normalized vertical axis, with 0 being the superficial and 1 the deep border. 5 .2 .1 A n a ly sis o f L S P S d a ta
For detection of synaptic events, we used the automatic detection method described by Bendels et al . 2008. The iterative algorithm is based on four criteria: the absolute peak amplitude (larger than 10 pA), the maximum absolute slope of the rising part of the PSC (faster than 2.8 pA/ms), the time-‐interval between the initiation of the PSC and its peak (shorter than 13 ms) and the total amount of electric charge that is transported out of the cell (negative for EPSCs and positive for IPSCs) (Bendels et al., 2008). Parameters used by the algorithm were based on visual inspection of the raw data. Inputs were classified as direct if they occurred in the first 5 ms after the light beam. This distinction between direct and indirect inputs was verified recently by the analysis of the temporal occurance of current clamp responses and by TTX control experiments (Bendels et al., 2010). Fig. 7B displays examples traces with events detected by the algorithm. The IPSC information was not analysed in this study. In a second analysis step, a second algorithm was used for discriminating photoactivated synaptic inputs (synaptic points) from random background activity. It is based on the observation that a presynaptic cell has several neighbouring activation sites (Fig. 8A, B and C; 10B and C). Consequently, spatial correlation of inputs indicates specific activation. To extract significant spatial correlations, we tested the significance of the number of observed inputs in a restricted region against the null hypothesis of a random spatially uncorrelated pattern. A detailed description of this algorithm is given in Bendels et al., 2010. To work out spatial differences in connectivity between the different cell populations, we defined a layer-‐specific connectivity coefficient, calculated as the ratio of positive synaptic points to all scanning points in a layer (synaptic pointslayer/scanning pointslayer). For analyzing differences of input positions in relation to the dorsoventral main
29
M E T H O D S
axis, we distinguished layer-‐specific dorsal and ventral sectors by constructing an axis through the cell body perpendicular to the surface or the aPCX layer I/LOT border. We observed a wide and patchy distribution of inputs (see, for example, Fig. 10A, B and 12A). For each individual cell, we aimed at finding a measure of how the inputs are distributed on both sides of the axis. The first step was to calculate the sector-‐specific connectivity coefficient analogous to the layer specific connectivity coefficient (synaptic pointssector/scanning pointssector), in which a sector is defined as the stimulated area on one side of the axis. A comparison of the relative weight of inputs on either side of the axis between different cells needs to be independent of the baseline connectivity. It was therefore necessary to correct for differences in overall connectivity. The correction factor for a cells’s overall connectivity was determined as the quotient of scanning pointsTOTAL and synaptic pointsTOTAL. When calculating the position coefficient of a given sector for a given cell (synaptic pointsSECTOR/scanning pointsSECTOR)*(scanning pointsTOTAL /synaptic pointsTOTAL ), cells with large overall connectivity will have a small correction factor and cells with small overall connectivity will have a large correction factor. We then subtracted the ventral from the dorsal position coefficient for each layer in every cell. Values >0 indicate an asymmetry towards the dorsal side, values