Syst. Biol. 50(6):945–969, 2001
Sequence Alignment of 18S Ribosomal RNA and the Basal Relationships of Adephagan Beetles: Evidence for Monophyly of Aquatic Families and the Placement of Trachypachidae V EREL L. S HULL,1 ALFRIED P. V OGLER,1,2,5 M ICHAEL D. B AKER,3,4 D AVID R. M ADDIS ON,3 AND P ETER M. HAMMOND 1 2
1 Department of Entomology, The Natural History Museum, London SW7 5BD, UK Department of Biology, Imperial College at Silwood Park, Ascot, Berkshire SL5 7PY, UK 3 Department of Entomology, The University of Arizona, Tucson, Arizona 85721, USA
Abstract.—Current hypotheses regarding family relationships in the suborder Adephaga (Coleoptera) are conicting. Here we report full-length 18S ribosomal RNA sequences of 39 adephagans and 13 outgroup taxa. Data analysis focused on the impact of sequence alignment on tree topology, using two principally different approaches. Tree alignments, which seek to minimize indels and substitutions on the tree in a single step, as implemented in an approximate procedure by the computer program POY, were contrasted with a more traditional procedure based on alignments followed by phylogenetic inference based on parsimony, likelihood, and distance analyses. Despite substantial differences between the procedures, phylogenetic conclusions regarding basal relationships within Adephaga and relationships between the four suborders of Coleoptera were broadly similar. The analysis weakly supports monophyly of Adephaga, with Polyphaga usually as its sister, and the two small suborders Myxophaga and Archostemata basal to them. In some analyses, however, Polyphaga was reconstructed as having arisen from within Hydradephaga. Adephaga generally split into two monophyletic groups, corresponding to the terrestrial Geadephaga and the aquatic Hydradephaga, as initially proposed by Crowson in 1955, consistent with a single colonization of the aquatic environment by adephagan ancestors and contradicting the recent proposition of three independent invasions. A monophyletic Hydradephaga is consistently, though not strongly, supported under most analyses, and a parametric bootstrapping test signicantly rejects an hypothesis of nonmonophyly. The enigmatic Trachypachidae, which exhibit many similarities to aquatic forms but whose species are entirely terrestrial, were usually recovered as a basal lineage within Geadephaga. Strong evidence opposes the view that terrestrial trachypachids are related to the dytiscoid water beetles. [Adephaga; aquatic beetles; Coleoptera; sequence alignment; small subunit rRNA, tree alignment.]
Adephaga contains more than 30,000 species or almost 10% of all the described species of Coleoptera and is traditionally grouped into 8 to 12 or more families. Numerous morphological characteristics indicate monophyly of the suborder (see Beutel, 1995), and several fundamental traits differ from those of the second large suborder, Polyphaga (Lawrence and Newton, 1982). Although relationships with the small suborders Archostemata and Myxophaga are still the subject of much debate, the division of the majority of extant beetle species into Adephaga and Polyphaga seems to reect a natural, deep-rooted divergence that few authors dispute (Crowson, 1960; KukalovaPeck and Lawrence, 1993; Lawrence and Newton, 1982).
4 Present address: Department of Entomology, 411 Science II Building, Iowa State University, Ames, Iowa 50011, USA. 5 Corresponding author; E-mail:
[email protected]
Whereas Adephaga can be taken as a well-supported monophyletic group, relationships within Adephaga are highly contentious. Ecologically, they can be subdivided into a series of terrestrial groups, including Carabidae, Paussidae, Rhysodidae, Cicindelidae, and Trachypachidae (referred to as “Geadephaga”), and aquatic groups, including Gyrinidae, Dytiscidae, Noteridae, Hygrobiidae, Haliplidae, and Amphizoidae (“Hydradephaga”). This subdivision is ambiguous for the semiaquatic Amphizoidae and is compromised by the terrestrial Trachypachidae. Although trachypachids inhabit dry places away from open water and generally share the habits and body shape of the terrestrial Carabidae, they resemble Hydradephaga in several features generally considered to be adaptations to aquatic life. Further, the aquatic groups are ecologically and functionally heterogeneous and include species crawling on submerged vegetation feeding either on algae (Haliplidae) or on oligochaetes
945
946
S YSTEMATIC BIOLOGY
(Hygrobiidae), fast-swimming predatory forms such as the “true” diving beetles (Dytiscidae), and the highly specialized whirlygig beetles (Gyrinidae), which hunt on the water surface. Modes of swimming and stroke also differ between groups, with Hygrobiidae and Haliplidae using all three pairs of legs, whereas Dytiscidae and Noteridae use only the hind legs to produce the main thrust and the middle legs to maneuver. Haliplids and hygrobiids exhibit alternating leg movements, but noterids and dytiscids move the pairs of legs simultaneously. This diversity of aquatic life styles therefore raises the question about the common origin of the aquatic groups (Beutel, 1995; I. Ribera, pers. commun.) The two principal hypotheses relating to basal relationships in Adephaga (Fig. 1) differ in the phylogenetic relevance of the separation of terrestrial and aquatic taxa. Crowson (1955, 1960) was the rst to propose the monophyly of the hydradephagan
VOL. 50
families and to treat them as sister to the terrestrial Geadephaga (Fig. 1A). He further suggested that Trachypachidae represented a relict group that shares morphological characters with both Hydradephaga and Geadephaga and therefore concluded that this family is derived from a terrestrial ancestor that is sister to the (derived) Hydradephaga. Crowson concluded that only two groups could be readily distinguished within Hydradephaga: the “lower” families (Amphizoidae, Hygrobiidae, and Haliplidae) and the dytiscoid families (Gyrinidae, Noteridae, and Dytiscidae), the latter being a product of a subsequent radiation from an ancestral group of dytiscoid families. Within Geadephaga, which is dominated by the speciesrich Carabidae (ground beetles; over 24,000 described species), Crowson placed Rhysodidae, a small group of species feeding on slime molds associated with rotten wood (Bell, 1994), as the sister to the remaining geadephagans (minus Trachypachidae).
FIGURE 1. Relationships of Adephagan families as proposed by (a) Crowson (1960), (b) Hammond (1979), (c) Kavanaugh (1986), and (d) Beutel and Roughley (1988). Thick black lines denote hydradephagan taxa, thick gray lines represent geadephagan taxa, and thin black lines signify other Coleoptera and outgroups. Cicindelidae have generally been considered a grouping within the Carabidae and are not shown separately in these trees.
2001
S HULL ET AL.—HIGHER-LEVEL BEETLE PHYLOGENY
He also redened Paussidae to include the Ozaeninae and concluded that this family was the sister to the remaining Carabidae. Finally, he considered the Cicindelidae (tiger beetles) a subfamily within the Carabidae, but of unclear phylogenetic associations. Several authors concur with Crowson’s scheme but they disagree with the position of Trachypachidae as the sister to Geadephaga. Hammond (1979) considered Hydradephaga to include Trachypachidae (rendering Hydradephaga sensu Crowson paraphyletic) (Fig. 1B). Some authors have generally agreed with Hammond, concluding that Trachypachidae form a monophyletic group together with the dytiscoid (Noteridae, Amphizoidae, Hygrobiidae, and Dytiscidae) complex (Bell, 1966; Ward, 1979; Roughley, 1981). The second basic hypothesis of basal adephagan relationships rejects the monophyly of Hydradephaga. These proposals consider one or more of the hydradephagan families to be sister of Geadephaga. One of these (Kavanaugh, 1986) proposed Haliplidae to be sister to Geadephaga, with Trachypachidae at the base of the latter (Fig. 1D). Beutel and colleagues, on the basis of a numerical cladistic analysis using adult and larval characters (Beutel and Roughley, 1988; Beutel, 1993, 1995, 1999; Beutel and Haas, 1996), proposed that the surface-swimming Gyrinidae are the most basal group of Adephaga, followed by Haliplidae, and an ancestor of Dytiscoidea and Geadephaga (Fig. 1C). Although on this tree it is most-parsimonious to presume aquatic life style to be ancestral within Adephaga, Beutel and colleagues follow Crowson (1960) who stated that, ”No serious coleopterist has ever suggested that terrestrial caraboids are derived from the aquatic ones; it is universally assumed that the derivation has been in the reverse sense.” Therefore, Beutel’s cladograms invoke three independent invasions into aquatic environments (as rst suggested by Bell, 1966, and supported by Ponomarenko, 1977) from riparian ancestors (Beutel, 1999). Given the difculties in resolving phylogenetic relationships in Adephaga with morphological characters, we conducted a molecular study to address the question of adephagan higher-level relationships. We used 18S rRNA, a molecule that in recent years has turned into the marker of choice for analyzing higher-level phylogenies in
947
beetles (Vogler and Pearson, 1996; Farrell, 1998; Maddison et al., 1999a,b). Although this molecule contains tracts of both slowly and quickly evolving sequences and is potentially useful for resolving relationships over a wide hierarchical range (Hillis and Dixon, 1991), phylogenetic inferences are compromised by extreme rate heterogeneity and differences in nucleotide composition and sequence length, in particular in the hypervariable regions or expansion segments (Hancock et al., 1988; Tautz et al., 1988). However, given the relative ease of data collection with universal polymerase chain reaction (PCR) primers, an ever-increasing database of 18S rRNA sequences throughout the tree of life, including Coleoptera, requires development and test of appropriate methods for alignment and phylogenetic reconstruction. In this paper, we explore the effect of different alignment strategies, in particular focusing on tree alignment for aligning sequences concurrent with the tree search (Sankoff, 1975; Wheeler, 1996), and compare the results with those of more traditional procedures in which the tree search is performed on a prior alignment. Methodological Issues of Sequence Alignment Tree inference methods that use tree alignments (Sankoff and Cedergren, 1983) are “alignment-producing”; that is, for each phylogenetic tree considered, an evolutionary scenario is reconstructed by which an ancestral sequence is assumed to have evolved into the observed sequences along the tree, thus producing an alignment of bases. Because sequence evolution consists of base substitutions, insertions, and deletions, all of these events would ideally be considered in calculating the tree length or likelihood of a tree (Sankoff et al., 1973; Sankoff, 1975; Sankoff and Rousseau, 1975; Sankoff and Cedergren, 1983; Felsenstein, 1988; Hein, 1989; Thorne and Kishino, 1992; Mitchison and Durbin, 1995; Wheeler, 1996, 1998; Mitchison, 1999). Proposed homologies of bases in extant species would follow from the placement of insertions and deletions on the tree, and these bases would thus be aligned one to another. Thus, for each tree, a tree alignment would be created, an alignment that probably would differ from tree to tree in regions with a rich history of insertions and deletions (Wheeler, 1998).
948
S YSTEMATIC BIOLOGY
In contrast, the standard approach dissociates the alignment of bases (determination of base homologies) from the phylogenetic inference. Alignments are typically done before phylogenetic inference, rather than performed on the individual trees being compared during the search for optimal trees. Moreover, the alignment of sequences produced attempts to minimize substitutions, insertions, and deletions—often by considering one xed phylogeny or by making pairwise alignments of closely similar sequences or groups of sequences. The tree length or other objective function used to judge a tree is then calculated with this matrix. Thus, the homology of bases remains xed after the rst step, and the quest for the optimal tree does not permit alternative alignments during tree search; that is, insertion and deletions are immovable during the tree inference step. Correspondences of bases between sequences therefore are not determined in the context of the tree, and character substitutions might be assumed (and used as the basis for counts of tree lengths and likelihoods) between bases that are not of common descent. Unfortunately, no known method can accurately consider substitutions, insertions, and deletions simultaneously on a tree— and thus nd the optimal tree alignment or calculate tree length or likelihood of the tree—despite several attempts to develop one (Sankoff, 1975; Sankoff and Rousseau, 1975; Sankoff and Cedergren, 1983; Hein, 1989; Mitchison and Durbin, 1995; Wheeler, 1996, 1998; Schwikowski and Vingron, 1997; Ravi and Kececioglu, 1998; Mitchison, 1999). The search for the optimal alignment on any one tree is as difcult as the search for optimal trees (Woo et al., 1994), and thus for most cases only approximate methods of calculating the tree length or likelihood of a tree are available. We used two approaches for tree reconstruction, both approximations to an ideal analysis. The rst considered substitutions, insertion, and deletion events simultaneously in judging each tree. The application of this strategy is much facilitated with the development of the POY software (Gladstein and Wheeler, 1996), which uses an algorithm that produces an estimated tree alignment and associated tree length and thus permits selecting the shortest trees/alignments among a collection of trees. An unsolved
VOL. 50
problem with this is that the rank order of a set of trees will depend on the accuracy of the estimated tree lengths. If the rank order of estimated versus true tree lengths of a collection of trees differs, then the trees judged optimal on the basis of POY’s estimated tree length may not correspond to the trees judged optimal according to the true tree length. Because the magnitude of the error of the estimated tree length is not known, how severe a problem this might be is unclear. (Although POY does calculate the exact cost of a given tree alignment, tracing back the downpass through the tree and determining the cost of that optimization, this does not solve the problem of determining the optimal tree alignment, that is, the set of correspondences of the bases that gives the lowest cost for a given tree [W. Wheeler, in litt.]). Nonetheless, the method provides a valuable counterpart to the more traditional approach of separation of the analysis into two steps, alignment and phylogeny inference. The approach of POY better addresses the problem of inferring insertions and deletions on a tree but gives only approximate tree lengths; the traditional approach, on the other hand, does not address insertions and deletions appropriately but gives exact tree lengths or likelihood values. Here we have compared the results of applying both procedures to a dataset of 49 fulllength sequences of the 18S rRNA gene for a representative sample of adephagan taxa and outgroups from the three other suborders of Coleoptera and related neuropteroid orders of insects. Both types of analysis produced broadly similar tree topologies that discriminate between some of the proposed hypotheses of adephagan relationships, in particular with regard to the major subdivision into terrestrial and aquatic families. The similarity of results of the two procedures suggests that approximate, parsimony-based, tree alignment methods have matured to be viable alternatives to the traditional approach. M ATERIALS AND M ETHODS Taxon Choice and Sampling Approach Our goal was to include species from each of the nine adephagan families recognized by Lawrence and Newton (1995) plus the distinct lineages Cicindelidae and Paussidae (Table 1). For the larger adephagan
2001
949
S HULL ET AL.—HIGHER-LEVEL BEETLE PHYLOGENY
TABLE 1. Summary of sampled taxa. Classication
Neuroptera: Ithonidae Oliarces clara Bamks Neuroptera: Chrysopidae Anisochrysa carnea Stephens Raphidioptera: Raphidiidae Phaeostigma notata Linn´e Megaloptera: Sialidae Sialis sp. Archostemata: Cupedidae Distocupes sp. Myxophaga: Torridincolidae Torridincola rhodesica Steffan
GenBank accession number
Location and date of specimen collection, or DNA sequence reference
Collector
AF012527
Maddison et al. (1999b)
X89482
Chalwatzis et al. (1996)
X89494
Chalwatzis et al. (1996)
X89497
Chalwatzis et al.(1996)
AF201421
Australia
J. Galian
AF201420
S. Africa: Punmalanga (Eastern Transvaal), Graskop, Waterval River, 24± 500 S 30± 520 E (5 February 1997)
S. Endrody¨ Younga
AF012525
Maddison et al. (1999b)
AF201418
Near Minety, Wiltshire, U.K. (30 March 1997)
AF002809
Maddison et al. (1999a)
AF012526
Maddison et al. (1999b)
AF201419
Pen Ponds, Richmond Park, Surrey, U.K.
X07801
Hendriks et al. (1988)
AF201417
Valence, France ( July 1996)
M. Barclay
AF201412
Sepulga Creek, Conecuh Co., Alabama, USA (1994)
S. Oygur
AF201413
Maddison, Baker, and Ober
Adephaga: Haliplidae Haliplus laminatus Schaller Haliplus rucollis Degeer
Old Town Creek at Highway 31, 31± 270 N 86± 490 W, Alabama, USA (17 March 1997)
AF201405 AF201406
P. Hammond P. Hammond
Adephaga: Noteridae Noterinae Hydrocanthus oblongus Sharp
U.K. (1 March 1997) Ravenscourt Park, London, U.K. (23 October 1996)
AF201415
S. Oygur
Noterus clavicornis Degeer
AF201416
Suphis inatus LeConte Adephaga: Hygrobiidae Hygrobia hermanni Fabricius
AF012523
Sepulga Creek, Conecuh Co., Alabama, USA (1994) Bookham Common, Surrey. U.K. (30 October 1996) Maddison et al. (1999b)
AF201414
Bookham Common, Surrey, U.K. (11 September 1997)
C. Turner
AF201407
Ol Ari Nyiro Ranch, 50 km NW of Rumuruti, Laikipia District, Kenya (25 August 1996)
D. J. Larson
Myxophaga: Hydroscaphidae Hydroscapha natans LeConte Polyphaga: Hydrophilidae Helochares lividus Forstmann Polyphaga: Scarabaeidae Dynastes granti Horn Polyphaga: Clambidae Clambus arnetti Endrody¨ Younga Polyphaga: Scirtidae Cyphon hilaris Nyholm Polyphaga: Tenebrionidae Tenebrio molitor Linn´e Polyphaga: Anthribidae Bruchela conformis Suffrian Adephaga: Gyrinidae Gyrininae Gyrinus sp. Muller ¨ Spanglerogyrinae Spanglerogyrus albiventris Folkerts
Adephaga: Dytiscidae Copelatinae Copelatus kalaharii Gschwendtner
P. Hammond
P. Hammond
M. Barclay
(Continued on next page)
950
S YSTEMATIC BIOLOGY
VOL. 50
TABLE 1. Continued. Classication
Laccophilinae Laccophilus hyalinus Degeer Hydroporinae Hydroporus erythrocephalus Linn´e Neoporus sp. Dytiscinae Cybister mbriolatus Say Adephaga: Trachypachidae Systolosoma lateritium N´egre Trachypachus holmbergi Mannerheim Adephaga: Carabidae Cychrini Scaphinotus petersi catalinae Van Dyke Nebriini Nebria brevicollis Fabricius Siagonini Siagona jennisoni Dejean Loricerini Loricera pilicornis Fabricius Elaphrini Elaphrus cupreus Duftschmid Migadopini Antarctonomus complanatus Blanchard Omophronini Omophron americanus Dejean Scaritini Pasimachus californicus Chaudoir Clivinini Clivinini sp. (larva) Dyschirius aeneus Dejean Broscini Creobius eydouxi Gu´erun-M´en´eville Bembidiini Bembidion teracolum Say Psydrini Psydrus piceus LeConte Mecyclothorax vulcanus Blackburn Platynini Agonum albipes/marginatum Linn´e Chlaeniini Chlaenius vestitus Paykull Adephaga: Paussidae Metrius contractus Eschscholtz Pachyteles striola sp.
GenBank accession number
Location and date of specimen collection, or DNA sequence reference
Collector
AF201410
Bookham Common, Surrey, U.K. (30 October 1996)
M. Barclay
AF201409
Niedersachsen, Zwillbrocker Venn, Germany Sepulga Creek, Conecuh Co., Alabama, USA (1994)
A. Vogler
AF201411
S. Oygur
AF201408
Whiting et al. (1997)
AF012522 AF201394
Maddison et al. (1999b) Univ. of Alberta, Edmonton, Alberta, Canada (1995)
AF002801
Maddison et al. (1999a)
AF201395
Ruislip Lido, London, U.K. (9 April 1996)
AF012494
Maddison et al. (1999b)
AF201396
Ruislip Lido, London, U.K.
P. Hammond
AF201397
Niedersachsen, Zwillbrocker Venn, Germany (15 July 1994)
A. Vogler
AF012504
Maddison et al. (1999b)
AF201398
Sepulga Creek, Conecuh Co., Alabama, USA (1994)
S. Oygur
AF201399
Sierra Anchas, Gila Co., Arizona, USA (26 June 1994)
D. F. Brown
AF201400
North shore of Lake Okeechobee, Florida, USA (12 September 1976) Eypes Mouth, Dorset, U.K. (4 August 1997)
P. Hammond
AF201401
D. Pollock
P. Hammond
R. Booth
AF012498
Maddison et al. (1999b)
AF201402
Ruislip Lido, London, U.K. (9 April 1996)
AF002784 AF012482
Maddison et al. (1999b) Maddison et al. (1999b)
AF201403
Ruislip Lido, London, U.K. (9 April 1996)
P. Hammond
AF201404
Ruislip Lido, London, U.K. (9 April 1996)
P. Hammond
AF012515 AF012517
Maddison et al. (1999b) Maddison et al. (1999b)
P. Hammond
2001
951
S HULL ET AL.—HIGHER-LEVEL BEETLE PHYLOGENY TABLE 1. Continued.
Classication
GenBank accession number
Adephaga: Cicindelidae Omus californicus Eschscholtz
AF201392
Oxycheila nigroaenea Bates
AF201393
Adephaga: Rhysodidae Clinidium calcaratum LeConte Omoglymmius hamatus LeConte
AF012521 AF012520
Location and date of specimen collection, or DNA sequence reference
2 mi S of Camel, Monterey Co., California, USA (20 March 1994) 1700 m above sea level, 10 km E of Asni, Ecuador (21 September 1993)
Collector
D. Brzoska D. L. Pearson
Maddison et al. (1999b) Maddison et al. (1999b)
families we attempted to include a wide range of exemplars. Our dataset includes at least one species from the following: both subfamilies of Gyrinidae (Spanglerogyrinae and Gyrininae); one of the two subfamilies of Noteridae (Noterinae is included, Phreatodytinae is not); four of the six subfamilies of Dytiscidae (Copelatinae, Laccophilinae, Hydroporinae, and Dytiscinae are included; Colymbetinae and Aubehydrinae are not); and 15 tribes of Carabidae. A recent and more thorough sampling of Carabidae can be found in Maddison et al. (1999b). Because of the possibility that Adephaga is the most basal suborder of Coleoptera (Kukalova-Peck and Lawrence, 1993), we also included four published sequences of neuropteroid insect orders (Chalwatzis et al., 1996), the presumed sister groups of Coleoptera. DNA Extraction, Amplication, and Sequencing All sequences newly reported in this paper, except for Spanglerogyrus and Torridincola, which were obtained by the protocol described in Maddison et al. (1999b), were acquired as follows. Total DNA was extracted from single fresh, frozen, silicadried, or ethanol-preserved specimens by a phenol–chloroform extraction method as described previously (Vogler et al., 1993). Only the thorax was used for large beetles, the entire specimen for small beetles. DNA amplication was performed with either AmpliTaq DNA polymerase (Perkin-Elmer) and the magnesium-containing buffer supplied by the manufacturer (100 mM TrisHCl, pH 8.3 at 25± C, 500 mM KCl, 15 mM MgCl 2 , and 0.01% w/v gelatin, autoclaved) or Ready-To-Go PCR beads, which contain 1.5 U of Taq polymerase, 10 mM Tris-HCl,
pH 9.0 at 25± C, 50 mM KCl, 1.5 mM MgCl2 , 200 ¹M of each dNTP, and stabilizers, including bovine serum albumin (Pharmacia Biotech). Each 18S rRNA sequence was amplied as four overlapping fragments of 500–800 bp. Successful amplication of these smaller fragments was generally more successful than trying to amplify the gene as a single fragment. The primers used for amplication included three primers designed to amplify the 50 end of the gene: 18S50 (5 0 GACAACCTGGTTGATCCTGCCAGT), 300R (50 TCAGGCTCCCTCTCCGG), and 18Sb5.0 (50 TAACCGCAACAACTTTAAT). The six primers used to amplify the middle region of the gene were 18Sai, 18Sbi, 18Sa0.7, 18Sa1.0, and 18Sb0.5 (Whiting et al., 1997) and 18Sb2.5 (50 TCTTTGGCAAAT GCTTTCGC). Finally, four newly designed primers were used to amplify the 30 end of the gene: 18Sa2.0 (50 ATGGTT GCAAAGCTGAAAC), 18Sa2.4 (50 TCCGAT AACGAACGAGACTC), 18S30 II (50CATCT AAGGGCATCACAGAC), and 18S30 I (50 CA CCTACGGAAACCTTGTTACGAC). The cycling conditions generally used were: 30 s at 94± C, 30 s at 45–55± C, and 1–2 min at 72± C (repeated for 30 to 40 cycles), followed by 10 min at 72± C. Amplication products were puried with the GeneClean II kit (Bio 101, Inc.). Automated DNA sequencing reagents were supplied by either Applied BioSystems Ltd. (PRISM Ready Reaction Taq Cycle Sequencing, DyeDeoxy Terminator Reaction Kit), or Amersham Life Science, Inc. (Thermo Sequenase Dye Terminator Cycle Sequencing Pre-Mix Kit). Sequencing reactions were puried by ethanol precipitation and then electrophoresed on an ABI377 sequencer. Sequencing errors/ambiguities were edited, and contiguous sequences for a given species were constructed by using Sequencher 3.0 software (Gene Codes Corp.).
952
S YSTEMATIC BIOLOGY
The sequences used in this study were based on a single specimen and were complete except for the ends used for PCR and for additional short stretches of sequences missing from the 50 end (Omoglymmius hamatus, Torridincola rhodesica) or from the 3’ end of the gene (Suphis inatus, Agonum albipes, T. rhodesica, and Distocupes sp.). In addition, Haliplus laminatus and H. rucollis are each missing a 34-base sequence located 30 of the V4 expansion segment. Generally, amplication was straightforward for geadephagan taxa but more difcult in aquatic beetles, for which amplication frequently failed or produced highly divergent sequences possibly attributable to endogenous microorganisms. Efforts to obtain amplication products from a representative of Amphizoidae failed entirely, despite independent attempts in the laboratories of both A.P.V. and D.R.M. A detailed description of sequences from further aquatic adephagans and potential experimental inconsistencies of the sequences reported here will be discussed elsewhere (Ribera and Vogler, unpubl.), but for the large majority of nucleotide positions included in this study no such problems are expected. GenBank accession numbers are listed in Table 1. Sequence Alignment and Phylogenetic Analysis For tree alignment we used a parallel version of POY vers. 2.6 running in a cluster of six Pentium processors at 450 MHz connected in parallel and PVM software. For all searches reported, we present the best (lowest cost) trees from 20 random addition replicates and collecting no more than three shortest trees in each replicate (commands: –random 20 –maxtrees 3). To explore different gap costs, we used gap costs below (gap D 1, change D 1) and above (gap D 4) the POY default parameters (gap D 2). Constrained searches were conducted with the –agree command by using a constraint le obtained with the program Jack2Hen (available with the POY software). An aligned data matrix can be based on the tree reported by POY, which is itself based on the correspondences of bases among the terminal taxa, using the –impliedalignmentoption. The cost of trees based on this aligned matrix was also assessed in PAUP4.0b2a
VOL. 50
(Swofford, 1999). Tree lengths found (by using the Treescore option) were identical or very similar to those reported by POY, although further parsimony searches (100 TBR replicates, gaps coded as fth character state, gap weight set to same value as specied in the POY searches) on this alignment frequently resulted in slightly shorter trees with minor differences in topology. Bremer support was calculated by an approximate method implemented in POY based on a search procedure using TBR swapping. The complexity of POY searches was reduced by limiting which bases of the full sequence can be homologized (aligned) to each other. As a working hypothesis, we assumed that particular regions of DNA sequence were homologous among all taxa in the matrix, and we delimited these regions according to similarity in the primary structure. In total, we subdivided the primary sequence into 24 such regions. This was done by rst subdividing the full-length sequence into three expansion segment regions (corresponding to expansion segments V2, V4, and V6 of Tautz et al., 1988) and four conserved regions anking these. The expansion segments were further subdivided into three (V2), nine (V4) and seven (V6) segments, each delimited by easily recognizable primary structure motifs common to all taxa. Each of the three expansion segments revealed a central region of high length variability that did not exhibit clearly recognizable primary structure similarity among taxa. Between taxa, the four conserved regions never varied in length by more than »20 bp, whereas the expansion segments, particularly the central regions of V2, V4, and V6, varied greatly. This difference was 53 bp in V2 (28 bp in Tenebrio compared with 81 bp in Oxycheila), 285 bp in V4 (28 bp in Tenebrio compared with 313 bp in Metrius), and 172 bp in V6 (32 bp in Tenebrio and Dynastes compared with 204 bp in Pachyteles). Subdivision of the matrix into such regions of a priori homology also allowed us to include or exclude certain parts of the sequence, in particular the most length-variable regions of the 18S rRNA gene. In practice, for dening the 24 regions of presumed homologies, initial alignments of the raw data were made with Clustal W1.7 (Higgins et al., 1996), using the default parameters of the program. The resulting Clustal matrix was edited
2001
S HULL ET AL.—HIGHER-LEVEL BEETLE PHYLOGENY
and subdivided using Se-Al (Rambaut, 1996). The second type of analysis, with alignment and tree inference separated, were carried out for 10 alignments produced with Clustal W1.7 and 1 alignment “by eye.” Different alignments were created by using a range of gap opening:gap extension costs, keeping the cost for substitutions constant. Unless otherwise stated, characters in regions with large deletions or insertions were omitted, as follows: If any sequence had a consecutive run of ve or more positions in one sequence (row) that lacked nucleotides (i.e., showed gaps), then all characters corresponding to these positions (columns) were omitted. Visual inspection of those characters thus excluded indicated that this served to exclude columns in the hypervariable regions of the molecule only. The “by eye” alignment was produced by D.R.M., using the secondary structure model of the carabid beetle Loricera foveata (Wuyts et al., 2000; see http://rrna.uia.ac.be/secmodel/Lfov SSU. html). Only those regions that could be easily matched with the secondary structure model of Loricera were included in the analysis; this resulted in exclusion of 17.3% of the sequences’ nucleotides (as opposed to 12.7–13.6% for the Clustal alignments). Searches for optimal trees were conducted on each of the alignments by using PAUP¤ 4.0b2a. In parsimony analyses, all characters were treated as unordered, gaps were treated as missing data, and sites were weighted equally. Heuristic searches for most-parsimonious trees used 1,000 random addition sequence replicates and TBR branch swapping. For some analyses, trees were constrained for exploring alternative hypotheses. For analyses with constraints on tree shape, heuristic searches used 200 random addition sequence replicates and TBR branch swapping. Bremer support, bootstrap, and jackknife parsimony analyses were conducted to measure the support for monophyly of Hydradephaga. Searches for most-parsimonious trees to calculate Bremer support values used 100 random addition sequence replicates and TBR branch rearrangement with trees constrained not to contain the focal node. Bootstrap values were calculated with 200 bootstrap replicates, each with a heuristic search of 10 random addition sequence replicates and TBR branch rearrangement.
953
Jackknife values were calculated with 1,000 jackknife replicates given 36.8% character deletion, with each replicate using a heuristic search involving one random addition sequence replicate and TBR branch rearrangement. Maximum likelihood analysis began with choice of a model of character evolution and estimation of the values of parameters. For each alignment, a tree for judging models and for inferring parameter values was found by weak heuristic searches for maximum likelihood trees under simple models of evolution. These searches began with a single search with NNI swapping and assumptions of a transition/transversion ratio of 2 and no site-to-site rate variation. The transition/transversion ratio was estimated on the resulting tree, and then SPR swapping on the tree was conducted assuming the estimated transition/transversion ratio. These trees were considered (Maddison et al., 1999b) to be sufcient for inferring parameters of evolutionary models and for judging the t of models. The likelihood of the one tree from each of these searches was then calculated for evolutionary models of varied complexity by using parameter values estimated from the data. The simplest model examined was a Jukes–Cantor model of nucleotide change, all sites presumed to evolve at the same rate, and base frequencies equal; the most complex was a General Time Reversible (six-parameter) model of nucleotide change, a proportion of sites not free to vary, and the remainder evolving at rates following a gamma distribution, and base frequencies matching the empirically observed values (the GTR C I C 0 model). These and the other 14 models were the same as those examined by Maddison et al. (1999b). As expected, the more complex models yielded greater likelihood values. The most improvement in likelihood came by allowing site-to-site rate variation into the models, rather than increasing the complexity of the nucleotide change model. The most complex model was at least 34 –ln L units less than the next best model. As tested with a likelihood ratio test with four degrees of freedom (see discussion in Maddison et al., 1999b), these models differed signicantly in t at the P D 0.005 level, and thus the GTR C I C 0 model was chosen. Initial likelihood tree searches for the 10 Clustal alignments were conducted with
954
S YSTEMATIC BIOLOGY
8 to 11 random-addition-sequence heuristic searches, SPR rearrangements, and using the more complex model chosen. The maximum likelihood trees for six of these alignments showed Adephaga as monophyletic, whereas in the other four, Hydradephaga was more closely related to Polyphaga than to other adephagans (see Results). According to the diversity of resulting trees, two alignments showing a monophyletic Adephaga (2:1 and 5:1) and two alignments with a paraphyletic Adephaga (7:2 and 10:5) were chosen for more thorough searches and analyses. The more thorough searches for these four alignments and the “by eye” alignment consisted of SPR branch swapping and at least 15 random addition sequence replicates (enough replicates were conducted until the island containing the trees of greatest likelihood was found at least 12 times). Searches for high-likelihood trees under various topological constraints used the same models of evolution as for unconstrained analyses. Constrained trees of high likelihood were found for the ve primary matrices by SPR branch swapping and three random addition sequence replicates. Minimum evolution distance analyses using LogDet distances were conducted to accommodate various base frequencies among clades (Lake, 1994; Lockhart et al., 1994; Steel, 1994). For each matrix 50 heuristic searches with random-addition-sequence starting trees and TBR branch rearrangement were conducted to nd the optimal minimum evolution tree. Optimal constrained trees were sought with the same search strategy. LogDet bootstrap analyses were conducted with 500 replicates, each consisting of a single heuristic search for the minimum evolution tree, except for the “by eye” alignment, for which 2,000 bootstrap replicates were performed. To test for the lack of monophyly of Hydradephaga, we used parametric bootstrapping (Swofford et al., 1996; Goldman et al., 2000). Sequence data were created through simulated evolution up the branches of a phylogeny in which Hydradephaga was constrained to be not monophyletic, and trees were then inferred from the simulated data; this allowed inference of the expected nature of estimated trees if Hydradephaga was not monophyletic. Because some parameters of the model used in the simulation must be
VOL. 50
inferred from an observed matrix, and because we had ve primary alignments, the test was conducted separately for each of the ve alignments. The null hypothesis consisted of the maximum likelihood tree under the constraint that Hydradephaga was not monophyletic, and branch lengths and parameter estimates of a GTR C I C ° model of sequence evolution were estimated by using likelihood from the observed 18S rDNA sequence data. Five hundred simulated data matrices were created under this model, with sequences of length equivalent to those of the observed matrix, by using the Genesis package (D. R. Maddison and W. P. Maddison, 2001) of Mesquite (W. P. Maddison and D. R. Maddison, 2001), which itself used the GTR calculations of PAL (Drummond and Strimmer, 2001). This model does not include insertion or deletion events, and thus all sequences within a simulation are of the same length. The tree length of the mostparsimonious trees under the same constraint as the model tree (nonmonophyly of Hydradephaga) was compared with the length of unconstrained most-parsimonious trees for each of the 500 simulated matrices; for each simulated matrix, both constrained and unconstrained most-parsimonious trees were found by using 20 searches beginning with random addition sequence trees followed by TBR branch rearrangement. This procedure generated a distribution for the test statistic, allowing determination of the probability for observing the equivalent test statistic calculated from the empirical data. This is similar to the likelihood ratio tests of Huelsenbeck et al. (1996), except that parsimony rather than likelihood values are used because of time constraints. Monophyly of Trachypachidae plus Dytiscoidea was tested in the same fashion. To examine the possibility that outgroup sequences were too divergent for proper resolution and rooting of Adephaga, some analyses were repeated with neuropteroid sequences omitted, and again with all nonadephagans omitted. Four new Clustal alignments (with the same 2:1, 5:1, 7:2, and 10:5 alignment weights used previously) were created for the set of beetle sequences and four more for the set of adephagan sequences. Most-parsimonious trees (using 5,000 heuristic searches with randomaddition-sequence starting trees and TBR branch rearrangement), LogDet minimum
2001
955
S HULL ET AL.—HIGHER-LEVEL BEETLE PHYLOGENY
evolution trees (100 heuristic searches), and maximum likelihood trees (enough searches so that the optimal trees were found at least three times, using SPR branch rearrangement) were sought for each of these matrices plus the “by eye” matrix with neuropteroids or nonadephagans removed. R ESULTS The Data The 49 sequences in the analysis varied between 1,888 (Tenebrio) and 2,396 bp long (Pachyteles). The A/T content of the individual sequences varied from 44.6% in Gyrinus to 58.3% in Pachyteles. The proportion of character differences between species varied from 2%, when certain noterids or dytiscids were compared, to 21% between distantly related taxa. One alignment of the complete matrix (using the default parameters of Clustal W 1.7) produced 2,480 positions, of which 1,190 were variable and 834 parsimony-informative (1,109 and 771,
respectively, if only the adephagan ingroup is considered). Simultaneous Alignment and Tree Search On the basis of previous studies (see Fig. 1) and our results, we specied 13 groups of interest to this analysis, which we tested to see if these were recovered in the various tree searches, as indicated in Table 2. We started the analysis, using the simultaneous approach of alignment and tree search, initially with the conserved 18S rRNA regions of the gene only and eliminating the variable regions V2, V4, and V6. Under a gap cost:change cost ratio of 1:1, 16 mostparsimonious trees of length 1,075 were identied that recovered nine of the focal groups as monophyletic (Table 2; Fig. 2). The tree showed the basal position of the suborders Archostemata and Myxophaga relative to Adephaga and Polyphaga, which are sister groups. Further, we found Hydradephaga to be monophyletic. The position of Trachypachidae was unresolved in the
TABLE 2. A summary of monophyletic groups determined from 18S rRNA sequences using POY. Numbers in front of the taxon names correspond to particular nodes of specic interest and are also shown in Figures 2–6. Complete sequences were divided into regions as follows: excluding all expansion segments V2, V4, V6 (all V regions); excluding the central portions of V2, V4, and V6 (central V regions); and excluding the CRPS quartet of Maddison et al. (1999b), which consists of Cicindelidae, Rhysodidae, Paussidae, and Scaritini. Costs are listed as gap:change. M D Monophyletic, P D Para- or Polyphyletic, U D Unresolved. All characters
Tree score 1 Coleoptera 2 Polyphaga C Adephaga 3 Polyphaga 4 Adephaga 5 Hydradephaga C Trachypachidae 6 Hydradephaga 7 Hydradephaga minus Haliplidae 8 Noteridae C Hygrodiidae C Dytiscidae 9 Hygrodiidae C Dytiscidae 10 Geadephaga (incl. Trachypachydae) 11 Geadephaga minus Trachypachidae 12 CRPS quartet a Gap b c
Excluding all V regions
Excluding central V regions
Excluding central V regions, minus CRPS
1:1a
2:1
1:1
2:1
4:1
1:1
2:1
4:1
1:1
2:1
4:1
6,246 P P
8,339 P P
1,074 M M
1,198 M (M)b
1,376 P P
1,892 M M
2,138 M M
2,579 M M
1,387 M M
1,554 M M
1,840 M M
M P P
M P P
M M M
P (M)b (M)b
P P P
M M P
M M P
M M P
M M P
M M P
M P P
P P
P P
M M
(M)b (M)b
M M
P P
M P
M P
M P
U P
(M)c P
(M)c
P
M
(M)b
M
M
P
M
P
M
P
(M)c
P
P
P
P
M
M
P
M
M
M
P
P
P
P
P
M
M
M
M
M
P
P
P
M
M
P
M
P
P
P
P
P
P
P
P
M
P
P
P
P
n/a
n/a
n/a
cost, listed as gap:change. Monophyletic except for the inclusion of Torridincola. Monophyletic except for the inclusion of Polyphaga.
956
S YSTEMATIC BIOLOGY
VOL. 50
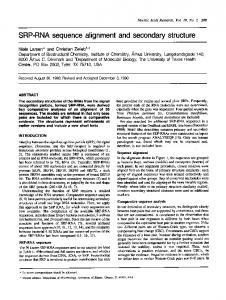
several monophyletic groups, including the monophyly of Coleoptera, Adephaga, Geadephaga, and others (Table 2). Similarly, tree searches on the complete 18S rRNA sequences including the hypervariable V2, V4, and V6 regions, resulted in the loss of monophyly of all major clades, except Polyphaga (“All characters” in Table 2). Such was the case for a wide range of alignment parameters (not shown), but resulted from inclusion of the middle parts of the hypervariable regions only: When the most variable (central) part of these regions were excluded, many of the monophyletic groups were recognizable again (“Excluding central V regions” in Table 2; Fig. 3). Removing the CRPS quartet from the analysis had no major impact on the topology of trees, although the cost of trees was much reduced by omitting these long sequences, and topologies were less affected by the increase of gap costs (“Minus CRPS” in Table 2) Because the monophyly of some clades, including the Coleoptera and Adephaga, FIGURE 2. Most-parsimonious tree obtained from a POY analysis from the conserved regions (regions 1, 3, 5, and 7) with a gap cost and a change cost of one. The cost of the alignment is 1,074. Numbers on branches represent Bremer support values. The circled numbers refer to particularly relevant nodes in Tables 2 and 3. Shading of branches as in Figure 1.
various trees, being basal to Hydradephaga in some but basal to Geadephaga in others. Within Hydradephaga, we found Haliplidae and Gyrinidae basal to the Dytiscidae and Noteridae; the Dytiscidae also included the single representative of the Hygrobiidae. Within Geadephaga, relationships of triballevel taxa largely followed the pattern observed by Maddison et al. (1999b). A group of four major taxa (Cicindelidae, Rhysodidae, Paussidae, and Scaritini), the CRPS quartet of Maddison et al. (1999b), which are unlikely to represent a clade in light of previous taxonomic work, was found near the derived Harpalinae but was not monophyletic. Bremer support values for many of the nodes, including the monophyletic Hydradephaga, were weak, but levels of support generally correlated with the stability to different alignment parameters. We also analyzed the same set of characters under different gap costs and including portions of the V2, V4, and V6 regions (Table 2). The increase in gap cost above gap D 2 generally results in the loss of
FIGURE 3. One of the three most-parsimonious trees obtained from a POY analysis of all regions except the central portion of the hypervariable regions with a gap cost and a change cost of one. The cost of this tree is 2,138 (also see Table 2). Decay index values are listed below relevant nodes, and suprageneric taxa are listed to the right.
2001
957
S HULL ET AL.—HIGHER-LEVEL BEETLE PHYLOGENY
should not be in doubt, the signal of the hypervariable regions must introduce misleading information into the analysis, which was further investigated. First, to test for spurious alignment between distant parts of the sequence that are not homologous, the total sequence was subdivided into 24 segments to constrain which regions of the gene could assume nucleotide homology (see Materials and Methods). POY analysis on this subdivided data matrix resulted in a slightly shorter tree of 8,199 steps (compared with 8,339 steps when the matrix was divided into seven regions only), but this tree topology also failed to recover many of the wellestablished groups (not shown). To determine whether the misleading phylogenetic signal could be attributed to any single one of these three regions, the central regions were added in turn to analyses containing the remaining conserved characters. The inclusion of the central part of V2, but not of the much larger V4 and V6 regions, resulted in the recovery of most of the major clades of Table 2. The effect of V2 may be less severe because the number of characters in this short region are too few to affect the phylogenetic signal present in the conserved regions. The mostparsimonious tree obtained from the analysis that included this central V2 character was 2,854 steps; inclusion of the characters from the central portion of V4 and V6 produced trees of 4,918 and 4,564 steps, respectively. Trees produced from either the central portion of the V4 or V6 were entirely spurious, recovering none of the major clades. In addition, the fact that these trees are not con-
gruent with each other, despite presumably sharing the same phylogenetic history, suggests they do not represent a consistent phylogenetic signal and cannot be used for inferences of relationships of Adephaga. We further tested support for critical nodes and prior hypotheses about relationships in Adephaga by constraining tree searches in POY. Specically, we were interested in the level of support for a monophyletic Hydradephaga and its relationships to other groups, particularly the Geadephaga and Trachypachidae. We also tested support for the “multiple origin” hypothesis of Beutel (1995) that renders the Hydradephaga polyphyletic. The constraints examined are dened in Table 3. Searches required the least additional cost under constraining for a monophyletic Adephaga and for the sister relationship of Geadephaga (including Trachypachidae) and Hydradephaga [(GT)HA scenario in Table 3]. Constraints that force Trachypachidae or even the remaining Geadephaga with the “higher” aquatic families, as in Beutel’s (1995) hypothesis, clearly required higher alignment costs. Moreover, the greatest gap cost (gap:change D 4:1) was the least compatible with any of the constraint scenarios, but the relative increase in cost and hence in the extent of conict indicated tendencies similar to those under the lower, preferred gap costs. Finally, these searches also indicated the value of the V regions (excluding the central portion), which greatly enhanced the discriminatory power of these analyses, as evident from the larger number of extra steps in the unfavored scenarios.
TABLE 3. Searches for tree alignments under different constraints. The cost of the alignments under the following constraints are tabulated, given the gap costs indicated, with and without the V regions (central portions excluded) A: Adephaga monophyletic; (GT)HA: Geadephaga (incuding Trachypachidae) monophyletic, Hydradephaga monophyletic, and Adephaga monophyletic, (HT)GA: HydradephagaC Trachypachidae monophyletic, Geadephaga (excluding Trachypachidae) monophyletic, and Adephaga monophyletic; TD: Trachypachidae C Dytiscidae C Hygrobiidae C Noteridae monophyletic, to the exclusion of all other taxa, including Gyrinide and Haliplidae; Beutel: matching most of the family-level relationships of Beutel (1992), with (Gyrinidae (Haliplidae (Geadephaga excluding Trachypachidae), (Trachypachidae (Noteridae (Hygrobiidae, Dytiscidae))))); PH: Polyphaga C Hydradephaga monophyletic. Gap: change cost
Excl V regions Incl partial V regions
1:1 2:1 4:1 1:1 2:1 4:1
Minimum cost in unconstrained POY search
1,074 1,198 1,376 1,892 2,138 2,579
A
(GT)HA
(HT)GA
TD
Beutel
PH
Increase in parsimony tree length in constrained search 0 2 3 5 4 4 ¡1 0 0 4 4 3 12 12 11 17 20 18 2 ¡1 12 9 13 0 4 0 9 15 13 14 0 0 9 12 15 2
958
S YSTEMATIC BIOLOGY
Analyses with Alignment and Tree Inference Separated In the analysis of Clustal-aligned matrices, most-parsimonious trees for each of the 10 alignments that excluded gap runs of ve or more were found on one to four islands (Maddison, 1991), each island being found between 47 and 578 times. The strict consensus of these is shown in Figure 4. For all matrices the trees showed Adephaga to be monophyletic, and Hydradephaga was monophyletic in all but one of the matrices (that with a 3:2 gap opening:gap extension cost). For six of the alignments, Geadephaga, including Trachypachidae, was monophyletic; in none of the alignments were trachypachids sister to part or all of Dytiscoidea, as has been proposed by several authors (Bell, 1966; Hammond, 1979; Ward, 1979; Roughley, 1981). Details of the mono-
FIGURE 4. Strict consensus tree of the mostparsimonious trees for the four alignments based on a gap opening:gap extension costs of 2:1, 5:1, 7:2, and 10:5, with characters participating in gap runs of ve or more excluded. This is almost the strict consensus tree for the trees of greatest likelihood for those four alignments under the constraint that Adephaga is monophyletic; the only difference is that the likelihood consensus tree does not have relationships within Noteridae resolved (that is, the branch marked with an asterisk is absent). Numbers above a branch indicate the range in Bremer support values for the clade over these four alignments. The rst number below the clade is the lowest bootstrap value for that clade over the four alignments, the second number below the clade is the lowest jackknife value.
VOL. 50
phyly or paraphyly of various taxa are shown for the four primary Clustal alignments in Table 4. The 22 most-parsimonious trees for the “by eye” alignment were present in one island found 4,999 times. These trees showed a monophyletic Hydradephaga, with Polyphaga as its sister. If all characters (including the highly length-variable regions) are included in the analysis, the most-parsimonious trees for all 10 Clustal alignments show Adephaga as paraphyletic; in all but the 20:5 alignment, the two neuropterans, Anisochrysa and Oliarces, both move within beetles, as sister to various geadephagan groups; in the 20:5 alignment the myxophagan Torridincola is within Carabidae. In total, only one to three of the focal groups are monophyletic, broadly conrming the results from the POY analysis that revealed high inconsistency of the alignment-variable regions with the other data. Maximum likelihood analyses on these Clustal-generated alignments generally resulted in trees that showed many of the features observed in the parsimony reconstructions, as shown for the 5:1 alignment in Figure 5. The heuristic searches for trees of high likelihood revealed multiple SPR peaks. For example, the trees for the 2:1 alignment formed four peaks in the likelihood treescape. One suboptimal peak (–ln L D 11531.325) showed Adephaga, Hydradephaga, and Geadephaga to be monophyletic, with Trachypachidae as sister to the rest of Geadephaga; another suboptimal peak (–ln L D 11531.228) showed Polyphaga as the sister to a monophyletic Hydradephaga, and these two as sister to a monophyletic Geadephaga; the optimal peak (–ln L D 11531.215)showed Polyphaga as sister to a monophyletic Hydradephaga, and Geadephaga was paraphyletic, with Trachypachidae as sister to Polyphaga C Hydradephaga. That these trees of such different shape differ by no more than 0.11 –ln L units is surprising, and speaks to relatively weak support for basal relationships of Adephaga with these alignments. We further used these alignments in constrained parsimony and maximum likelihood analyses to examine the consequences of various alternative proposals of adephagan relationships. The constraints examined are the same as those discussed in the tree
959
a
M P U U M
M P M M P
5:1
1,924 M M M M U M P P
1,785 M M M M P M U P
7:2
M P U M U
2,268 M M M M U M U P
10:5
M P P P U
2,349 M P M M P M P M
2:1
M P P P P
4,741 P P M P P M M P
Gap costs, indicating the ratio of gap opening cost:gap extension cost values used in the Clustal alignment.
Tree score 1 Coleoptera 2 Polyphaga C Adephaga 3 Polyphaga 4 Adephaga 5 Hydradephaga C Trachypachidae 6 Hydradephaga 7 Hydradephaga minus Haliplidae 8 Noteridae C Hygrobiidae C Dytiscidae 9 Hygrobiidae C Dytiscidae 10 Dytiscidae 11 Geadephaga 12 Geadephaga minus Trachypachidae 13 CRPS quartet
2:1a
Most-parsimonious trees excluding gap runs ¸5
M P P P P
5,561 P P P P P M P P
5:1
M P P P P
5,981 P P M P P P P P
7:2
Most-parsimoniouis trees including all characters 10:5
M P P P U
6,301 P P M P P P P P
2:1
M P P P P
11,531 M M M P P M P P
M P M P P
12,049 M M M M P M P P
5:1
M P P P P
13,337 M M M P P M P P
7:2
Maximum likelihood trees excluding gap runs ¸5
M P P P P
13,688 M M M P P P P M
10:5
TABLE 4. Summary of monophyletic groups for the standard parsimony and maximum likelihood analyses. Tree score is tree length for the parsimony analyses and -ln likelihood for the likelihood analyses. M, monophyletic; P, paraphyletic; U, unresolved. In the maximum likelihood analyses the estimated percentage of characters that are not free to vary ranged between 0.49 and 0.53, and the gamma shape parameter varied from 0.43 to 0.47. The values for the General Time Reversible rate matrix are (in PAUP notation): 2:1 alignment, (1.906 5.1865839 2.589 0.44280579 10.217); 5:1 alignment, (1.852 4.208 2.449 0.6309 8.538); 7:2 alignment, (1.273 3.0786951 1.875 0.0627 6.387); 10:5 alignment, (1.171 2.730 1.854 0.558 5.406).
960
S YSTEMATIC BIOLOGY
VOL. 50
FIGURE 5. Maximum likelihood tree for the 5:1 alignment, with characters participating in gap runs of ve or more excluded.
alignment section, above, and as outlined in Table 3. Consistent with the tree alignment results, these analyses (Table 5) generally support a monophyletic Adephaga and the sister relationship of Geadephaga (including Trachypachidae) and Hydradephaga [the (GT)HA scenario in Table 5], under a wide range of alignment conditions. Hypotheses forcing the Trachypachidae or the remaining Geadephaga with the Dytiscoidea
(Beutel, 1995) are less favored under both parsimony and ML methods. With the neuropteroid outgroups removed, Hydradephaga is monophyletic in most analyses (Table 6). In a few of these analyses, Hydradephaga is not monophyletic because it includes Polyphaga. If Adephaga is constrained to be monophyletic, Hydradephaga is monophyletic in every analysis except the likelihood analysis for the “by eye”
2001
961
S HULL ET AL.—HIGHER-LEVEL BEETLE PHYLOGENY
TABLE 5. Comparisons of trees under different constraints. The third and later columns indicate the increase in parsimony tree length or the increase in -ln likelihood for trees with constraints on their shape. Constraints are as dened in Table 3; in addition, TDB denes a backbone constraint in which Trachypachidae C Dytiscidae C Hygrobiidae C Noteridae is monophyletic, with Gyrinidae and Haliplidae removed from the constraint trees (thus, their position in the tree is entirely unconstrained). Alignment
Unconstrained
Parsimony analysis 2:1 5:1 7:2 10:5 “By eye” ML analysis 2:1 5:1 7:2 10:5 “By eye”
1,785 1,924 2,268 2,349 1,254
A
(GT)HA
0 0 0 0 3
11,531.21512 12,048.73719 13,337.25132 13,687.52626 9,149.09903
TDB
TD
Beutel
Increase in parsimony tree length 1 1 9 0 0 6 3 3 8 3 1 8 6 6 9
0 0 0 1 3
0.11 0 6.15 8.93 10.62
(HT)GA
Increase in-ln likelihood 9.18 9.06 18.60 10.07 10.07 19.80 14.43 12.94 20.84 13.17 10.55 27.47 21.25 18.25 30.24
0.11 0 6.15 8.93 11.13
matrix (Table 6). If only Adephaga is included in the analysis, then Hydradephaga is always separated fully from Geadephaga, with no mixing. Monophyly of Hydradephaga, consistent with the results from POY, is thus one of the most notable results of these analyses, although support for this result is not strong (Table 7). The decay indices are low (1, 1, 2, 3, and 1 for the 2:1, 5:1, 7:2, 10:5, and “by eye” analyses, respectively), the parsimony bootstrap values are low (51, 47, 43, 42, and 33, respectively), and the jackknife values are moderate (64, 61, 60, 59, and 42). However, the parametric bootstrapping tests rejected nonmonophyly of Hydradephaga for all ve alignments (Table 7). This may seem counterintuitive, given the low values of decay indices, but the simulation studies indicate that even values of only 1–3 for Hydrade-
PH
17 14 18 15 14
2 4 3 5 0
37.25 37.62 49.09 43.49 45.72
0 0.05 0 0 0
phaga are unlikely if Hydradephaga is not monophyletic. Under most alignment parameters Hydradephaga shows a strong afnity with Polyphaga, particularly in the “by eye” alignment and under maximum likelihood optimizations, which renders Hydradephaga paraphyletic in some cases. This is unexpected, and could be in part a spurious result of the GC bias they both share (Fig. 6). Because the method is robust to base composition bias, we used a minimum evolution method with LogDet distances to test for the effect of GC bias. For all ve matrices, optimal LogDet minimum evolution trees (found in at least 13 of 50 replicates) showed a monophyletic Adephaga, Hydradephaga, and Geadephaga (including Trachypachidae), suggesting that the monophyly of these groups was not a result of articial grouping
TABLE 6. Status of Hydradephaga in optimal trees from various analyses for ve alignments. All optimal trees showed either monophyletic Hydradephaga (H), Hydradephaga paraphyletic containing Polyphaga (HP), or Hydradephaga paraphyletic containing monophyletic Geadephaga (HG). No optimal trees showed Trachypachidae C Dytiscoidea monophyletic. Taxa included
All taxa Coleoptera Adephaga
Adephaga constrained to be monophyletic
No constraints Analysis
Parsimony MLE LogDet Parsimony MLE LogDet Parsimony MLE LogDet
2:1
H H H H,HP HP H H H H
5:1
7:2
10:5
“By eye”
2:1
5:1
7:2
10:5
“By eye”
H H H H,HP HP H H H H
H H H H H H H H H
H HP H H H H H H H
H HP H H HP H H H H
H H H H H H — — —
H H H H H H — — —
H H H H H H — — —
H H H H H H — — —
H,HG HG H H HG H — — —
962
VOL. 50
S YSTEMATIC BIOLOGY
TABLE 7. Support for monophyly of Hydradephaga for ve alignments under different analyses. The rst two rows give the bootstrap and decay values for Hydradephaga with parsimony. PB test shows the P-value from the parametric bootstrapping test, that is, the probability, estimated by repeatedly simulating data on a tree with Hydradephaga not monophyletic, of having observed a value for (length of shortest tree with Hydradephaga not monophyletic—length of shortest unconstrained tree) as extreme as that empirically observed. MLE decay indicates the likelihood decay index, that is, the difference in ¡ln likelihood between the maximum likelihood tree with Hydradephaga not monophyletic and that with Hydradephaga monophyletic; a negative value indicates that trees of greatest likelihood have Hydradephaga not monophyletic. LogDet bootstrap is the nonparametric bootstrap value for Hydradephaga in the LogDet analysis.
Parsimony bootstrap Parsimony decay PB test MLE decay LogDet bootstrap
2:1
5:1
7:2
10:5
51 1 0.038 1.51 83
47 1 0.014 2.16 70
43 2 0.018 0.54 76
42 3