Oct 26, 1995 - ture: a practical approach (Creighton, T., ed.) 2nd edn, pp. ... NMR 5, 67-81. Wlodawer, A,, Miller, M., Jaskolski, M., Sathyanarayana, B. K., Bal-.
Eur. J. Biochem. 237, 383-392 (1996) 0FEBS 1996
Sequence-specific resonance assignments of the ‘H-NMR spectra and structural characterization in solution of the HIV-1 transframe protein p6* Martina BEISSINGER’, Christina PAULUS’, Peter BAYER’, Hans WOLF’, Paul ROSCH’ and Ralf WAGNER’
’
Lehrstuhl fur Biopolymere, Universitat Bayreuth, Germany Institut fur Medizinische Mikrobiologie und Hygiene, Universitat Regensburg, Germany
(Received 26 October 1995/26 January 1996) - EJB 95 1754/3
The frameshift protein p6* encoded directly upstream of the protease in the human immunodeficiency virus type 1 (HIV-1) pol reading frame is thought to be a natural inhibitor of protease activation and to play a role in the polyprotein processing of Gag and Gag-Pol precursors. To allow structural characterization of the p6* transframe protein, the p6* coding region was cloned into the vector pGEX-KG and expressed in Escherichiu coli as a fusion protein with glutathione S-transferase (GST) under the control of the tuc promoter. Thrombin cleavage of the construct resulted in a 70-amino-acid polypeptide which is extended by two additional residues at the N-terminus compared to the natural p6* sequence. The native purification procedure including an affinity and a size-exclusion chromatography step yielded sufficient amounts of highly pure protein suitable for NMR spectroscopy. Fluorescence, circular dichroism and ‘H-NMR spectroscopy were applied to characterize the structure of the protein. Two-dimensional NMR spectra provided essentially complete sequence-specific resonance assignments at pH 5.9. Although there is evidence for a helix-forming tendency in the N-terminus of the protein, the experiments indicate that p6* has no overall stable secondary or tertiary structure with the single tryptophan exposed in aqueous solution. However, the results reported herein open the way to characterize further the interaction of p6* with the HIV-1 protease in structural and functional in vitro studies. K e y w o r d s : ‘H-NMR; human immunodeficiency virus 1; protease regulation ; protein purification ;
transframe protein p6*.
Retroviruses encode their structural proteins and enzymes as two polyprotein precursors Gag and Gag-Pol (Vaishnav and Wong-Staal, 1991). The pol region codes for the viral protease, reverse transcriptase and integrase, whereas the gag region encloses the matrix, capsid and nucleocapsid proteins in addition to three smaller polypeptides named p l , p2 and p6. The 160kDa readthrough-translation product Gag-Pol is generated by a rare frame shift event at the nucleocapsid-pl junction (Jacks et al., 1988). A 68-amino-acid polypeptide called p6* replaces the C-terminal Gag proteins p l and p6 in the transframe region of HIV-1 Gag-Pol directly N-terminal to the HIV-1 protease. The protease is essential in the retroviral life cycle as it is responsible for the correct post-translational processing of the polyprotein precursors in order to produce infectious virus particles (Kohl et al., 1988; Gottlinger et al., 1989). Therefore, in addition to the reverse transcriptase, HIV protease is one of the main targets in attempts to design antiviral drugs for AIDS therapy. The HIV proteases belong to the family of the aspartate proteases characCorrespondence to M. Beiflinger, Lehrstuhl fur Biopolymere, Universitat Bayreuth, D-95440 Bayreuth, Germany Fax: +49 921 55 3544. Abbreviafions. COSY, correlated spectroscopy ; GST, glutathione Stransferase ; HIV, human immunodeficiency virus ; NOESY, nuclear Overhauser enhancement spectroscopy; TOCSY, total correlated spectrosCOPY. Enzymes. Glutathione S-transferase (EC 2.5.1.18); thrombin (EC 3.4.21.5). Nore. The first two named authors contributed equally to this work.
terized by a conserved D-T-G motif in the active-site loop (Toh et al., 1985; Katoh et al., 1987). Unlike the homologous mammalian aspartate proteases such as pepsin, where the two halfsites of the active-site region are encoded by two domains of a single-chain protein, the retroviral proteases consist of two identical subunits which have to associate for the protease to become active (Wlodawer et al., 1989). In accordance with the structural features, two classes of substances were successful in protease inhibition : substrate analogues directed against the active site and dimerization inhibitors (Wlodawer and Erickson, 1993). The activation of the HIV protease, i.e. the dimerization and autocatalytic processing out of the polyprotein precursor, is a critical step in the maturation of the virus particles. Prior to budding, Gag and Gag-Pol polyproteins assemble at the cytoplasmic membrane. Premature processing by a HIV protease activated too early prevents packing of the cleavage products into the virions, whereas inhibition of the protease results in immature and non-infectious particles (Facke et al., 1993; Gottlinger et al., 1989; Kaplan et al., 1993; Kohl et al., 1988; Krausslich, 1991; McQuade et al., 1990; Meek et al., 1990). There is evidence from in vitro transcription-translation assays that the frame shift protein p6* inhibits the processing activity of the HIV protease by blocking the active site in a manner similar to the pepsinogen N-terminal prosegment (James and Sielecki, 1986; Partin et al., 1991 ; Zybarth and Carter, 1995). On the other hand, the C-terminal hexapeptide of p6* was reported to inhibit the protease by preventing its dimerization with even larger affinity than the respective C-terminal peptide of the protease itself, which to-
3 84
Beissinger et al. (EUKJ. Biochern. 237)
gether with the N-termini forms a four-stranded antiparallel psheet (BabC et al., 1992; Schramm et al., 1993; Weber, 1990). As the role of p6* in regulating the HIV protease is far from clear, obtaining more information on the p6* structure might help to elucidate the function of this highly conserved domain during HIV morphogenesis. Here, we describe a cloning and purification strategy that yields milligram amounts of highly pure p6* protein allowing structural investigation of p6* by twodimensional NMR techniques. MATERIALS AND METHODS Materials. The K12-derived Escherichia coli strain DH5u [supE44 dlncU169 (480 lacZdM15) hsdRlrecA1 endA1 gyrA96 thi-1 relAl].(Hanahan, 1983) was used for plasmid construction. E. coli strain M15[pREP4] [lac aru gul mtl] (Villarejo and Zabin, 1974) from Qiagen (Germany) was employed as host for the expression of the glutathione-S-transferase-p6* (GSTp6*) fusion protein. Cells were grown under vigorous aeration at 37°C in Luria-Bertani medium (Sambrook et al., 1989) with appropriate antibiotics added. Ampicillin and kanamycin were used at concentrations of 100 mg/l and 25 mg/l, respectively. Plasmid pBH102 (Ratner et al., 1987) served as a template in PCR amplification of the p6* coding sequence. E. coli expression vector pGEX-KG (Gum and Dixon, 1991) was kindly provided by Dr T. Dobner (Universitat Regensburg, Germany). PCR oligonucleotides were synthesized on Millipore’s Expedite nucleic acid synthesis system, removed from the cartridge and purified using NAP-25 columns (Pharmacia) according to the manufacturer’s instructions. Sequencing primers were purchased from Pharmacia. Restriction endonucleases, Taq DNA polymerase, T4 DNA ligase and deoxynucleoside triphosphates were from Boehringer Mannheim. Isopropyl P-D-thiogalactopyranoside,glutathioneSepharose 4B, thrombin and Superdex 30 column were obtained from Pharmacia. Other chemicals were commercial reagents of analytical grade. Construction of the expression plasmid pGEX-KG-p6*. For the construction of the bacterial GSTp6* expression vector pGEX-KG-p6* outlined in Fig. 1, standard procedures (Sambrook et al., 1989) were used. The DNA fragment encoding the p6* domain of HIV-1 BHIO was generated by PCR (Saiki et al., 1988). The oligonucleotides RF60 (5’-CAGTACGGATCCTTTTTTAGGGAAGATCTGGCC-3’) and RJ121 (5’TGACAAGAATTCTTAGAAGTTAAAGCATACAGTTCCTTGTCTATCG-3’) were used as primers along with plasmid pBH102 as template. The 231-bp PCR product resulting from amplification with these primers contains a 5’-recognition site for BarnHI, a 3’-site for EcoRI, and a stop codon at the 3’-end of the p6* coding sequence introduced by the RJ121 primer. PCR was performed in a total volume of 50 1.11 containing 20 ng pBH102, 6 pmol of each primer, 8 mM deoxynucleoside triphosphates, 1 U Taq DNA polymerase and 5 p1 1OX buffer B (100 mM Tris/HCl, 15 mM MgCl,, 500 mM KC1, pH 8.3). The sample was subjected to 30 cycles of denaturation at 94°C for 30 s, annealing at 55°C for 30 s and polymerization at 72°C for 1 min in a GeneAmp PCR System 9600 (Perkin Elmer). Following a twofold phenol/chloroform extraction, the PCR-generated fragment was ethanol-precipitated and digested with BurnHI and EtztRI prior to Iigation with expression vector pGEX-KC cut with the same enzymes. DNA fragments were gel-purified by the Qiaex I1 procedure (Qiagen) prior to the transformation of E. coli DHSu. The desired clones were identified after analyzing small plasmid preparations by restriction with BglZUEcoRI.
Fig. 1. Schematic representation of the procaryotic expression plasmid pGEX-KG-p6*. Amp, ampicillin-resistance gene; GST, glutathione S-transferase; lacI, repressor gene of the lac operon, its constitutive expression allowing the use of any E. coli host; pBR322 ori, pBR322derived origin of DNA replication ; Ptac, regulatable trp/lac hybrid promotedoperator element, transcription from this promoter can be induced by isopropyl p-D-thiogalactopyranoside.
The nucleotide sequence of the insert was confirmed by the dideoxynucleotide chain-termination method (Sanger et al., 1977) using an automated laser fluorescent DNA sequencer (model 373A, Applied Biosystems). Protein expression and purification. A single colony of the expression strain E. coli M15 [pREP4] transformed with pGEXKG-p6#’ was grown overnight in the presence of ampicillin and kanamycin. The culture was diluted 1 :10 in fresh warmed medium and further grown for 1 h. Gene expression was induced by the addition of isopropyl P-D-thiogalactopyranoside to a final concentration of 1 mM. After 5 h at 3 7 T , cells were harvested by low-speed centrifugation. The cell pellet was resuspended in 0.1 vol. buffer A (20 mM Tris/HCl pH 8.0, 100 mM NaCI, 1 mM EDTA, 0.5% mass/vol. Nonidet P-40, 1 mM phenylmethanesulfonyl fluoride). After a freeze-thaw cycle, bacteria were lysed by sonification (2X2.5 min, 75 W) and centrifuged for 30 min at 27000Xg. The supernatant containing the glutathione-S-transferase -p6* fusion protein was incubated with the affinity matrix glutathioneSepharose 4B in a batch procedure for 30 min at room temperature. The glutathione- Sepharose matrix was equilibrated with a tenfold volume of buffer A containing 0.5% (mass/vol.) powdered milk and then washed with buffer A prior to use. The glutathione- Sepharose beads together with the fusion protein were collected by low-speed centrifugation and washed once with a large volume of buffer A to remove protein not adsorbed to the affinity matrix, and twice with NaClP, (10 mM sodium phosphate, 1.76 mM potassium phosphate, 137 mM NaC1, 2.7 mM KC1, pH 8.0) to exchange for a buffer system appropriate for thrombin cleavage. To elute p6“ from the affinity matrix, the thrombin digestion was performed for 120 niin at room temperature according to the supplier’s instructions. The affinity matrix with the bound glutathione S-transferase protein was then pelleted by centrifugation and the supernatant containing the p6” protein was rapidly titrated to pH 5.9 with a small volume of high salt buffer (1 M sodium phosphate pH 5.9) prior to application to size-exclusion chromatography with a Superdex 30 column equilibrated with 20 mM sodium phosphate pH 5.9 at 4°C. Fractions containing p6“ were pooled and concentrated with a
385
Beissinger et al. (Eul: J. Biochem. 237) 1
h8
P6 *
QTRANS PTIS QTRANS PTIS QTRANSPTIS QTRANSPTIS QTRANSPTIS
POL-HV1B1 POL-HV1 B5 POL-HV1 PV POL-HVlBR POL-HVlA2 POL-HV1 H2 POL-HVlOY POL-HVlC4 POL-HV1 N5 POL-HV1 J3 POL-HV1 Y2 POL-HV122 POL-HVlND POL-HVlEL POL-HV1 MA POL-HVlRH POL-HV1 JR POL-HVlMN POL-HV1 U4
. . . . . . . . .s .........s . . . . . . . . .s . . . . . . . . .s . . . . . . . . .s ......... s .........s .........s ......... S ......... s ......... ......... s . . . . . . . . .I .........s .........s
consensus 1
I I I-
consensus 2
consensus 3
+ Start of corresponding p6 sequence
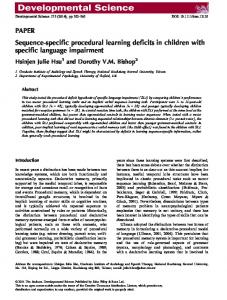
Fig. 2. Alignment of p6* sequences from different HIV-1 isolates. Simultaneous alignment of various p6* sequences with the construct described in this paper using the standard protocol of the FASTA program package (Pearson and Lipman, 1988). The boxes in black show identical amino acids, the gray boxes indicate functionally conserved residues according to the Dayhoff classification (Dayhoff et al., 1972), and the white boxes mark nonconserved positions. The sequences were taken from the SwissProt data bank.
flow cell (Amicon). Concentration to the millimolar range, necessary for NMR spectroscopy, was achieved in a vacuum concentrator without freezing the sample. The purification steps were monitored by SDS/PAGE followed by Coomassie staining of the protein bands (Laemmli, 1970) or by Western blot analysis with a polyclonal rabbit antiserum raised against partially purified p6* (to be published elsewhere). Absorption, fluorescence and CD spectroscopy. Absorption spectra were recorded with a Varian Cary 13 spectrophotometer at a protein concentration of 0.86 mM in 70 mM sodium phosphate pH 5.9 at a scan speed of 100 n d m i n and a bandwidth of 2 nm in quartz cells with 1-mm path length. Fluorescence spectra were measured in 1-ml quartz cells after excitation at 3, = 280 nm and with 0.5-mm excitation and I-mm emission slit widths at a scan speed of 100 nndmin employing a Spex Fluoromax spectrofluorimeter. The protein concentration was 2.6 pM in a buffer of 20 mM sodium phosphate pH 5.9. CD spectra were measured on a Jasco J 600A spectropolarimeter in the wavelength range 250- 185 nm with a spectral resolution of 0.2 nm in a thermostated quartz cell of 0.5-mm path length with a time constant of 2 s and a scan speed of 20 nm/min (spectra were 4 or 8 times accumulated and averaged to increase the signahoise ratio). The spectra were taken at protein concentrations of 35 pM in 90 mM or 22 pM in 20 mM sodium phosphate pH 5.9. All spectra were corrected for the buffer signal. The protein concentration was calculated with a molar absorption coefficient of E,, = 5690 M-'cm-' according to Gill and von Hippel (1989). CD spectra were analyzed in terms of fractional conformational populations with the program SELCON by the self-consistent method of Sreerama and Woody (1993) using the Kabsch and Sander (1983) protein crystal structure analysis for the basis data set. NMR spectroscopy. All NMR experiments were performed on a commercial Bruker AMX 600 spectrometer with a proton resonance frequency of 600 MHz. The spectra of p6* were recorded at 283 K and 298 K at a protein concentration of 1.14 mM in a H,O/D,O (9:1, by vol.) solution with 90mM sodium phosphate pH 5.9; 10% D,O was added to provide a spinlock signal. Sequence-specific assignments of the resonances were derived from two-dimensional double-quantum-filtered
correlation spectroscopy (DQF-COSY; Rance et al., 1983), total correlation spectroscopy with suppression of NOESY-type cross peaks (clean-TOCSY; Griessinger et al., 1988) and nuclear Overhauser enhancement spectroscopy (NOESY ; Bodenhausen et al., 1984). Spectra were acquired in the phase-sensitive mode with quadrature detection in both dimensions using the timeproportional phase incrementation technique (Marion and Wuthrich, 1983). Solvent suppression was performed by continuous coherent irradiation prior to the first excitation pulse and during the mixing time in the NOESY experiment. The sweep width in both dimensions was 6666.7 Hz for all spectra; 4 K data points were acquired in o2and 5 12 data points in w , . The latter were zero filled to 1 K before Fourier transformation. A squared sinebell filter function with a phase shift of n/4 or n/2 was applied as a window function for data processing. Mixing times were 80 ms for the TOCSY and 100 ms and 200 ms for the NOESY experiments. Data were evaluated on X-window workstations with the NDee program package (Franz Hermann, unpublished). Chemical shift values are reported (in ppm) using 2,2-dimethyl-2-silapentanesulfonic acid as a reference.
RESULTS AND DISCUSSION Alignment of p6* and the corresponding p6 sequences. The p6 protein whose reading frame overlaps almost completely with that of p6* has been previously shown to have no defined structure as an isolated polypeptide (Stys et al., 1993). However, there is strong evidence for a biological function for both HIV proteins, even though the description concerning p6" is far from complete (Gottlinger et al., 1991; Kondo et al., 1995; Partin et al., 1991; Schramm et al., 1993; Zybarth and Carter, 1995). Considering the efficient genome organization of retroviruses, a 70-residue domain with no ascribed function would appear very unlikely. As the two proteins cannot evolve independently, but mutations at the nucleotide level do not necessarily result in amino acid substitutions in both proteins because of the -1 frame shift, we compared the degree of conservation of both proteins. Alignment of the respective HIV-1 Gag and Pol sequences with the FASTA program package (Pearson and Lip-
386
Beissinger et al. (EUKJ. Biochern. 237)
GAG-HV1 B 1 GAG-HV1 B 5 GAG-HV1 PV GAG-HVlBR GAG-HVlA2 GAG-HVlH2 GAG-HVlOY GAG-HVlC4 GAG-HVlN5 GAG-HVlJ3 GAG-HVlY2 GAG-HVlZ2 GAG-HVlND GAG-HVlEL GAG-HVlMA GAG-HVlRH GIiG-HVl JR GAG-HV 1MN GAG-HVlU4
1 LQSRPEPTAP LQSRPEPTAP LQSRPEPTAP LQSRPEPTAP
VETTTPP... VETTTPP... VETTTPP. .. VETTTPS . . . WEINTTPS... VETTTPP.. . ETTTPP.. . ETTTPS. .. ETTTPS. .. ETTTPS. . . ETTTPS.. . EITPS. ... EITPS.. . . EITPS.. . . EIWPS. ... ETTPS. ...
.......... .......... .......... .......... .......... .......... .......... .......... .......... .......... .......... .......... .......... . . . . . . . .m ..........
I1
consensus 1
I consensus 3
consensus 2 C-terminus of corresponding p6* sequence
-'
Fig. 3. Alignment of p6 sequences from different HIV-1 isolates. Simultaneous alignment of various p6* sequences using the standard protocol of the FASTA program package (Pearson and Lipman, 1988). The boxes in black show identical amino acids, the grey boxes indicate functionally conserved residues according to the Dayhoff classification (Dayhoff et al., 1972), and the white boxes mark nonconserved positions. The sequences were taken from the SwissProt data bank.
man, 1988) resulted in 32% overall identity for p6* and 34% for p6 (with respect to the 68-amino-acid sequences containing a duplication of 11 residues). The value increases to 51% for both proteins, if functionally similar substitutions according to the Dayhoff classification are included (Dayhoff et al., 1972). Thus, no difference is observed in the conservation of one protein with respect to the other, which could have been indicative of the greater importance of one of the proteins for the virus. Three regions are highly conserved in p6 and p6* proteins, respectively (Fig. 2 and 3). The region directly C-terminal to the 11-residue duplication observed in the closely related HIV-1 isolates BHlO (POL-HVIBl), BH5 (POL-HVlBS), PV2 2 (POL-HVlPV) and BRU (POL-HVlBR) is common to both polypeptides as is the next conserved region, whereas the third region at the C-terminus of p6 and the N-terminus of p6* is unique to each protein, arguing for independent selection pressure on these parts of the two proteins. The conserved C-terminal region of p6, which overlaps with the coding region for the viral protease, was shown to be responsible for the incorporation of viral protein R into viral particles (Kondo et al., 1995). The N-terminus of p6* overlaps with pl in the gag reading frame, a small polypeptide between the nucleocapsid and the p6 protein, with no function ascribed so far.
Cloning, expression and purification of p6*. In order to produce enough protein for NMR analysis, we tested several bacterial vector systems for the highest yield of p6* gene product. Our efforts to express the small 68-amino-acid polypeptide by a system based on T7 RNA polymerase were unsuccessful. No protein of the appropriate mass (7.8 m a ) was detected upon induction (not shown). We therefore chose to produce p6* as a more stable glutathione S-transferase fusion protein. For this purpose a 231-bp DNA fragment containing the p6* coding sequence of the HIV-1 BHlO isolate followed by an additional TTA stop codon was generated by PCR. The fragment was subcloned into the bacterial expression plasmid pGEX-KG, yielding pGEX-KG-p6* (Fig. I), which was then transformed into E. coli M15[pREP4] cells. As there was no activity test available for the p6* protein, a purification protocol had to be developed allowing the preparation of p6* under native conditions. Because the sample should
Fig. 4. SDS/polyacrylamide gel (15 %) showing the cellular fractionation and affinity chromatography of the glutathione-S-transferasep6* fusion protein. The positions of the molecular mass standards and the references for the GSTp6* construct and GST alone are indicated in the margins. Total cellular extract (lane I), soluble (lane 2) and insoluble (lane 3) part of the lysate. Affinity matrix with bound fusion protein (lane 4), fraction not binding to glutathione-Sepharose (lane 5).
Fig. 5. Thrombin cleavage of the glutathione-S-transferase-p6*fusion protein. SDS/polyacrylamide gel (17.5 %) showing the affinity matrix loaded with soluble cell extract (lane 1) and the cleavage products after a thrombin digestion of 2 h (lane 2). The positions of p6*, GST and GSTp6" are indicated in the margin.
be suitable for NMR spectroscopy, we required a protein concentration in the millimolar range, and had to avoid high final salt concentrations and additives which give strong proton signals. After induction the cell pellet was resuspended in buffer A, which was derived from the procedure of Kaelin et al. (1991) with slight modification. After sonification, the glutathione-Stransferase-p6* fusion protein was quantitatively found in the supernatant indicating that the protein is soluble (Fig. 4, lanes 2 and 3). The fusion protein was almost quantitatively bound to
387
Beissinger et al. (Eur J. Biochern. 237) 07 06
-- A -
02 01
-
240 260 280 300 320 340
wavelength (nm)
300 325 350 375 400 425 450
190 200 210 220 230 240 250
wavelength (nm)
wavelength (nm)
Fig. 6. Spectroscopic characterization of p6*. (A) Absorption spectrum of p6* (0.86 mM) in 70 mM sodium phosphate pH 5.9. (B) Fluorescence emission spectrum (excitation at 280 nm) in 20 mM sodium phosphate pH 5.9 with a protein concentration of 2.6 pM. (C) Far-ultraviolet CD spectrum of p6* (35 pM) in 90 mM sodium phosphate pH 5.9.
the affinity matrix glutathione- Sepharose 4B, whereas most other proteins remained in the supernatant after centrifugation of the matrix (Fig. 4, lanes 4 and 5). The p6* protein was removed from the glutathione- Sepharose by a thrombin cleavage, with glutathione S-transferase remaining bound to the matrix (Fig. 5, lanes 1 and 2). The proteolysis was essentially complete (lane 2) after digestion for 2 h at room temperature with NaCI/ P, pH 8.0 in accordance with the pH optimum of thrombin. As it is desirable to have the protein at slightly acidic conditions for NMR spectroscopy, the sample had to be titrated. This critical step, including a titration of p6* over the calculated isoelectric point of 6.8, was performed rapidly, under vigorous stirring to avoid aggregation of the protein. Usage of a well buffered titration solution kept the sample volume small, which was important for obtaining a high resolution in the successive sizeexclusion chromatography. After the chromatography step, no contaminants were seen on SDS gels, but as the p6* protein stains very poorly, it was in addition detected by a polyclonal rabbit antiserum raised against the partially purified protein (data not shown). As dialysis resulted in a strong loss of protein, the fractions containing the p6* were concentrated to a volume around 2 ml with a flow cell and further reduced to 500 pl in a vacuum concentrator. The calculated molecular mass for p6* of 7818 Da was confirmed by matrix-assisted laser desorption and ionisation spectroscopy (data not shown). With the described purification procedure it was possible to obtain the amount of p6* necessary for NMR spectroscopy (around 5 mg) from 10 1 culture medium.
Spectroscopic characterization. The absorption spectrum of p6* is dominated by the tryptophan absorbance with a maximum at 280 nm (Fig. 6A). Due to the high phenylalanine content (6 Phe, 1 Trp), additional bands are visible in the spectrum around 260 nm. The flat baseline in the region 320-350 nm discloses that there is no light scattering in the sample. The protein concentration for all experiments was calculated from the absorbance at 280 nm according to Gill and von Hippel (1989). The fluorescence spectrum shows an emission maximum at 354 nm (excitation at 280 nm) which corresponds to that of tryptophan in aqueous solution (Schmid, 1989; Fig. 6B). Therefore, the single tryptophan in p6* appears solvent-accessible. The CD spectrum in the far-ultraviolet (250-185 nm) exhibits a minimum at 200 nm with a zero transition below 185 nm (Fig. 6C). The form of the spectrum is indicative of a relatively unstructured protein. Increasing the ionic strength of the solution by
0
--
-2000
E
u -4000
E
e 3
-a5 -6000 -8000
-10000
40
20
-12000
60
80
temperature, "C
i.l....I....,,,, 190
200
210
220
230
240
250
wavelength (nm)
Fig. 7. Temperature-dependent far-ultraviolet CD spectra of p6*. Spectra were measured in 20 mM sodium phosphate pH 5.9 at a polypeptide concentration of 22 pM and temperatures of (0)ZO"C, (0) 25"C, (A) 40°C. (V) 60°C, (0)90°C, ( 0 )25°C (after cooling down). Insert: fractional populations of (A)parallel a-structure, ( 0 )a-helix, (V)turn, (+) random coil, and (B) antiparallel a-structure at the respective temperatures, calculated according to Sreerama and Woody (1993). The open symbols represent the values for the sample after the cooling step.
adding 200 mM NaCl or varying the pH from pH 3.4 up to pH 8.5 did not significantly alter the observed spectra (data not shown). A temperature increase from 10°C up to 90°C, however, led to a stepwise reduction of the signal amplitude at 200 nm and a concomitant increase in the signal amplitude above 210 nin (Fig. 7). Although it is difficult to interpret the spectral differences observed after varying the temperature in terms of distinct structural changes, the reversibility of the process and the appearance of an isodichroic point at 210 nm suggest a structural transition which follows a two-state description.
388
Beissinger et al. (Eur: J. Biochern. 237)
!
i.8
1.0
j.9 1.0
1.5
I 1
4.2
-B
4.3
2
2.0
C
3
4.4 2.5
-5-3 E
3.0
45 46
I 3.5
85
84
8 '3
8:2
8:1 8:O WZ
4.0 d
ta
8.7 8.6 8.5 8.4 8.3 8.2 8.1 8.0 02
7.9
4.5
718
7:9
7'8
7'7
-47 i
(PP@
Fig. 9. Fingerprint region of a 200-ms NOESY spectrum of p6*. The lines indicate part of the backbone tracing for the sequential assignment in the C-terminus of the protein. The spectrum was recorded on a Bruker AMX 600 spectrometer with 1.14 mM protein at 25°C in 90 mM sodium phosphate pH 5.9 and H,O/D,O (9: 1).
717
(wm)
Fig. 8. TOCSY spectrum of p6*. The region of the resonances between the amide protons and the C a and side-chain protons is shown. The spectrum was recorded on a Bruker AMX 600 spectrometer with 1.14 mM protein at 25°C in 90 mM sodium phosphate pH 5.9 and H,O/ D 2 0 (9: 1) (mixing time 80 ms). The brackets indicate the regions for the side-chain resonances of the respective classes of amino acids.
With synthetic peptides derived from platelet factor-4, Ilyina et al. (1994) observed C D spectra and changes with temperature closely related to our results. Calculation of the secondary structure content at the respective temperatures according to Sreerama and Woody (1993) resulted in a continuously increasing value for the a-helix content with temperature for two of the peptides. Although application of the same spectra evaluation method resulted in very similar fractional populations for our spectra, with an a-helix content up to 10% and about equal popturn and unordered conformations (Fig. 7, insert), ulations of /I, we do not observe an increase in a-helix content with temperature. One reason may be that the quality of the spectra decreases with increasing temperature. Evaluation of the hightemperature spectra is only possible if the constraints for the calculation algorithm are less stringent, so that the results obtained are certainly less reliable.
Assignment procedure. The two-dimensional NMR spectra of the purified protein were well resolved under the experimental conditions used (Fig. 8). Sequence-specific assignments of resonances in H20/D,0 solution were performed using standard twodimensional NMR procedures (Wiithrich, 1986). The assignments were made on the basis of DQF-COSY, clean-TOCSY (80 ms) and NOESY (100 and 200 ms) spectra. The spin systems of the amino acids were defined with the DQF-COSY and cleanTOCSY, sequence-specific assignments were determined by the chain-tracing method using the NOESY spectra. As an example, Fig. 9 shows the fingerprint region of the NOESY spectrum, where the sequential NOE connectivities for the C-terminal part of p6" not interrupted by Pro (Ser56-Phe70) can be followed.
Table 1 provides the proton chemical shift values for all amino acids of the polypeptide with the exception of the N-terminal Gly, for which no resonances were assigned. The sequence of the p6* from HIV-1 strain BHlO exhibits an 11-residue repeat of the sequence S-S-E-Q-T-R-A-N-S-P-T, which is only interrupted by Ile at position 30. For Glu and the sequence N-S-P the resonances are frequency degenerated so that one spin system represents two amino acids each, and the assignment is not unambiguous. For Arg, Ala and Thr in that region, two very similar yet different spin systems are distinguished, so that individual residues can be assigned in these cases. As shown in Fig. 10, there are few other small regions that exhibit frequency degeneration in the fingerprint region. In all cases unambiguous assignments were possible with the help of couplings between the CpH and the amide protons of the respective successors or via exclusion from already assigned spin systems. However, sequential NOES are observed for all residues from Ser2 on, and the assignment was also validated in the NMR spectra recorded at 10°C (data not shown) instead of 25°C.
Structural information. Complete assignment of the resonances resulted in a relatively poor dispersion of 0.9 ppm for the amide and also the Ca-protons, which contradicts the existence of extremely upfield or downfield shifted protons often observed in the fingerprint region of globular proteins with a stable fold. Fig. 8 shows that the side-chain protons cluster in regions of the spectrum coinciding with the chemical shifts reported for synthetic peptides used as model substances representing random coil conformations (Wuthrich, 1986; Mei-utka et al., 1995; Wishart et al., 1995). We used the backbone chemical shifts obtained from our assignment to perform an estimation of the secondary structure content according to the protocol suggested by Wishart et al. (1992), which relies on the correlation between Ca-proton chemical shifts and their local secondary structural environment. The chemical shift index divides the observed deviations in chemical shifts of the respective protein C a protons relative to the reported random coil values into three categories : $1 for protein downfield shifts of more than 0.1 ppm, -1 for shifts upfield of more than 0.1 ppm and 0 for chemical shift
389
Beissinger et al. ( E m J. Biochem. 237)
Table 1. Sequence-specific resonance assignments. Residue
Chemical shift for NH
CaH
cm 3.96, 3.88 3.04, 2.97 3.05, 2.99 1.81, 1.68 2.05, 1.95 2.75, 2.69 1.64 1.34 3.14 1.68 2.13, 2.03
CYH
others
PPm Ser2 Phe3 Phe4 Arg5 Glu6 Asp7 Leu8 Ala9 PhelO Leu1 1 Gln12 Gly13 Lysl4 Ah15 Argl6 Glu17 Phel8 Serl9 Ser20 Glu21 Gln22 Thr23 Arg24 Ah25 Am26
8.50 8.3.5 8.26 8.11 8.54 8.45 8.03 8.15 7.94 7.93 8.21 8.24 8.02 8.23 8.21 8.33 8.26 8.24 8.44 8.48 8.33 8.15 8.28 8.30 8.35
4.47 4.62 4.56 4.20 4.16 4.57 4.23 4.15 4.51 4.18 4.22 3.93 4.28 4.25 4.23 4.21 4.66 4.47 4.44 4.26 4.35 4.30 4.33 4.28 4.72
1.82, 1.73 1.40 1.80, 1.73 1.87 3.17, 3.03 3.84 3.96, 3.90 2.07, 1.97 2.13, 2.04 4.24 1.88, 1.79 1.39 2.84, 2.76
Ser27 Pro28 Thr29 Ile30 Ser31 Ser32 Glu33 Gln34 Thr35 Arg36 Ah37 Am38 Ser39 Pro40 Thr41 Arg42 Arg43 Glu44 Leu45 (311146 Val47 Trp48
8.16
4.76 4.52 4.32 4.24 4.51 4.46 4.26 4.32 4.29 4.32 4.29 4.72 4.76 4.52 4.31 4.32 4.26 4.24 4.30 4.25 4.05 4.69
3.87 2.32, 1.94 4.18 1.87 3.94, 3.87 3.97, 3.89 2.07, 1.97 2.12, 2.02 4.24 1.87, 1.78 1.39 2.84, 2.76 3.87 2.32, 1.94 4.23 1.87, 1.78 1.79 2.27, 1.97 1.65 1.91 1.98 3.33, 3.23
Gly49 ArgSO Asp51 Asn52 Am53 Ser54 Pro55 Ser56 Glu57 Ah58 Gly59 Ah60 Asp61 Arg62 Gln63 Gly64 Thr65 Val66 Ser67 Phe68 Am69 Phe70
8.26 8.06 8.42 8.37 8.45 8.20
8.28 8.06 8.45 8.48 8.48 8.32 8.13 8.27 8.29 8.35 8.16 8.25 8.33 8.43 8.55 8.15 8.23 8.04 8.24
8.37 8.40 8.31 8.38 8.13 8.40 8.19 8.41 8.45 8.09 8.19 8.26 8.23 8.24 7.63
3.86 4.31 4.60 4.66 4.74 4.72 4.46 4.40 4.31 4.29 3.95 4.29 4.57 4.32 4.31 4.00 4.36 4.15 4.40 4.61 4.69 4.41
1.85, 1.73 2.74, 2.64 2.81, 2.71 2.83, 2.74 3.88, 3.82 2.30, 1.95 3.89, 3.84 2.09, 1.95 1.40 1.40 2.73, 2.66 1.88, 1.76 2.14, 2.03 4.19 2.03 3.74 3.03, 2.89 2.73, 2.58 3.16, 2.98
1.55 2.26 1 .56 1.55 2.39
C6H = 7.18 C6H = 7.22 C6H = 3.16 C6H1 = 0.93, C6H2 = 0.86 C6H = 7.24 C6H = 0.88
1.40
CEH= 2.95, C6H
1.59 2.19 C6H = 7.25
C6H = 3.16
2.31, 2.27 2.39 1.21 1.65
CSH
=
=
1.64
3.20
N6H1 = 7.61, N6H2 = 6.93 2.03 1.21 1.58, 0.92 2.31, 2.27 2.36 1.22 1.64
C6H1
=
3.82, C6H2 = 3.75
C6H = 0.86
C6H
=
3.17
N6Hl = 7.61, NbH2 2.03 1.23 1.63 1.63 1.58 2.24 0.85, 0.82
=
6.93
C6H1 = 3.82, C6H2 = 3.75 CSH = 3.18 C6H = 3.18 C6Hl = 0.91, CSH2 = 0.85 NEHl = 7.42, NcH2 = 6.84 NHc = 10.13, C E ~ H = 7.62, Ct2H = 7.47, CbHl = 7.25, Cq2H = 7.21, C(3H = 7.13
1.60
C6H = 3.17
N6H1 = 7.56, NSH2 = 6.88 N6H1 = 7.62, N6H2 = 6.90 2.01
C6H1
=
3.71, C6H2
=
3.69
2.27
1.61 2.39
C6H = 3.18
1.18 0.90, 0.84 C6H = 7.18 NdH1 = 7.58, NdH2 = 6.86
Beissinger et al. (Eul: J. Biochern. 237)
390 1
10
20
30
40
60
50
70
GSFFREDLAPLQGKAREFSSEQTRANSPTISSEQTRANSPTRRELQVWGRDNNSPSEAGADRQGTVSFNF
dvCJ+l)
Fig. 10. Diagram of sequential NOE connectivities: NH-NH, CaH-NH and CW-NH. The NOE data were obtained from two-dimensional spectra measured at 25"C, and the height of the bars indicates the relative intensities of the NOEs (strong, medium or weak), an asterisk (*) marks frequency degeneration of NOEs.
1.0 x al
U c
.-
E ! S
2
0.0
._ 8
E
S 0
-1.o
5
10 15 20 25 30 35 40 45 50 55 60 65 70 residue number
Fig. 11. Chemical shift index for the Ca protons of p6*. Values calculated according to Wishart et al. (1992).
values below the limit of 0.1 ppm difference. According to this method, a continuous stretch of at least three -1 or 1 indexes indicates an a-helical or P-structured region, respectively. Instead of the random coil chemical shifts reported by Wishart et al. in 1992, we used the more recently (Wishart et al., 1995) determined values for the calculation, because the experimental conditions of that data set match those of our investigations more closely. Fig. 11 shows a stretch of -1 indices from Arg5 to Gln12, which indicates a high a-helix propensity in this region. This is exactly the region where all secondary structure prediction protocols used gave corresponding results. For the rest of the protein, the methods of Gibrat et al. (1987), Deleage and Roux (1987), Kneller et al. (1990), Geourjon and Deleage (1994), Rost and Sander (1994) and Mehta et al. (1995) diverged in the prediction of secondary structure elements, one exception being the C-terminus of the protein exhibiting a high @-strand propensity (data not shown). Interestingly, this would correlate with the possibility of p6* acting as a dimerization inhibitor of HIV-1 protease by interfering with the formation of the fourstranded @-sheetat the dimer interface. Although we could not detect medium-range NOEs characteristic for an a-helix in the N-terminal region, there is an almost continuous stretch of NOEs between sequential amide protons, which also indicates an a-helical tendency (Fig. 10). Decreasing the temperature from 25°C to 10°C leads to an increase in the number and intensity of NOEs from amide proton couplings including an additional NOE between residues 5 and 6 (Fig. 12). The a-helix-forming tendency derived from NMR data for that small region of the protein correlates with the small a-helical contribution to the CD spectra. Residues with Ca-proton downfield shifts of more than 0.1 pprn are Ser27, Ser39 and Ser54. All three Ser, however, are followed by Pro, which was reported to result in Ca-proton downfield shifts of the preceding residue
02
(ppm)
Fig.12. Amide region of a 200-ms NOESY spectrum of p6*. The numbers indicate the residues contributing to the sequential NOEs. The spectrum was recorded on a Bruker AMX 600 spectrometer with 1.14 mM protein at 10°C in 90 mM sodium phosphate pH 5.9 and H,O/ D,O (9: 1).
by a sequence-dependent nearest-neighbour effect (Wishart et al., 1995). A similar effect holds for Ala9, whose Caproton is upfield shifted more than 0.1 pprn compared to the other five Ala as a consequence of a preceding Leu (Wishart et al., 1995). In addition, upfield amide proton shifts are observed with Ala9 and Ala60 resulting from next-neighbour effects. Thus, although the sequential assignments for p6* were obtained for most of the protein with the exception of the ambiguities in the 11-residue repeat, p6* seems to have no defined tertiary structure or stable secondary structure elements under the experimental conditions used. We think that the lack of structure in p6* is a genuine result and not an artefact of our method of expression and purification for the following reasons. (a) Under physiological conditions, the HIV-1 Gag-Pol polyprotein precursors are synthesized on free ribosomes and are directly transported to the cell membrane in the host (Wagner et al., 1992). Post-translational modifications of p6* are therefore unlikely to occur. Consequently, the bacterial expression system is adequate and not responsible for the lack of structure. (b) At pH 8, p6* is not prone to oxidation,
Beissinger et al. (Eul: J. Biochem. 237)
since it does not contain Cys residues. (c) Aggregation of the protein was avoided. We did not see high-molecular-mass complexes in the size-exclusion chromatography following cleavage from GST. (d) We avoided freezing the sample and lyophilization, since we noted in preliminary experiments that these processes were not completely reversible. (e) We have evidence that p6* from our sample acts as an inhibitor of the HIV-1 protease (unpublished results). Studies by Schramm et al. (1 993) indicate that the synthetic hexapeptide Ac-T-V-S-F-N-F, which is identical to the C-terminal part of p6*, is itself a potent inhibitor of protease dimerization. To be active, the C-terminal part of p6* has to be freely accessible. The very absence of structure in p6* suggests that this is indeed the case. This does not exclude conformational changes on complex formation with the viral protease, its natural interaction partner. Although an ever increasing number of HIV protease structures and its complexes with different inhibitors is being published, the process of protease activation in the viral assembly and maturation process is far from clear. The present structural studies and the sequencespecific assignments together with the development of an expression and purification procedure for the transframe protein p6* can provide a basis for further studies to understand the intrinsic regulation of the HIV-1 protease activity in the viral life cycle, which may eventually lead to new ideas for the design of protease inhibitors. We thank Prof. A. Ejchart for help with the NMR experiments, F. Hermann for access to the NDee program and M. Bochtler for help with the manuscript. Financial support was supplied by a grant from the German Fonds der Chemischen Industrie to M. B., by the Deutsche Forschungsgemeinschaft, the European Union Biomed 1-AIDS Research program and the 3undesministeriunz f i r Forschung, Bildung, Wissenschaft und Technologie (grant 01 K1 9415) to P. R., and the German Bundesministerium fiir Furschung, Bildung, Wissenschaft und Technologie (grant FVP-BGA 1/88) to R. W. and H. W.
REFERENCES BabC, L. M., RosC, J. & Craik, C. S . (1992) Synthetic “interface” peptides alter dimeric assembly of the HIV 1 and 2 proteases, Protein Sci. 1, 1244-1253. Bodenhausen, G., Kogler, H. & Ernst, R. R. (1984) Selection of coherence-transfer pathways in NMR pulse experiments, J. Magn. Reson. 58, 370-388. Dayhoff, M. O., von Eck, R. & Park, C. M. (1972) A model for evolutionary change in proteins, in Atlas of protein sequence and structure, vol. 5 (Dayhoff, M. O., ed.) pp. 89-99, National Biomedical Research Foundation, Washington DC. Deleage, G. & Roux, B. (1987) An algorithm for protein secondary structure prediction based on class prediction, Protein Eng. 1, 289294. Facke, M., Janetzko, A., Shoeman, R. L. & Krausslich, H. G. (1993) A large deletion in the matrix domain of the human immunodeficiency virus gag gene redirects virus particle assembly from the plasma membrane to the endoplasmic reticulum, J. Virol. 67, 4972-4980. Geourjon, C. & Deleage, G. (1994) SOPM: a self-optimized method for protein secondary structure prediction, Protein Eng. 7, 157- 164. Gibrat, J. F., Gamier, J. & Robson, B. (1987) Further developments of protein secondary structure prediction using information theory. New parameters and consideration of residue pairs, J. Mol. Biol. 198, 425 -443. Gill, S . C. & von Hippel, P. H. (1989) Calculation of protein extinction coefficients from amino acid sequence data, Anal. Biochem. 182, 3 19- 326. Gottlinger, H. G., Sodroski, J. G. & Haseltine, W. A. (1989) Role of capsid precursor processing and myristoylation in morphogenesis and infectivity of human immunodeficiency virus type 1, Proc. Natl Acad. Sci. USA 88, 5781-5785. Gottlinger, H. G., Dorfman, T., Sodroski, J. G. & Haseltine, W. A. (1991) Effect of mutations affecting the p6 gag protein on human immuno-
391
deficiency virus particle release, Proc. Nut1 Acad. Sci. USA 86, 4776 -4780. Griessinger, C., Otting, G., Wuthrich, K. & Ernst, R. R. (1988) Clean TOCSY for ‘H spin system identification in macromolecules, J. Am. Chem. Soc. 110,7870-7872. Guan, K. L. & Dixon, J. E. (1991) Eukaryotic proteins expressed in Escherichia coli: an improved thrombin cleavage and purification procedure of fusion proteins with glutathione S-transferase, Anal. Biochem. 192, 262 - 267. Hanahan, D. (1983) Studies on transformation of Escherichia coli with plasmids, J. Mol. Biol. 166, 557-580. Ilyina, E., Milius, R. & Mayo, K. H. (1994) Synthetic peptides probe folding initiation sites in platelet factor-4 : stable chain reversal found within-the hydrophobic sequence LIATLKNGRKISL, Biochemistry 33, 13436- 13444. Jacks, T., Power, M. D., Masiarz, F. R., Luciw, P. A,, Barr, P. J. & Varmus, H. E. (1988) Characterization of ribosomal frameshifting in HIV-1 gag-pol expression, Nature 331, 280-283. James, M. N. G. & Sielecki, A. (1986) Molecular stycture of an aspartic proteinase zymogen, porcine pepsinogen, at 1.8 A resolution, Nature 319, 33-38. Kabsch, W. & Sander, C. (1983) Dictionary of protein secondary structure : pattern recognition of hydrogen-bonded and geometrical features, Biopolymers 22, 2577-2631. Kaelin, W. G. Jr, Pallas, D. C., De Caprio, J. A,, Kaye, F. J. & Livingston, D. M. (1991) Identification of cellular proteins that can interact specifically with the TIE1A-binding region of the retinoblastoma gene product, Cell 64, 521 -532. Kaplan, A. H., Zack, J. A., Knigge, M., Paul, D. A,, Kempf, D. J., Norbeck, D. W. & Swanstrom, R. (1993) Partial inhibition of the human immunodeficiency virus type 1 protease results in aberrant virus assembly and the formation of noninfectious particles, J. Virol. 67,4050-4055. Katoh, I., Yasunaga, T., Ikawa, Y. & Yoshinaka, Y. (1987) Inhibition of retroviral protease activity by an aspartyl proteinase inhibitor, Nature 329, 654-656. Kneller, D. G., Cohen, F. E. & Langridge, R. (1990) Improvements in protein secondary structure prediction by an enhanced neural network, J. Mol. Biol. 214, 171-182. Kohl, N. E., Emini, E. A,, Schleif, W. A,, Davis, L. J., Heimbach, J. C., Dixon, R. A,, Scolnick, E. M. & Sigal, I. S . (1988) Active human immunodeficiency virus protease is required for viral infectivity, Proc. Natl Acad. Sci. USA 85, 4686-4690. Kondo, E., Mammano, F., Cohen, E. A. & Gottlinger, H. G. (1995) The ~ 6 ”domain ” ~ of human immunodeficiency virus type 1 is sufficient for the incorporation of Vpr into heterologous viral particles, J. Virol. 69, 2759-2764. Krausslich, H.-G. (1991) Human immunodeficiency virus proteinase dimer as component of the viral polyprotein prevents particle assembly and viral infectivity, Proc. Natl Acad. Sci. USA 88, 3213-3217. Laemmli, U. K. (1970) Cleavage of structural proteins during the assembly of the head of bacteriophage T4, Nature 227, 680-685. Marion, D. & Wuthrich, K. (1983) Application of phase sensitive twodimensional correlated spectroscopy (COSY) for measurements of ‘H-’H spin-spin coupling constants in proteins, Biochem. Biophys. Res. Commun. 113, 967-974. McQuade, T. J., Tomasselli, A. G., Liu, L., Karacostas, V., Moss, B., Sawyer, T. K., Heinrikson, R. L. & Tarpley, W. G. (1990) A synthetic HIV-1 protease inhibitor with antiviral activity arrests HIV-like particle maturation, Science 247, 454-456. Meek, T. D., Lambert, D. M., Dreyer, G. B., Carr, T. J., Tomaszek, T. A. Jr, Moore, M. L., Strickler, J. E., Debouck, C., Hyland, L. J., Matthews, T. J., Metcalf, B. W. & Petteway, S. R. (1990) Inhibition of HIV-1 protease in iRfected T-lymphocytes by synthetic peptide analogues, Nature 343, 90-92. Mehta, P. K., Heringa, J. & Argos, P. (1995) A simple and fast approach to prediction of protein secondary structure from multiply aligned sequences with accuracy above 70%. Protein Sci. 4, 2517-2525. Merutka, G., Dyson, J. H. & Wright, P. E. (1995) ‘Random coil’ ’H chemical shifts obtained as a function of temperature and trifluoroethanol concentration for the peptide series GGXGG, J. Biomol. NMR 5,14-24. Partin, K., Zybarth, G., Ehrlich, L., DeCrombrugghe, M., Wimmer, E. & Carter, C. (1991) Deletion of sequences upstream of the proteinase
392
Beissinger et al. (Eul: J. Biochem. 237)
improves the proteolytic processing of human immunodeficiency virus type 1, Proc. Natl Acad. Sci. USA 88, 4776-4780. Pearson, W. R. & Lipman, D. J. (1988) Improved tools for biological sequence comparison, Proc. Natl Acud. Sci. USA 85, 2444-2448. Rance, M., Sprrensen, 0. W., Bodenhausen, G., Wagner, G., Ernst, R . R. & Wuthrich, K. (1983) Improved spectral resolution in cosy ' H NMR spectra of proteins via double quantum filtering, Biochem. Binphys. Res. Commun. 117, 479-485. Ratner, L., Fisher, A,, Jagodzinski, L. L., Mitsuya, H., Liou, R. S., Gallo, R. C. & Wong-Staal, F. (1987) Complete nucleotide sequences of functional clones of the AIDS virus, AIDS Res. Hum. Retroviruses 3, 57-69. Rost, B. & Sander, C. (1994) Combining evolutionary information and neural networks to predict protein secondary structure, Proteins 19, 55-72. Saiki, R. K., Gelfand, D. H., Stoffel, S., Scharf, S. J., Higuchi, R., Horn, G. T., Mullis, K. B. & Erlich, H. A. (1988) Primer directed enzymatic amplification of DNA with a thermostable DNA polymerase, Science 239, 487-491. Sambrook, J., Fritsch, E. F. & Maniatis, T. (1989) Molecular cloning: a laboratory manual, Cold Spring Harbor Laboratory Press, Cold Spring Harbor NY. Sanger, F., Nicklen, S. & Coulson, A. R. (1977) DNA sequencing with chain-terminating inhibitors, Proc. Natl Acad. Sci. USA 74, 5463 5467. Schmid, F. X. (1989) Spectral probes of conformation, in Protein structure: a practical approach (Creighton, T., ed.) 2nd edn, pp. 251285, IRL Press at Oxford University Press, Oxford. Schramni, H. J., Billich, A., Jaeger, E., Rucknagel, K.-P., Arnold, G. & Schramm, W. (1993) The inhibition of HIV-1 protease by interface peptides, Biochem. Biophys. Res. Cnmmun. 194, 595 -600. Sreerama, N. & Woody, R. W. (1993) A self-consistent method for the analysis of protein secondary structure from circular dichroism, Anal. Biochem. 209, 32-44. Stys, D., Blaha, I. & Strop, P. (1993) Structural and functional studies in vitvo on the p6 protein from the HIV-1 gag open reading frame, Biuchim. Biuphys. Acta 1182, 157-161.
Toh, H., Ono, M., Saigo, K. & Miyata, T. (1985) Retroviral proteaselike sequence in the yeast transposon Ty 1, Nature 315, 691-692. Vaishnav, Y. N. & Wong-Staal, F. (1991) The biochemistry of AIDS, Annu. Rev. Biochem. 60, 577-630. Villarejo, M. R. & Zabin, I. (1974) P-Galactosidase from termination and deletion mutant strains, J. Bacteriol. 120, 466-474. Wagner, R., FlieBbach, H., Wanner, G., Motz, M., Niedrig, M., Deby, G., von Brunn, A. & Wolf, H. (1992) Studies on processing, particle formation, and immunogenicity of the HIV-1 gag gene product: a possible component of a HIV vaccine, Arch. Wrol. 127, 117-137. Weber, 1. T. (1990) Comparison of the crystal structures and intersubunit interactions of human immunodeficiency and Rous sarcoma virus proteases, J. Biol. Chem. 265, 10492-10496. Wishart, D. S., Sykes, B. D. & Richards, F, M. (1992) The chemical shift index: a fast and simple method for the assignment of protein secondary structure through NMR spectroscopy, Biochemistry 31, 1647- 1651. Wishart, D. S., Bigam, C. G . , Holm A,, Hodges, R. S. & Sykes, B. D. (1995) 'H, "C and "N random coil NMR chemical shifts of the common amino acids. I. Investigations of nearest-neighbor effects, 1. Biomol. NMR 5, 67-81. Wlodawer, A,, Miller, M., Jaskolski, M., Sathyanarayana, B. K., Baldwin, E., Weber, I. T., Selk, L. M., Clawson, L., Schneider, J. & Kent, S. B. H. (1989) Conserved folding in retroviral proteases: crystal structure of a synthetic HIV-1 protease, Science 245, 616-621. Wlodawer, A. & Erickson, J. W. (1993) Structure-based inhibitors of HIV-1 protease, Annu. Rev. Biochem. 62, 543-585. Wuthrich, K. (1986) NMR ofproteins and nucleic acids, 1st edn, Wiley Interscience, New York. Zybarth, G. & Carter, C. (1995) Domains upstream of the protease (PR) in human immunodeficiency virus type 1 Gag-Pol influence PR autoprocessing, J. Krul. 69, 3878-3884.