Riordan et al. BMC Genomics 2014, 15:1150 http://www.biomedcentral.com/1471-2164/15/1150
METHODOLOGY ARTICLE
Open Access
Sequencing methods and datasets to improve functional interpretation of sleeping beauty mutagenesis screens Jesse D Riordan1†, Luke J Drury1†, Ryan P Smith1, Benjamin T Brett2, Laura M Rogers1, Todd E Scheetz2,3 and Adam J Dupuy1*
Abstract Background: Animal models of cancer are useful to generate complementary datasets for comparison to human tumor data. Insertional mutagenesis screens, such as those utilizing the Sleeping Beauty (SB) transposon system, provide a model that recapitulates the spontaneous development and progression of human disease. This approach has been widely used to model a variety of cancers in mice. Comprehensive mutation profiles are generated for individual tumors through amplification of transposon insertion sites followed by high-throughput sequencing. Subsequent statistical analyses identify common insertion sites (CISs), which are predicted to be functionally involved in tumorigenesis. Current methods utilized for SB insertion site analysis have some significant limitations. For one, they do not account for transposon footprints – a class of mutation generated following transposon remobilization. Existing methods also discard quantitative sequence data due to uncertainty regarding the extent to which it accurately reflects mutation abundance within a heterogeneous tumor. Additionally, computational analyses generally assume that all potential insertion sites have an equal probability of being detected under non-selective conditions, an assumption without sufficient relevant data. The goal of our study was to address these potential confounding factors in order to enhance functional interpretation of insertion site data from tumors. Results: We describe here a novel method to detect footprints generated by transposon remobilization, which revealed minimal evidence of positive selection in tumors. We also present extensive characterization data demonstrating an ability to reproducibly assign semi-quantitative information to individual insertion sites within a tumor sample. Finally, we identify apparent biases for detection of inserted transposons in several genomic regions that may lead to the identification of false positive CISs. Conclusion: The information we provide can be used to refine analyses of data from insertional mutagenesis screens, improving functional interpretation of results and facilitating the identification of genes important in cancer development and progression. Keywords: Sleeping Beauty, Mutagenesis, Mouse models of cancer, Tumor clonality, Transposon remobilization, High-throughput sequencing
* Correspondence:
[email protected] † Equal contributors 1 Department of Anatomy and Cell Biology, University of Iowa, Iowa City IA 52242, USA Full list of author information is available at the end of the article © 2014 Riordan et al.; licensee BioMed Central. This is an Open Access article distributed under the terms of the Creative Commons Attribution License (http://creativecommons.org/licenses/by/4.0), which permits unrestricted use, distribution, and reproduction in any medium, provided the original work is properly credited. The Creative Commons Public Domain Dedication waiver (http://creativecommons.org/publicdomain/zero/1.0/) applies to the data made available in this article, unless otherwise stated.
Riordan et al. BMC Genomics 2014, 15:1150 http://www.biomedcentral.com/1471-2164/15/1150
Background Animal models of cancer represent a complementary approach to direct analysis of patient tumors, allowing a level of experimental control not possible with human studies. The ability to generate large cohorts under precisely controlled conditions facilitates the interpretation of immensely complex datasets obtained from human samples. Currently, one of the greatest challenges to the development of successful cancer therapies is distinguishing so-called “driver” genetic aberrations that functionally contribute to tumors from background “passenger” events that are propagated during tumor development due to their co-occurrence with drivers. Insertional mutagenesis screens in animal models are particularly suited to addressing this issue, as they can provide large collections of tumors with tagged mutations that are considerably less complex at the molecular level than human cancer. The Sleeping Beauty (SB) transposon system has proven useful for identifying drivers of tumorigenesis in a wide variety of tissue types [1], and it offers several advantages as a forward genetic screening tool. Mutagenic transposons have been engineered to be capable of inducing both gain- and loss-of-function mutations, allowing efficient identification of oncogenes and tumor suppressors, respectively. Insertion sites can easily be amplified following tumor development by taking advantage of unique sequence tags within each transposon, allowing the rapid generation of detailed mutation profiles. The ubiquity of the recognition site for transposon integration (a TA dinucleotide) provides the potential for an unbiased mutation pattern, allowing the identification of tumor-driving events throughout the entire genome. Another advantage of the SB system is its ability to closely recapitulate the process of tumorigenesis as it occurs in humans. Somatic mutations accumulate in a stepwise manner, driving a micro-evolutionary process within the developing tumor wherein those mutations that confer a selective advantage to cells are preferentially maintained. Positive selection for these mutation events leads to selective clonal expansion of the cells harboring them. Common insertion sites (CISs) are identified as regions of recurrent transposon insertion in multiple independent tumors, and they generally impact the function of a specific gene. Genes identified as CISs in this manner represent strong candidates whose mutation may serve as a driving event during cancer development. As mentioned above, the ease of identifying mutations in SB-induced tumors through amplification of transposon/ genome junctions is a major advantage of the system. There is, however, another class of mutation that can be generated through SB transposition that is not detected by current sequencing methods. Members of the Tc1/mariner family of DNA transposons, which includes SB, utilize a cut-andpaste mobilization mechanism that involves the generation
Page 2 of 15
of staggered double-strand breaks at the transposon inverted terminal repeats (ITRs). Following excision, three nucleotides derived from the transposon’s ITRs are left behind, generating a “footprint”. Because transposon integration involves duplication of the TA dinucleotide target site, transposon remobilization results in the insertion of five base pairs (bp) at the donor locus [2,3]. Initial mobilization of a transposon from the donor concatemer to a distinct acceptor locus leaves a footprint between adjacent transposons at the donor site and is predicted to be functionally inconsequential. Remobilization of the inserted transposon from sites outside the donor concatemer within the same cell or its progeny, however, has the potential to significantly impact gene function. For example, a footprint caused by insertion within a coding exon and subsequent excision generates a frameshift mutation. To date, the prevalence of footprints in SB-induced tumors has not been assessed. Given the potential of these mutations to functionally contribute to tumorigenesis, it is important to characterize the rate at which they occur, as well as any evidence of their positive selection in SB-induced tumors. We describe here a high-throughput method to detect and validate footprints caused by transposon excision. Using this method we found that the rate of transposon remobilization in SB-induced tumors is relatively low and that the resulting footprints do not appear to be under strong positive selection. Our results suggest that this type of mutagenesis is unlikely to contribute significantly to tumor development in SB models of cancer. High-throughput sequencing approaches produce millions of reads derived from transposon integration sites that map to tens of thousands of distinct genomic loci. Such complex patterns of insertion are likely the result of intratumoral heterogeneity and ongoing transposon mobilization caused by sustained transposase activity within the cells of a developing tumor mass. The inclusion or removal of background sites (i.e. insertion events present in a small minority of tumor cells) prior to downstream analysis will have profound effects on the quality of the resulting data set. Failure to remove background sites that are not subject to positive selection and clonal expansion during tumorigenesis decreases the sensitivity and accuracy of CIS identification [4]. While it is impossible to identify all of them, many background sites can be distinguished based on low abundance within a tumor or presence within a region of the genome subject to preferential detection as a result of biases in insertion pattern, amplification, sequencing, or mapping. With current sequencing methodologies these qualities are difficult to assess since the correlation between individual template abundance and sequencing depth has not been established, nor has the extent to which biological or technical biases influence the data been determined. Here we show that transposon insertion
Riordan et al. BMC Genomics 2014, 15:1150 http://www.biomedcentral.com/1471-2164/15/1150
site data can be interpreted semi-quantitatively, permitting highly reproducible stratification based on relative abundance and associated clonality. We also report, based on extensive characterization of unselected insertions in normal tissues, apparent biases for detection of several specific genomic regions, an important factor to consider when inferring the degree of positive selection in tumors. Our findings provide novel insights into functionally important aspects of insertional mutagenesis screens with significant implications for interpretation of the data they generate. Incorporation of this information into tumor mutation profile analyses will enhance predictive ability, promoting effective discovery of strong candidate cancer genes for subsequent study.
Results Characterization of transposon remobilization in tumors
We devised a sequencing strategy (Additional file 1: Figure S1) to detect footprints generated by transposon remobilization in a set of three T-cell acute lymphoblastic leukemias (T-ALLs) developed in triple-transgenic mice carrying alleles for 1) Cre recombinase expressed from the CD4 promoter, 2) Cre-inducible SB transposase, and 3) a concatemer of T2/Onc2 mutagenic transposons [5]. The TG6113 T2/Onc2 strain was chosen because it has the highest copy number of transposons within the donor concatemer of any existing SB strain [6], and the CD4-Cre model was chosen due to its long latency relative to other T2/Onc2-induced malignancies [5]. These characteristics of the selected model impart the highest predicted rate of transposon remobilization possible in SB-induced tumors, providing the greatest sensitivity to detect footprints. Genomic DNA extracted from the tumor samples was sheared to an average size of 300 bp, followed by end-repair and ligation of a blunt-ended adaptor sequence. Next, samples were digested with HpyCH4III, a restriction endonuclease that recognizes the five bp sequence left behind following SB transposon excision, and a second adaptor sequence was ligated to the 3’ overhang left by HpyCH4III. PCR was performed with primers designed to amplify fragments containing both adaptor sequences, and the resultant products were sequenced on the Illumina platform. A total of 95,294,646 sequence reads were mapped amongst the set of three samples. With four defined base pairs, the HpyCH4III recognition sequence (5’-ACNGT-3’) is present in the mouse genome at over seven million sites. We designed the high-throughput footprint detection method to enrich for footprints using primers specific to the two consensus footprint sequences [5’-TACAGTA-3’ and 5’-TACTGTA-3’] (Additional file 1: Figure S1). While these sequences are far less frequent than HpyCH4III sites, they are still present at over 300,000 locations in the mouse genome. Therefore, a tissue-matched
Page 3 of 15
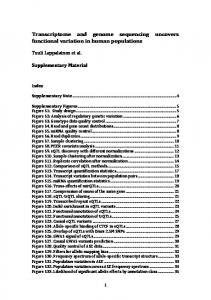
normal sample lacking SB transposition was processed alongside the tumors in order to distinguish actual footprints from endogenous sites with the same sequence. Any sites detected in the normal sample were removed from the tumor-derived sequences prior to further analysis. Another source of background in this experiment comes from transposon insertions that have not been remobilized; every junction between an SB transposon ITR element and the genome contains a recognition site for HpyCH4III. To eliminate this background, any sites that were identified as harboring clonally expanded transposon insertions were also removed prior to further analysis. This approach provided a list of putative transposon footprint sites for each tumor sample (Additional file 2: Table S1). Candidate footprint sites were designated as high or low confidence based on a comparison of their sequencing depth to that of simultaneously sequenced loci that had previously been identified as clonally expanded transposon insertion sites. To verify the presence of a footprint, PCR was performed to amplify 10 candidate loci from each tumor. Products were digested with HpyCH4III and separated by agarose gel electrophoresis (Figure 1). Using this strategy, we confirmed the presence of transposon footprints in 100% (12/12) of analyzed high confidence sites and 5.6% (1/18) of analyzed low confidence sites (Table 1), leading to estimates of 153, 139, and 8 actual footprints in the set of three tumor samples. Candidates were further categorized based on localization within regions encoding genes. Overall, 38.6% and 2.4% of sites fell within introns and exons, respectively. Roughly 34.1% of mapped TA dinucleotides in the current mouse reference genome (GRCm38/mm10) are located within introns, while ~1.5% are located within exons. If footprints functionally contribute to tumorigenesis, we would expect to detect them within exons (due to the nature of the induced mutation) more frequently than predicted by chance as a result of positive selection pressure. Our results demonstrate a lack of significant difference between the expected and observed proportion of footprints mapping to exonic TA sites (p = 0.076, two-tailed two-proportion z-test), providing minimal evidence of such enrichment. Nevertheless, our results do demonstrate that SB-induced tumors will harbor rare frameshift mutations caused by transposon footprints. Semi-quantitative stratification of insertion sites based on relative clonality
Typical high-throughput sequencing analyses of genomic DNA from tumors induced by transposon-mediated mutagenesis detect thousands of unique insertion sites in each tumor [4,7]. The dynamic range of sequencing depth at each site can be quite large, often extending from a single read to tens of thousands of reads. In general, it is assumed that the extent of sequence coverage for a specific insertion site is a reflection of its prevalence within the tumor mass (i.e. the percentage of cells within the tumor
Riordan et al. BMC Genomics 2014, 15:1150 http://www.biomedcentral.com/1471-2164/15/1150
Page 4 of 15
Figure 1 Validation of candidate SB-induced footprint sites identified by deep-sequencing analysis. (A) Schematic diagram depicting the method used to validate putative footprints. Primers were designed to amplify genomic regions predicted to contain SB-induced footprints in DNA from tumor samples, but not in DNA from normal tissue. Products amplified from tumor and normal DNA were purified and subjected to enzymatic digest with HpyCH4III, a restriction endonuclease whose recognition site is generated following SB transposon excision. (B) Digested products were separated by agarose gel electrophoresis. Results from a high confidence (HC) and low confidence (LC) predicted footprint are shown for each of the three tumors analyzed. Undigested products range in size from 473–530 bp (upper bands), while digested products range in size from 235–268 bp (lower bands).
harboring a transposon integrated at a specific genomic coordinate). Additional factors, however, such as PCR amplification bias and differential mapping efficiency could potentially impact coverage, complicating quantitative interpretation of insertion site sequencing data. Assessment of the influence such factors have on sequence coverage is therefore critical to enhancing the ability to infer relative
clonality information for individual mutations within a tumor. We conducted a standard curve experiment to determine the correlation between sequencing depth of a particular transposon insertion site within a tumor and its actual abundance relative to other sites. A set of 10 plasmids was engineered, each of which contained two
Table 1 Candidate footprints identified in SB-induced tumors Tumor ID
Predicted high conf.
Validated high conf.
Predicted low conf.
Validated low conf.
Total candidates
Within introns
Within exons
473
149
5/5 (100%)
557
2
2/2 (100%)
69
0/5 (0%)
218
82 (37.6%)
5 (2.3%)
95
1/8 (12.5%)
97
41 (42.3%)
3 (3.1%)
672
133
5/5 (100%)
104
0/5 (0%)
237
90 (38.0%)
5 (2.1%)
Total
284
12/12 (100%)
268
1/18 (5.6%)
552
213 (38.6%)
13 (2.4%)
Riordan et al. BMC Genomics 2014, 15:1150 http://www.biomedcentral.com/1471-2164/15/1150
artificial templates for amplification by ligation-mediated (LM)-PCR that consisted of either the left or right SB transposon ITR element adjacent to a specific genomic locus identified through prior mutagenesis screening (Additional file 1: Figure S2). For each construct, the paired templates were predicted to be subject to differential amplification bias (e.g. based on GC content or repetitive nature; see details in Additional file 3: Table S2). This physical linkage of templates with hypothesized amplification biases was included to allow a direct assessment of the magnitude of such biases, given the known shared abundance of paired templates. Standard plasmid DNA was mixed with tumor DNA such that each construct was represented at an abundance of 1.0, 0.5, or 0.125 copies per genome to mimic mutations present in 100%, 50% or 12.5% of tumor cells, respectively. We chose previously analyzed tumors from both high-copy T2/Onc2 [5] and lowcopy T2/Onc3 [8] transposon-based screens to allow assessment of the influence that standard inclusion has on the detection of actual insertion sites and of the technique’s robustness across multiple sample types. An Illumina sequencing library was prepared for mixed DNA samples in triplicate using a shearing-based LM-PCR strategy [8], and a total of 11,650,096 reads were mapped amongst the eight samples. Following mapping, the number of sequence reads assigned to each transposon insertion site was normalized to reflect its proportion relative to the most abundant site (i.e. the top site was set to 100%). As shown in Figure 2A, sites derived from the plasmid standards reproducibly clustered into non-overlapping groups of those included at 100%, 50%, or 12.5% abundance. Interestingly, sequencing depth did not differ significantly between paired standard amplification templates. This finding indicates that fragments containing DNA elements predicted to confer PCR amplification bias, such as GC-rich stretches and repetitive regions, are amplified to a similar extent as fragments lacking these elements by the LM-PCR protocol utilized. Thus, read number can reliably be assumed to approximate relative template abundance. It should also be noted that the percentage scores assigned to genomic insertion sites were not significantly affected by inclusion of the standards (Additional file 1: Figure S3A). Based on analysis of each tumor sample in triplicate, a false discovery rate (FDR) for insertion site detection was calculated (see Methods). For those sites with a normalized abundance of 5% or greater, the FDR was zero (Figure 2B). Below 5%, the FDR increased modestly for tumors with high-copy transposon concatemers, with more significant increases observed for tumors having low-copy concatemers. In a study of piggyBac transposon integration in cultured cells, Koudijs and colleagues found that the number of unique ligation points detected for each insertion site following shearing-based LM-PCR more accurately reflected clonality than sequence coverage [9].
Page 5 of 15
Figure 2 The use of standards demonstrates the semi-quantitative range of ligation-mediated PCR to detect transposon insertions in a complex sample. (A) A set of 10 plasmid standards were added to eight DNA samples from SB-induced tumors. These tumors were generated using either a high-copy (HC1-4) [5] or low-copy (LC1-4) transposon donor [8]. The standards were split into three groups and spiked into each tumor DNA sample to mimic insertion events present in 1 copy per cell (1X), 0.5 copies per cell (0.5X), or 0.125 copies per cell (0.125X). The maximum read value obtained for each standard was then expressed as a percentage of the most abundant standard identified in each sample. The indicated values represent the average value for each standard obtained from three independent sequence runs for each sample. (B) Insertion sites in each sample were grouped according to the normalized read value (% of maximum signal). The false discovery rate was estimated for each group of insertions (see Methods).
To determine if this was also true for SB-induced tumor samples, we repeated our percentile rank analyses using the number of unique ligation points for each insertion site instead of read number. Although the rank order of sites derived from the plasmid standards was reproducible and approximated the expected result, separation between groups was greatly decreased as compared to the analysis based on read number, and distinction of groups was impossible due to overlap (Additional file 1: Figure S3B). The divergent outcome of our studies is likely explained by differences in the source of transposon templates and depth of sequencing. Importantly, our analysis was conducted in the context of complex and heterogeneous tumor DNA with extensive sequencing depth, conditions designed to maximize relevance to datasets generated by SB cancer screens. Assessment of detection bias in SB insertion site datasets
Several studies have analyzed genome-wide SB transposon insertion sites in an effort to identify any biases in
Riordan et al. BMC Genomics 2014, 15:1150 http://www.biomedcentral.com/1471-2164/15/1150
the integration pattern. Aside from a local hopping phenomenon, in which transposon re-integration following excision has a tendency to occur within a ~5-10 megabase window surrounding the donor site [10], minimal insertion site bias has been reported for SB [8,11-15]. The majority of these studies, however, have been conducted using cell culture systems with transposon delivery from transfected plasmid DNA and/or with selection for cells that have integrated transposons. We sought to generate comprehensive SB insertion site profiles from tissues in vivo in the absence of selective pressure in order to produce an unbiased dataset more closely matched to those obtained from SB-induced tumors. To generate such a dataset, transposition was activated ubiquitously in eight-week-old mice and allowed to persist for two weeks prior to tissue collection. Inducible, ubiquitous activation was achieved through tamoxifen injection into offspring resulting from a cross between the homozygous ROSA26-CreERT2 strain [16] and an SB strain homozygous for a Cre-inducible ROSA26-SBase allele and a concatemer of either T2/Onc2 (TG6070 and TG6113) or T2/Onc3 (TG12740 and TG12775) transposons. Transposon integration sites were identified in genomic DNA from liver, spleen, skin, and lung tissue by LM-PCR followed by Illumina sequencing. Three independent sections per tissue were analyzed for two males and two females of each strain (192 samples in all), and a total of 33,350,101 sequence reads were mapped to 599,938 unique genomic loci. In order to estimate the relative degree of clonal expansion occurring in tissues during the two week transposition period, we compared the percentage of all mapped sequence reads assigned to the top five most frequently identified sites between a set of T2/Onc3 transposon-induced liver tumors [8] and the T2/Onc3 normal liver samples. For tumors, an average of 19.4% (SD = 12.4%) of sequenced reads mapped to the top five insertion sites. In contrast, the average value was only 4.6% (SD = 4.1%) for normal liver samples. This difference is indicative of a lower level of clonal expansion in the livers subjected to two weeks of transposition, as compared to SB-induced liver tumors (p = 5.0E-7, Student’s ttest). Further evidence that minimal clonal expansion occurred in the normal samples is provided by the finding that 32.4% of insertion sites fall within genes, which is lower than the 35.6% predicted for random integration given the distribution of TA sites throughout the genome. These data indicate a lack of significant positive selective pressure imposed upon tissues during the two weeks of transposition. We used a previously described computational strategy [17] to identify genomic regions with a higher number of detected transposon insertion sites than predicted from a random pattern of integration (see Methods). It should be
Page 6 of 15
noted that sequencing depth was not considered in this analysis; instead, the number of unique insertion sites within a region was used for calculations. Additionally, insertion sites from all 192 samples were pooled for the analysis and processed collectively. This was done to maximize statistical power after it was determined that, aside from local hopping, no major differences existed in the distribution of mapped insertion sites among independent samples, indicating high reproducibility of general transposition activity regardless of tissue type, gender, or strain. The mouse genome was divided into nonoverlapping 20 kilobase (kb) windows and an algorithm was applied to compare the number of observed insertion sites in each window to the expected number, accounting for the prevalence of potential insertion sites (i.e. TA dinucleotides). After Bonferroni correction for multiple hypothesis testing, this analysis identified 794 distinct windows with significantly more insertion sites than predicted (p < 1.0E-7; Additional file 4: Table S3). To improve our ability to evaluate the local hopping phenomenon, we first precisely mapped transgene insertion sites for the transposon concatemer in each of the four SB strains utilized. This was achieved through the design of PCR primer pairs that amplify the transposon/genome junction for each concatemer. PCR genotyping protocols for each transposon allele to distinguish wild-type, heterozygous, and homozygous mice can be found in the Additional file 5: Supplemental Methods section; typical results are shown in Additional file 1: Figure S4, along with the chromosomal coordinates of each transposon concatemer. As expected based on the local hopping activity of SB, the majority of significant windows (85.4%) mapped to one of the four local chromosomes. Of these windows, 86.1% are within six megabases of the concatemer, demonstrating that the majority of local hopping activity occurs within a fairly limited interval rather than being spread throughout the entire local chromosome. This point is illustrated graphically by Figure 3A, which shows the distribution of insertion sites detected in unselected tissues relative to that of all potential insertion sites for the local chromosome of each strain. After removing those on local chromosomes, 116 significant windows remain (Additional file 4: Table S3). These genomic loci define a set of non-local zones of preferential detection in tissues subjected to SB transposition without selection. As such, they represent potential regions of false-positive CIS identification in SB cancer screens. One possible explanation for enhanced detection of transposon insertions within a specific genomic window is the improper mapping of sequence reads that lack a sufficient number of unique bases to be definitively assigned to a single locus. We identified several insertion sites in our dataset that are likely the result of mapping errors and confirmed the absence of integrated transposons at two of them (Additional file 1: Figure S5). Closer examination of
Riordan et al. BMC Genomics 2014, 15:1150 http://www.biomedcentral.com/1471-2164/15/1150
Page 7 of 15
Figure 3 Transposon insertion densities on local chromosomes and non-local windows. (A) The transposon insertion site and TA dinucleotide densities are shown for each chromosome that undergoes local hopping. In each case, the height of the peak indicates the proportion of total events present at that location. The strongest single peak on each chromosome corresponds to the mapped location of the indicated transgene (e.g. TG6113). (B) Two genomic regions identified by PRIM analysis show enrichment for transposon insertion: chr11:3,180,001-3,200,000 (top) and chr6:12,510,00112,570,001 (bottom). In each case, a histogram plot indicates the number of insertion events present at each location (left axis). The density plot indicated by the solid line shows the proportion of total TA dinucleotides (right axis). The density plot represented by the shaded curve represents an estimate indicating the proportion of TA sites in which more than 50% of read lengths can be accurately mapped (see Methods).
the IAS pipeline revealed that the Bowtie2 alignment tool was reporting alignments to repetitive regions that could not be uniquely mapped. Not surprisingly, most (104/116; 89.7%) of the significant windows contained a tight cluster of insertion events that map to one or more TA sites within a repetitive sequence based on RepeatMasker annotation. To eliminate this source of bias from our analyses, we developed an algorithm to determine the number of bases required for absolute mapping confidence at each TA dinucleotide in the genome. Using this information, we repeated our analysis to identify windows of preferential transposon detection after eliminating sequence reads that could not be mapped unambiguously. This approach identified only 16 non-local windows that had a significantly higher number of detected insertions than expected (Table 2), 12 of which were identified by our initial analysis. Density plots for potential and detected insertion sites within two of these windows are depicted in Figure 3B. Based on the amount of discrepancy between our analyses before and after removing ambiguous sequence reads, mapping artifacts appear to be a major source of potential bias for insertional mutagenesis screens. Consistent with our initial observation of similar transposon distribution across sample types, insertions were identified in all four tissues for 14 of 16 windows,
with the remaining two windows containing insertions in three of four tissues. Similarly, insertions from all four or three of four mouse strains were identified in 9/16 and 7/16 windows, respectively (Table 2). While further characterization will be required to conclusively determine the mechanisms responsible in each case, our results demonstrate that in the absence of selective pressure certain regions of the genome are subject to preferential detection by standard analytical techniques used to profile SB insertion sites. This is an important point to consider when assessing the distribution of transposon insertions in tumors; failure to do so could lead to overestimation of significance and increase the occurrence of false-positive CIS identification.
Discussion The relative simplicity of genetic profiling in animal models of cancer induced by insertional mutagenesis is a major advantage when attempting to elucidate molecular mechanisms of carcinogenesis. Because the insertional mutagen’s sequence is known, techniques that amplify adjacent genomic regions for sequencing can readily be implemented. It is important to note, however, that additional types of genetic aberrations are certainly present at some level in tumors induced by this mechanism. Of particular interest for
Window coordinates
p-value
Identified by initial analysis?
# of tissues with insertions
# of strains with insertions
chr2:81,670,001-81,690,000
3.39E-07
No
3
3
Gene within window
Other notes
chr5:28,160,001-28,180,000