Microprocessors and Microsystems 24 (2000) 191–197 www.elsevier.nl/locate/micpro
Sequential diagnosis tool A. Zˇuzˇek, A. Biasizzo, F. Novak* Jozˇef Stefan Institute, Jamova 39, 1000 Ljubljana, Slovenia Received 27 October 1999; received in revised form 31 January 2000; accepted 29 March 2000
Abstract This paper deals with the sequential diagnosis approach and the associated test sequencing problem (i.e. the problem of generating the sequence of tests required to reach a diagnostic conclusion at minimum cost). The traditional test sequencing problem is generalized here to include asymmetrical and multi-valued tests. We present the sequential diagnosis tool (SDT) that enables the user to generate solutions of the generalized test sequencing problem. SDT can be employed as a kernel of a diagnostic reasoner in automatic test equipment or system maintenance software. 䉷 2000 Elsevier Science B.V. All rights reserved. Keywords: Sequential diagnosis; Decision trees; Expert systems; Diagnosis tool
1. Introduction Reliability, availability and maintainability have become essential demands of modern electronic systems. From the manufacturer’s point of view these goals can be pursued with proper design solutions including design for testability issues and supported by effective diagnostic procedures. In a complex system, the time and the cost of performing a diagnostic procedure are becoming critical parameters so it is imperative to keep them as low as possible. The problem of generating the sequence of tests leading to a diagnostic conclusion at minimum cost has been studied for more than three decades [1–7]. NP-completeness of the problem has been proved in 1976 [9]. From the computational point of view, promising results have been achieved with the approach based on integrating concepts from the information theory and the heuristic AND/OR graph search methods [6,10,11]. Earlier solutions dealt mostly with symmetrical and binary tests which restricts their applicability in practice. Theoretical work on the inclusion of multivalued tests [8] and asymmetrical tests [12] provides means to overcome this problem. A comprehensive list of applications in the field of system diagnosis is given in [13]. Most of them are reports of specific problem solutions in practice. Requirement for a general purpose diagnostic reasoner that would include multi-valued and asymmetrical tests fostered * Corresponding author. Tel.: ⫹ 386-61-1773-386; fax: ⫹ 386-61-219385. E-mail addresses:
[email protected] (A. Zˇuzˇek), anton.biasizzo@ ijs.si (A. Biasizzo),
[email protected] (F. Novak).
our work on the development of the diagnostic software tool described below. The paper is organized as follows. First, the sequential diagnosis approach is introduced by an illustrative example and the test sequencing problem is described. Next, the traditional test sequencing problem, defined for symmetrical and binary tests, is presented. It is then generalized to include asymmetrical and multi-valued tests. References to some most common sequential diagnosis algorithms are given. In the last part, the sequential diagnosis tool (SDT) for the generation of solutions of the generalized test sequencing problem is presented.
2. Preliminaries System status can be represented by a set of system states including fault-free state and different faulty states. A diagnostic procedure executes and evaluates a sequence of tests in order to determine the actual system state. There are two major kinds of diagnostic procedures: combinational; and sequential [14]. In a combinational procedure the sequence of tests to be executed is static (i.e. it does not depend on the result of previously executed tests). In a sequential procedure, the choice of the i-th test to be executed is made from the results of the
i ⫺ 1 previously executed tests. Since in the combinational procedure all tests are always executed, the average time to diagnose a fault is higher than for a sequential procedure. Besides, a combinational procedure is inherently redundant since not all tests that are executed
0141-9331/00/$ - see front matter 䉷 2000 Elsevier Science B.V. All rights reserved. PII: S0141-933 1(00)00073-9
192
A. Zˇuzˇek et al. / Microprocessors and Microsystems 24 (2000) 191–197
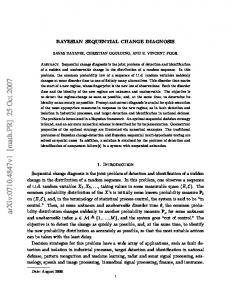
that is actually employed in a given situation in practice is normally subject to some elaborated test strategy. 3. Test sequencing problem A test splits the set of the candidate system states into two subsets. Let A denote the set of candidate system states when a test fails and B the set of candidate system states when the test passes. For a symmetrical test: A 傽 B ⭋: In other words, the test fails if and only if the system is in the state si 僆 A: A common test strategy aim at minimizing the costs of the sequence of tests required to reach a diagnostic conclusion. In literature, the problem of reaching this goal is formally defined as the test sequencing problem. For a system described by: Fig. 1. Brake system troubleshooting table.
are strictly required. In this paper, we shall deal only with sequential procedures. Diagnostic procedure can be interpreted as a decision tree with nodes corresponding to tests and leaves corresponding to the diagnostic conclusions. Tests that are used in the diagnostic procedure may be quite divergent. Traditionally, test is considered as a sequence of actions such that possible faults manifest in the result. In a more general sense, any measurement, signal or other observable event (i.e. symptom) can regarded as a test. Let us take for example the brake system troubleshooting table shown in Fig. 1 where 7 possible faults are detected by 9 different symptoms (i.e. tests). Fig. 2 depicts a diagnostic procedure corresponding to the table in Fig. 1. Notice however, that this is just one of the possible diagnostic procedures. The choice of the procedure
• the set of system states S {s0 ; s1 ; …; sm }; where s0 denotes the fault-free state of the system and si,
1 ⱕ i ⱕ m denotes one of m potential faulty states of the system; • probabilities p
S p
s0 ; p
s1 ; …; p
sm T where p(si) is the a priori probability of the system being in the state si before the diagnostic procedure is started (i.e. the probability of a fault occurrence described by the system state); • the set of available binary tests T {t1 ; t2 ; …; tn }; • test costs c c1 ; c2 ; …; cn associated with the set of tests T. Test costs are measured in terms of time, manpower requirements, or other economic factors; • the test matrix D describing diagnostic capabilities of tests T. Each test tj, 1 ⱕ j ⱕ n; is related to a binary test vector dj d0j ; d1j ; …; dmj : The value dij 1 denotes that test tj fails if the system is in failure state si. Conversely, dij 0 indicates that tj does not detect failure state si. Binary test matrix D consists of test vectors D d1 ; d2 ; …; dn : Its dimension is
m ⫹ 1 × n;
Fig. 2. Sequential diagnostic tree for brake system.
A. Zˇuzˇek et al. / Microprocessors and Microsystems 24 (2000) 191–197
193
Table 1 Test matrix D and a-priori probabilities of the brake system System state
Tests
s0 s1 s2 s3 s4 s5 s6 s7
Probability of system state p(si)
t1
t2
t3
t4
t5
t6
t7
t8
t9
0 1 1 0 0 0 0 1
0 1 0 0 0 0 0 1
0 0 1 0 0 0 1 0
0 0 0 1 1 1 0 1
0 0 0 0 1 0 1 0
0 0 0 0 0 1 0 1
0 0 0 0 1 1 1 1
0 0 0 0 1 0 1 0
0 0 0 1 0 0 1 0
the problem is to generate the diagnostic procedure such that the criterion function given by J pT Ac
m X n X
aij p
si cj
1
i0 j1
(i.e. the average cost of the decision tree) is minimized. In the above expression, aij 1 if test tj is used in the path leading to the identification of system state si and is 0 otherwise. An optimal diagnostic procedure is one which has the minimum cost over all diagnostic procedures which use tests from T to determine the system state.
0.95 0.005 0.01 0.02 0.00375 0.00375 0.00375 0.00375
Table 1 represents the binary test matrix D. We put the value 1 at all the places corresponding to “X” from the brake system troubleshooting table and 0 elsewhere. Table 1 also includes the a priori probabilities of system states. This data can be obtained empirically or computed from the failure rate data tables. Furthermore, to make the life more simple, we assume that the test costs are all equal to 1. Fig. 3 shows the optimal diagnostic procedure of the brake system. The cost of the diagnostic procedure, calculated by expression (1) is: J p
s0 ⫹ p
s6 c4 ⫹ c1 ⫹ c3 ⫹ p
s2 ⫹ p
s1 c4 ⫹ c1
3.1. Example
⫹ c2 ⫹ p
s3 c4 ⫹ c7 ⫹ p
s5 ⫹ p
s4 c4 ⫹ c7 ⫹ c1
Let us continue with our example of brake system troubleshooting. We deal with 7 faulty system states, and we have 9 tests (i.e. symptoms) at disposal for the isolation of the actual system state. Since the system can also be in a fault-free state we include an additional system state s0. Thus S {s0 ; s1 ; s2 ; …; s7 } and T {t1 ; t2 ; …; t9 }:
⫹ c5 ⫹ p
s3 c4 ⫹ c7 ⫹ c1 2:9875: The solution has been obtained using an algorithm for generating optimal diagnostic procedure. At this stage we
Fig. 3. Optimal decision tree for diagnosing the brake system.
A. Zˇuzˇek et al. / Microprocessors and Microsystems 24 (2000) 191–197
194
Table 2 Test matrix of a simple example with 3 system states and 3 tests System state
s1 s2 s3
Tests
Probability p(si)
t1
t2
t3
1 1 0
1 0 0
0 1 0
0.143 0.285 0.572
give the example just to illustrate how the cost of the diagnostic procedure is computed. The algorithms for generating diagnostic procedures are described in the next section. Notice that the diagnostic procedure in Fig. 2 is not optimal. Its cost is J 4:04125:
4. Algorithms Consider an AND/OR graph with AND nodes corresponding to tests and OR nodes corresponding to subsets of system states. The root node represents the set of all system states S while a leaf represents the diagnostic conclusion based on the execution of tests on the path from the root node to the leaf. The AND/OR graph for a simple illustrative example presented by Table 2 is shown in Fig. 4. The test sequencing problem can be described by such a binary AND/OR graph. AND/OR graph search algorithms explore AND/OR graph in order to find the diagnostic procedure such that some criterion function is minimized. In our particular case, the employed criterion function is given by the expression (1). Assuming equal test costs for the above example we can find that the test sequence t1, t2 (indicated in bold in Fig. 4) minimizes the criterion function (1) and hence represents the optimal diagnostic procedure. While such simple examples are trivial, more complex examples are intractable with exhaustive search and require the use of effective search algorithms. The AND/OR graph search algorithms can be categorized
into two different groups: one-step look-ahead algorithms and global search algorithms. The one-step look-ahead algorithms are fast but they do not provide optimal solution. On the other hand, global search algorithms give an optimal solution but their time and space requirements might be excessive. Finding the optimal diagnostic procedure is a NP-complete problem and there is (so far) no known algorithm which could solve it in a polynomial time. Furthermore, it has been shown on realistic examples in practice that the cost of the diagnostic procedure generated by the one-step look-ahead algorithms rarely exceeds 100% of the cost of optimal solution [6]. 4.1. One-step look-ahead algorithms A class of one-step look-ahead algorithms provides a trade-off between optimality and computational complexity. They perform a local step-by-step optimization. The diagnostic tool described in this paper includes two such algorithms: information heuristic algorithm using the information heuristic approach and separation heuristic algorithm. A test can be viewed as an information source about the system. The execution of a test divides the set of candidate system states into two subsets. Hence the ambiguity decreases by the execution of a test. In the information heuristic algorithm [3] test tj is selected if it maximizes the information gain per unit cost cj dc
x; tj
IG
x; tj : cj
2
IG(x,tj) is the information gain given by IG
x; tj ⫺{p
xjp log2 p
xjp ⫹ p
xjf log2 p
xjf };
3
where {xjp ; xjf } are the subsets of the candidate set of system states corresponding to test-pass and test-fail outcome. p(xjp) and p(xjf) are the conditional probabilities of pass and fail outcomes of the test tj [6]. The calculation of the logarithm in the information algorithm is rather time-consuming. In
Fig. 4. AND/OR graph for Table 2.
A. Zˇuzˇek et al. / Microprocessors and Microsystems 24 (2000) 191–197
195
Fig. 5. Example with asymmetrical and multi-valued tests.
the separation heuristic algorithm [4] the expression for test selection is simplified to dc
x; tj p
xjp p
xjf :
4
Test that maximizes the above expression is selected.
4.2. Global search algorithms Dealing with a NP-complete problem, a common strategy is to explore heuristic approaches for guiding the AND/OR graph search [6]. These approaches use problem-domain knowledge in the form of a HEF (heuristic evaluation function) to avoid enumerating the entire set of potential solution trees. HEF is an easily computable heuristic estimate h(x) of the optimal cost of the sub-tree rooted at node x. A typical representative of optimal AND/OR graph search techniques is algorithm AO ⴱ [10]. It is ordered best-first search algorithm; it expands only the node of the search graph that offers the most promising way of reaching the goal nodes on the basis of different heuristics. The first heuristic, denoted by HEF1 is derived by appealing to the analogy between the test sequencing and the Huffman coding problem. Another heuristic, denoted by HEF2 is entropy-based. Yet another one, HEF3 is equal to HEF2 ⫹ 1. Using heuristics HEF1 or HEF2, AO ⴱ is guaranteed to find an optimal solution. HEF3 does not always give an optimal solution but it is useful for complex examples which are intractable with HEF1 and HEF2. The time complexity of HEF1 and HEF2 for the examples exceeding given limits may soon become unacceptable. For the example of 120 system states and 14 tests, SDT running on HP 9000-J210 with PA-7200 CPU and 160 Mbyte of main memory, the execution time is about 30 min. The definition of heuristics and the proof of optimality of AO ⴱ is given in [6].
5. Inclusion of asymmetrical and multi-valued tests The traditional definition of the test sequencing problem described in the previous section assumes only binary symmetrical tests. Yet, available diagnostic tests in practice may have quite different properties. In general, a test may have an arbitrary number of possible outcomes. We denote this feature as multi-valued test. Furthermore, in practice we often deal with tests that are unreliable to a certain degree hence the inclusion of asymmetrical tests may considerably improve the diagnostic process. In contrast to the symmetrical test described in Section 3, for an asymmetrical test: A 傽 B 苷 ⭋: Thus, after running an asymmetrical test, there is at least one state that remains on the candidate list of faulty system states [13]. The generalized test sequencing problem including asymmetrical and multi-valued tests is described by: • system states: S {s0 ; s1 ; …; sm }; • probabilities of system states: p
S p
s0 ; p
s1 ; …; p
sm T ; • tests: T {t1 ; t2 ; …; tn }; • test outcomes: R {R1 ; R2 ; …; Rn }; Let Rj {r1 ; …; rd } present the possible outcomes of a test tj. With a pair (si, tj) we associate the corresponding test outcome rk if test tj is symmetrical for system state si.In the case where test tj exhibits asymmetrical property for a given system state si, the corresponding test outcomes are given together with their conditional probabilities {
rk1 ; p
rk1 ;
rk2 ; p
rk2 ; …}: Notice that the sum of the probabilities of the test outcomes is 1. • test costs: c c1 ; c2 ; …; cn : For the described generalized case we are again looking for the testing procedure such that the criterion function (1) is minimized. Inclusion of asymmetrical tests poses the question of the validity of the conventional test sequencing
A. Zˇuzˇek et al. / Microprocessors and Microsystems 24 (2000) 191–197
196
Fig. 6. Optimal decision tree for the example including asymmetrical and multi-valued tests.
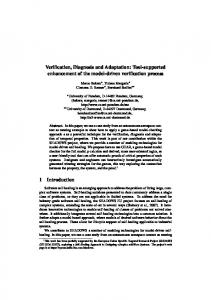
problem solutions. It has been proved that the same heuristics can be employed in the generalized case, [12]. Consequently, the conventional algorithms can be employed for the solutions of the generalized test sequencing problem. 6. Sequential diagnosis tool The SDT developed at Jozˇef Stefan Institute includes both classes of algorithms: information heuristic algorithm and separation heuristic algorithm for fast generation of suboptimal solutions, and algorithm AO ⴱ for the generation of optimal solutions. The SDT is implemented in C⫹⫹ and runs on the following platforms: HP-UX, SunOs and Linux. It is available for non-commercial use at: http://www-csd.ijs.si/SDT/sdt.html http://www-csd.ijs.si/SDT/sdt.html. Besides downloading SDT, one can run SDT remotely (on JSI server) via web interface. In the following we illustrate the option of running SDT via web interface with the example including multi-valued and asymmetrical tests. The input data screen for the example is shown in Fig. 5. 6.1. Example including multi-valued and asymmetrical tests For a system with 9 faulty states we have at disposal 4 multi-valued tests: t1, t2, t3 and t4. Test t4 has 3 possible outcomes: r0,r1 and r3. Tests t1, t2 and t3 have 4 possible outcomes: r0, r1, r2 and r3. Test t2 is asymmetrical for s3, s7, s9 and test t3 for s2. Tests t1 and t4 are symmetrical for all system states. In the case where a test exhibits asymmetrical property for a given system state the corresponding test outcomes are given together with their conditional probabilities. For example, test t2 is asymmetrical for system state s3; the conditional probability of its outcome r1 is equal to 0.2 and the conditional probability of its outcome r2 is equal to 0.8. Test costs are c 1; 1:2; 1:4; 2: Optimal diagnostic procedure generated by algorithm
AO ⴱ is shown in Fig. 6. Its cost is 2.996. Notice that s2 appears in two leaves of the diagnostic tree (shaded in Fig. 6) which reflects asymmetrical nature of test t3 for s2. 7. Conclusions and further work The principle of sequential diagnosis approach has been known for decades and the test sequencing problem has been addressed by a number of authors. However, to the best of our knowledge, no sequential diagnosis software has been reported, that would provide solutions to the generalized case including multi-valued and asymmetrical tests. SDT introduced in this paper supports the above features. SDT can be used as a stand alone package with additional user interfaces for particular domains in practice. One of the possible target applications is automotive diagnostics either in vehicle diagnostic systems in service centers or in the future remote vehicle diagnosis services via internet. In medicine, SDT can be employed to select optimal diagnostic procedures as regards minimum time, minimum cost, least painful medical treatment, medical treatment with minimized use of medicaments with side effects, etc. SDT can also be used to generate optimal emergency scenarios in safety critical applications. On the other hand, SDT can be employed as a kernel of a diagnostic reasoner in automatic test equipment (ATE) in production test for the generation of optimal test sequences. In this respect, further work is foreseen in defining and implementing an IEEE 1232 standard (AI-ESTATE) interface [15] that would provide for portability of the package to different ATE systems. References [1] J.D. Brule´, R.A. Johnson, E.J. Kletsky, Diagnosis of equipment failures, IRE Trans. on Reliab. Qual. Control RQC-9 (1960) 23–34. [2] E.J. Kletsky, An application of the information theory approach to
A. Zˇuzˇek et al. / Microprocessors and Microsystems 24 (2000) 191–197
[3]
[4] [5]
[6]
[7] [8]
failure diagnosis, IRE Trans. on Reliab. Qual. Control RQC-9 (1960) 29–39. R.A. Johnson, An information theory approach to diagnosis, Proceedings 6th Symposium on Reliability and Quality Control, 1960, pp. 102–109. M.R. Garey, R.L. Graham, Performance bounds on the splitting algorithm for binary testing, Acta Informa. 3 (1974) 347–355. W.R. Simpson, C.S. Dowling, WRAPLE: the weighted repair assistance program learning extension, IEEE Design Test Compu. (1986) 66–73. K.R. Pattipati, M.G. Alexandridis, Application of heuristic search and information theory to sequential fault diagnosis, IEEE Trans. Systems, Man Cybern. 20 (4) (1990) 872–887. K.R. Pattipati, M. Dontamsetty, On a generalized test sequencing problem, IEEE Trans. System, Man Cybern. 22 (2) (1992) 392–396. R.W. Yeung, On noiseless diagnosis, IEEE Trans. Systems, Man Cybern. 24 (7) (1994) 1074–1082.
197
[9] L. Hyafil, R. Rivest, Constructing optimal binary decision trees is NPcomplete, Infor. Process Lett. 5 (1) (1976) 15–17. [10] N.J. Nilsson, Principles of Artificial Intelligence, Springer, Berlin, 1982 (chap. 3, pp. 99–109). [11] A. Mahanti, A. Bagchi, AND/OR graph heuristic search methods, J. ACM 32 (1) (1985) 28–51. [12] A. Biasizzo, A. Zˇuzˇek, F. Novak, Sequential diagnosis with asymmetrical tests, The Comput. J. 41 (3) (1998) 163–170. [13] W.R. Simpson, J.W. Sheppard, System Test and Diagnosis, Kluwer Academic, Dordrecht, MA, 1994. [14] H.Y. Chang, E. Manning, G. Metze, Fault Diagnosis of Digital Systems, Wiley, New York, 1970. [15] J.W. Sheppard, L.A. Orlinge, Artificial intelligence exchange and service tie to all test environments (AI-ESTATE)—A new standard for system diagnostics. Proceedings of International Test Conference, 1997, pp. 1020–1029.