To compare the estimators based on the omniscient xed allocations, the minimum AMSE's are needed. Let ` ' on the AMSE denote the minimum asymptotic ...
In
Journal American Statistical Association 93 (1998), pp. 1502{1511.
Sequentially Deciding Between Two Experiments for Estimating a Common Success Probability Janis Hardwick1 University of Michigan Connie Page Michigan State University Quentin F. Stout1 University of Michigan
Abstract:
To estimate a success probability p, two experiments are available: individual Bernoulli(p) trials or the product of r individual Bernoulli(p) trials. This problem has its roots in reliability where either single components can be tested or a system of r identical components can be tested. A total of N experiments can be performed, and the problem is to sequentially select some combination (allocation) of these two experiments, along with an estimator of p, to achieve low mean square error of the nal estimate. This scenario is similar to that of the better-known group testing problem, but here the goal is to estimate failure rates rather than to identify defective units. The problem also arises in epidemiological applications such as estimating disease prevalence. Information maximization considerations, and analysis of the asymptotic mean square error of several estimators, lead to the following adaptive procedure: use the maximum likelihood estimator to estimate p, and if this estimator is below (above) the cut-point ar , then observe an individual (product) trial at the next stage. In a Bayesian setting with squared error estimation loss and suitable regularity conditions on the prior distribution, this adaptive procedure, replacing the maximum likelihood estimator with the Bayes estimator, will be asymptotically Bayes. Exact computational evaluations of the adaptive procedure for xed sample sizes show that it behaves roughly as the asymptotics predict. The exact analyses also show parameter regions for which the adaptive procedure achieves negative regret, as well as regions for which it achieves normalized mean squared error superior to that asymptotically possible. An example and a discussion of extensions conclude the work.
Keywords:
group testing, adaptive design, composite sampling, pooled testing, omniscient allocation, prevalence estimation, reliability c 1995, 1998. Copyright 1
Last modi ed: 23 April 1998.
Research supported in part by National Science Foundation under grants DMS-9157715 and DMS-9504980.
1 Introduction Consider a sequence of Bernoulli trials with success probability p. To estimate p, two experiments can be performed: either an individual trial outcome can be observed (the p-experiment) or the product of r individual trial outcomes can be observed (the pr -experiment), where r is an integer � 2. A total of N experiments (tests) can be performed, and the problem is to select some combination (allocation) of these two experiments along with an estimator of p to achieve low mean square error of the terminal estimator. The experiments can be selected sequentially, so that at each stage, information available at that stage can be used to determine which experiment to carry out at the next stage. Before continuing, some comments on the origin and application of this problem are in order. The pr -experiment is a slightly disguised version of the well-studied grouped data experiment with groups of size r. In the grouped data setting, the goal is to estimate the failure probability, q = 1 ? p, and using groups of sizes other than 1 can reduce the cost of testing (Sobel and Elasho�, 1975) and can lower the variance of the resulting estimator (Chen and Swallow, 1990). Reliability settings, in which components can be tested either individually or as a system of r identical components in series, are prime examples of situations in which group testing can be useful (Easterling and Prairie, 1971). Other group testing scenarios arise in environmental monitoring where sample units of soil or plant matter are combined and tested for toxins. In these settings, the term \group testing" is often replaced by \composite sampling". See Lancaster and Keller-McNulty (1996) for a review of composite sampling methods. A further application, examined in some detail in Section 9, is that of estimating prevalence. Gastwirth and Hammick (1989), for example, apply group testing methods to estimate the prevalence of HIV antibodies among subpopulations. In screening scenarios of this sort, group testing is particularly desirable because it provides for donor privacy, an issue of serious concern among individuals at risk for HIV. The \pooled testing" of Tu, Litvak and Pagano (1995) is another example in which group testing is used to estimate HIV prevalence. In the problem considered here, it is assumed that a \natural" r exists for the grouping of items. In this case, the sampling options are restricted to only the two experiments: the p-experiment and the pr experiment. The reliability setting, in which a system requires that r units in series be tested, represents a scenario in which such an assumption is clearly viable. Note, however, that it is sometimes useful to seek the optimal r for a speci c application. This point is discussed brie y in Section 9 and addressed more thoroughly via the two-stage sampling procedures of Hughes-Oliver and Swallow (1994). In Section 2, notation is given and the problem is precisely de ned. In Section 3, allocation that maximizes information is derived, and in Section 4, pooling data across experiments is discussed and several estimators are analyzed. In Section 5, allocation that minimizes asymptotic mean square error is derived for each of the estimators. In Section 6, an ad-hoc adaptive allocation procedure is proposed, and it is shown that not all of the estimators are consistent when combined with an arbitrary allocation procedure. In Section 7, the problem is placed in a Bayesian framework with squared error estimation loss. Then, under regularity conditions, the adaptive allocation of Section 6, replacing the maximum likelihood estimator with the Bayes estimator, is shown to be asymptotically Bayes. In Section 8, an exact approach is taken to evaluating and optimizing allocation policies for xed values of N . Here it is shown that the 1
ad-hoc adaptive rule of Section 6 has negative regret with respect to the optimal best xed sample size rule that can be generated when the parameter is known. It is also shown that, for some values of the parameter, the ad-hoc adaptive rule achieves a normalized mean squared error that is smaller than the asymptotic limit. For comparison purposes, the optimal adaptive allocation rule is also computed, assuming that the parameter is known. In Section 9, an application of the methods in Section 6 is discussed. There, the group testing approach of Gastwirth and Hammick (1989) is compared with the individual testing approach of Nusbacher et al. (1986) and with the methods proposed in the present article. Finally, in Section 10 the extension from 2 experiments to arbitrarily many is brie y examined.
2 Notation and Problem Statement The problem is set up in its fully sequential form although much of the development in the next sections will not use all of this notation. Let X11; X12; : : : be a sequence of independent and identically distributed Bernoulli(p) random variables that are independent of Xr1 ; Xr2; : : :, independent and identically distributed Bernoulli(pr ) random variables. The success probability p is restricted to (0,1) throughout the paper. A total of N tests (experiments) will be done, where at each stage the decision to observe an X1 or an Xr can be made based on past observations. More precisely, an allocation rule is a sequence d = (d1; : : :; dN ) such that for k = 1; : : :; N , dk takes values 0 or 1, and is measurable fZ1; : : :; Zk?1g, where Zi = di X1i + (1 ? di )Xri. Thus, di indicates the population from which the ith observation or test is sampled, with \1" indicating an X1-observation or the p-experiment, and \0" indicating a Xr -observation or P the pr -experiment. A terminal estimator of p must be measurable fZ1 ; : : :; ZN g. Finally, let mk = ki=1 di be the total number of observations taken from the p-experiments at stage k, and let nk = k ? mk be the total number of observations taken from the pr -experiment at stage k, where k = 1; 2; : : :; N . Sometimes the k subscript will be dropped. Since the nal goal is estimation of p, an allocation scheme and estimator will be evaluated as a pair by the mean square error of the terminal estimator. That is, the mean square error of using allocation d and estimator p^ is given by MSEp (d; p^) = Ep(^p ? p)2 . In the Bayesian framework, the problem of selecting both the allocation rule and the estimator reduces to selecting only the allocation rule and using the Bayes estimator. However, in the non-Bayesian framework, the choice of estimator is not so obvious, and as will be noted in Section 6, the allocation rule and the estimator can interact.
3 Maximum Information Allocation In this section, the problem of selecting an estimator of p is ignored, and only allocation is considered. The criterion used for allocation will be maximizing the Fisher information, and the best nonrandom allocation will be found. As is typical with such optimal nonrandom allocations, the rule will depend on the unknown parameter p, but will suggest the form of an adaptive rule, and the relationship between the MSE's of estimators and Fisher information will make the adaptive rule e�cient. In typical sequential allocation problems, the di�erent experiments give information about di�erent parameters. However, in this problem both experiments give information about the same parameter, 2
r 2 5 10 20 50 100 ar 0.333 0.536 0.679 0.792 0.892 0.937 Table 1: Cut-point Values although one experiment will give more information depending on the actual value of the parameter. In particular, the Fisher information about p contained in a single observation of the p-experiment is I (p) = 1 ; where q = 1 ? p; X1
pq
and the Fisher information about p contained in a single observation of the pr -experiment is 2 r?2 IX (p) = r1 ?p pr : r
It is easy to show that IX1 (p) > IX (p) if and only if p < ar , where ar is the unique root in (0,1) of the equation in p, pr (1 ? r2 ) + r2pr?1 ? 1 = 0: Note that ar is a function only of r, which is known, and hence ar can be determined explicitly. r
Proposition 3.1 If N tests are available, then the allocation that maximizes the information about p is 8 > >
ar > : arbitrary if p = ar (The informations are equal at p = ar ). 2 Thus, the maximum information allocation is to observe only X1 's (the p-experiment) if p < ar , or only Xr 's (the pr -experiment) if p > ar . This will be denoted as ar -cut allocation, and recall that ar depends only on r. However, the region where one experiment is better than the other depends on the unknown parameter p. Thus, the obvious adaptive rule is suggested where p is estimated at each stage, and the next observation is allocated depending the relationship between the estimated p and the cut ar . Some of the values of ar ( rst reported in Loyer, 1983) are noted in Table 1. As r increases to in nity, the cut-point ar tends to 1, and the region over which the pr -experiment is better shrinks. This section is concluded by evaluating the need for sequential allocation. This is done by comparing the information in each experiment. Consider the ratio minfIX1 (p); IX (p)g maxfIX1 (p); IX (p)g over the range of p. Were this ratio bounded below by, say, .98, then using the nonoptimal experiment would never result in more than a 2% loss of information, greatly limiting the worth of adaptive allocation. Since adaptive allocation is somewhat more complicated than xed allocation, there needs to be su�cient bene t to justify its utilization. r
r
3
Proposition 3.2 ( 1 IX1 (p) = maxfIX1 (p); IX (p)g (1 ? pr )=r2qpr?1 (which is � 1=r) ( r2 qpr?1=(1 ? pr ) (which tends to 0 as p tends to 0) IX (p) = maxfIX1 (p); IX (p)g 1 Proof. This is simply algebra. 2 r
r
r
for p � ar for p > ar for p � ar for p > ar
Proposition 3.2 indicates that if the pr -experiment is used, then for p su�ciently small, the information obtained can be arbitrarily close to 0% of that possible when the p-experiment is used. On the other hand, if the p-experiment is used, then the information obtained never falls below (100/r)% of the maximal information obtainable, approaching this bound when p tends to 1. Thus, adaptive allocation can be worthwhile for increasing information. Also, using the p-experiment would be the more conservative approach since one never loses more than (100/r)% of the maximal information obtainable. Note that the bound decreases as r increases, so that at r = 2, no more than 50% of the optimal can be lost, but at r = 10, one might get only 10% of the optimal.
4 Estimators of p Since both experiments give information about p, and an adaptive allocation procedure would typically allocate to both experiments, there is the question of how to combine or pool data across experiments. Several estimators are presented here and their properties are derived. Throughout this section, m is the number of observations from the p-experiment, n is the number of observations from the pr -experiment, and m + n = N is the xed total number of experiments. If m observations from only the p-experiment are used to estimate p, then the best estimator (uniform P minimum variance unbiased and the maximum likelihood) is the sample mean X�1 = m1 mi=1 X1i, and its mean square error is equal to its variance, pq=m. Let p^x1 denote this estimator. If n observations from only the pr -experiment are used to estimate p, then there is no unbiased estimator. P However, the maximum likelihood estimator is X�r 1=r , the rth root of the sample mean, X�r = n1 nj=1 Xrj , which is equivalent to the usual estimator of p in grouped data experiments using groups of size r. Let p^x denote this estimator. The MSE of p^x can be computed for di�erent values of p and n using binomial probabilities, and as n tends to in nity, nMSEp (^px ) tends to 1=IX (p) = (1 ? pr )=r2pr?2 . This has been noted and studied by Sobel and Elasho� (1975). Some comparisons of the exact mean square and this asymptotic form are made in Loyer (1983). Next, the maximum likelihood estimator is derived for the general situation with observations of both experiments. r
r
r
r
Theorem 4.1 Given m observations of the p-experiment and n observations of the pr -experiment, the maximum likelihood estimator of p, denoted p^ml , is the unique root in [0; 1] of the equation
pr (rn + m) + (m ? x1 )(pr?1 + : : : + p) ? (x1 + ry) = 0; P Pn where x1 = m i=1 X1i and xr = j =1 Xrj . 4
Proof. Di�erentiating the logarithm of the joint likelihood function with respect to p gives the equation
above. It is then straightforward to show the existence and uniqueness of a root in [0,1]. 2 For the case of r = 2, the maximum likelihood estimator can be given in closed form: q
p^ml =
a2(1 ? p^x1 )2 + 4ap^x1 + 4(1 ? a)^px 2 ? a(1 ? p^x1 ) r
2
;
where a = m=(2n + m). Other natural estimators of p are weighted averages of p^x1 and p^x , where the weights could depend on m, n, and N . Two particular weight choices are considered below: r
� The constant weights estimator: p^� = (�)^px1 + (1 ? �)^px . � The weight proportional to sample size estimator: p^s = (m=N )^px1 + (n=N )^px . ? � 1 Finally, we mention brie y that ratio estimators such as p^R = X�r =X�1 ?1 have been considered for estimating p, in the context of model validation (Chen and Swallow, 1990). However, these estimators are r
r
r
neither e�cient nor consistent (in the allocation sense), and thus, are not included in this work. Details on the properties of such ratio estimators in this setting can be found in Hardwick, Page, and Stout (1996). To determine the MSE's of the estimators, note that for the weighted average estimators, since p^x1 is unbiased for p, MSEp (^p�) = �2 pq=m + (1 ? �)2 MSEp (^px ). For the other estimators, their MSE's can be computed exactly for any values of m, n, and p, but there is no apparent closed form for them. However, their asymptotic expressions are very tractable. De ne the asymptotic mean square error of estimator p^ as AMSEp (^p) = MSEp (^p) + o(1=n) + o(1=m) for p in (0,1). r
Theorem 4.2 The asymptotic MSE's of the estimators are as follows: AMSEp(^px1 ) = pq = MSEp (^px1 ) m
r AMSEp(^px ) = nr1 2?prp?2 r
? pr ) AMSEp (^pml) = m(1 ?pqp(1 r ) + nr2 pr?1 q 2 �)2 (1 ? pr ) AMSEp (^p�) = �mpq + (1 ?nr 2 pr?2
r 2 r?2 AMSEp(^ps ) = mpq + n(1N?2p )=r p
Proof: This is straightforward. 2
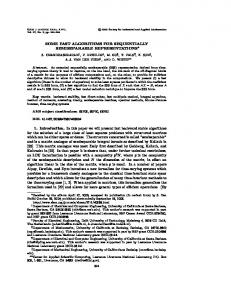
To illustrate the relative performance of the estimators when either degenerate or balanced allocations are used, the values of the limit of N �AMSE as N tends to in nity are plotted in Figure 1 for r = 2 and 10. Note that m = N allocation is used for p^x1 , n = N is used for p^x , and m = n = 0:5N is used for p^ml and p^� . r
5
r=2
1
r W L1 0.0
0.4
0.6
0.8
0.8 0.6
MLE w/all X1’s MLE w/all Xr’s MLE Combined Data Weighted alpha=1/2 W r
L
L
L L L L W
L
L
r W L 1 1 1 1 1 1 1 1 1 W 1 Lr 1 L 1 1 W 1 L W 1 r L L 1 W 1 r L W 1 1 r Lr W Lr W r r L1 W L1 L
r W L1 0.2
1 r L W
L
r W MLE w/all Xr’s L 1 MLE Combined Data r W L Weighted alpha=1/2 r 1 W L r
0.2
r L W
1
0.0
0.0
0.05
L
N*AMSE
0.15 0.10
N*AMSE
0.20
r r W WWWW 1 1 1 1 1 W r r r W W r L1 L W 1 L W L r L W r 1 L 1 L r W L L 1 r 1 W L r L r 1 1 W L r W L L 1 r 1 W L r 1 MLE w/all X1’s
0.4
0.25
1.0
0.30
r=10
1.0
0.0
0.2
0.4
p
0.6
0.8
1.0
p
Allocation for L and W is 50/50 on p and pr . Figure 1: Normalized N �AMSE's of Estimators, r = 2; 10. Note change in vertical scales.
5 Allocation Minimizing Asymptotic Mean Square Error While xed allocations performance of di�erent estimators may be important in some instances, the problem of interest here is the pairing of an estimator and an allocation rule to lower the MSE of the \terminal" estimator of p. In this section, the estimators proposed in Section 4 are considered. Since their exact MSE's are analytically intractable while their rst order asymptotic forms are simple, allocation rules that minimize the asymptotic MSE among nonrandom allocations are considered for each estimator. As is typical with optimal nonrandom rules, the allocation will depend on the unknown p, but will suggest an adaptive rule. For each estimator in Section 4, the following theorem gives a nonrandom allocation, as a function of p, that minimizes the AMSE.
Theorem 5.1 The AMSE's of estimators are minimized as follows: 1. AMSEp(^pml ) and AMSEp (^ps ) are minimized by the ar -cut allocation described in Section 3. p
2. AMSEp(^p� ) is minimized by allocating m=n in proportion fr�=(1 ? �)g pr?1 q=(1 ? pr ).
Proof: This is straightforward algebra, from Theorem 4.2. 2 For each estimator considered, the allocations reported in Theorem 5.1 will give the lowest AMSE for that estimator. These are referred to as asymptotic omniscient xed allocations corresponding to the 6
estimators. To compare the estimators based on the omniscient xed allocations, the minimum AMSE's are needed. Let `� ' on the AMSE denote the minimum asymptotic mean square error when the allocations of Theorem 5.1 are used.
Corollary 5.2 The normalized AMSE�p values are as follows: N � AMSE�p (^pml) = N � AMSE�p (^ps ) = minfpq; (1 ? pr )=r2pr?2 g �2 � q N � AMSE�(^p ) = �ppq + (1 ? �) (1 ? pr)=(r2pr?2 ) p �
Hence, for p in (0; 1), for any weight � in (0; 1),
AMSE�p (^pml ) = AMSE�p (^ps ) � AMSE�p (^p�); with equality occurring only at p = ar .
Proof. This follows easily from Theorem 5.1. 2
Corollary 5.2 shows that the AMSE� for the maximum likelihood and weighted average estimators is the lowest among those considered. Thus, according to the asymptotic MSE criterion, the ar -cut allocation, along with either the maximum likelihood estimator or the sample size weighted average estimator, should be used. Note that caution should be exercised when using the AMSE formulas. These are rst order approximations, ignoring terms o(1=m)+ o(1=n), and thus are valid when both m and n tend to in nity. However, the point of allocation here is to eventually end up on the better experiment. As will be seen in Section 6, the AMSE for the maximum likelihood estimator and the sample size weighted average estimator remains valid if one sample size does not tend to in nity. However, the constant weighted average is not even consistent if one of the sample sizes does not tend to in nity.
6 Adaptive Allocation As mentioned, the allocation rules considered thus far are motivated by the nonrandom \optimal" allocations of Sections 3 and 5. In Section 3, the maximum information rule was the ar -cut rule. In Section 5, this same allocation rule came out of minimizing the asymptotic MSE. Thus, the ar -cut allocation rule is a natural choice for an adaptive rule, where an estimator of p is inserted in the ar -cut form, and that estimator is updated at each stage for sequential allocation. Other results in Section 5 indicated that the estimator of p and the allocation should be compatible in the sense that the ar -cut allocation should minimize the asymptotic MSE of the estimator in use. To de ne an adaptive ar -cut allocation, consider an estimator of p. Here, the term estimator denotes a sequence of estimators fp^k g1 k=1 , where p^k is measurable fZ1; : : :; Zk g. For k = 1; : : :; N , mk + nk = k, where, at stage k, mk and nk are the number of observations on the p-experiment and on the pr -experiment, respectively. The estimators suggested in Section 4 ll this requirement since they are de ned for each pair (m; n). Once an estimator is selected, the ad-hoc ar -cut allocation is de ned in the obvious way: 7
The ar -cut allocation with estimated p: At stage 1, take an observation from the p-experiment. At stage k, 1 < k � N , observe from the p-experiment if and only if p^k?1 � ar .
The tie at ar has been decided in favor of the p-experiment because the worst of the consequences of a wrong decision is less (see Proposition 3.2). The ar -cut allocation aims eventually to allocate to the better experiment depending on the value of p. This requires that the estimator of p used with the allocation be consistent even if the number of observations on one of the experiments does not tend to in nity. This consistency is called \allocation" consistency: Estimator fp^k g is (strongly) allocation consistent if p^k tends to p a.s. as k tends to in nity, for all p in (0; 1).
Theorem 6.1 Estimators p^ml and p^s are allocation consistent, while all p^� estimators are not. Proof. See the Appendix. 2 The estimator used with the ar -cut should be allocation consistent. However, while use of a consistent estimator is prudent, it does not guarantee low MSE of the terminal estimator. That requires e�ciency of an estimator, as described below. Ideally, an adaptive allocation should select the better experiment quickly (high precision of the estimator), and once the better experiment is being used, the estimator should approximate the individual maximum likelihood estimator for that experiment. That is, the goal is to use an estimator p^ with the property that MSEp(^p) � minfMSEp(^px1 ); MSEp(^px )g: Thus, p^ should approximate p^x1 over the range where the p-experiment is better, and should approximate p^x over the range where the pr -experiment is better. Of course, adaptive allocation requires that some of the N observations be used to identify the better experiment. Thus, the desired MSE would not be attained. However, the larger the N , the smaller the proportion expected on the inferior experiment, and the MSE would tend to be nearer to the desired MSE. Asymptotically, (as N tends to in nity), MSEp (^px ) can be replaced by (1 ? pr )=Nr2pr?2 , and the desired limiting MSE can be given as r 2 r?2 MSE (^p) � minfpq; (1 ? p )=r p g : (1) r
r
r
p
N
De ne Hr (p) = minfpq; (1 ? pr )=r2pr?2 g, and note that the MSE should approximate Hr (p)=N for N large. In Section 8 the normalized MSE will be compared to Hr (p). Before this comparison is made, Hr (p) is shown in Section 7 to arise as the limit of normalized posterior expected loss in a Bayesian setting.
7 Asymptotic Bayes Properties The focus of this work is frequentist, and both estimators and allocations are evaluated by MSE. However, the major roles of the Fisher information and the maximum likelihood estimator lead to asymptotic Bayes 8
properties of the ar cut rule (when used with the Bayes estimator), and to a limiting normalized Bayes risk equal to Hr (p). We set up the present estimation problem in a Bayesian framework by assuming a prior distribution f (p) on p, squared error estimation loss L(p; p^) = (p ? p^)2, and likelihood function to match the previous work, pmX�1 (1 ? p)m?mX�1 prnX� (1 ? pr )n?nX� . Let EN L denote the posterior expected loss given Z1 ; : : :ZN where Zi = di X1i + (1 ? di)Xri as de ned in Section 2. Under su�cient regularity conditions on the prior (Kass, Tierney, and Kadane, 1990), the posterior expected loss is approximated by the reciprocal of the Fisher information evaluated at the maximum likelihood estimator: EN L = IN (^pml)?1f1 + O(1=N )g; where IN (p) denotes the Fisher information after N observations and p^ml is the maximum likelihood estimator de ned in Section 4. Note that when m X1's and n Xr 's are observed, then IN (p) = mIX1 (p) + nIX (p), where IX1 and IX are given in Section 3. Recall from Section 6 that Hr (p) = minfpq; (1 ? pr )=r2pr?2 g, and note that r
r
r
r
Hr (p) = p(1 ? p)Ifp�a g + (1 ? pr )=r2pr?2Ifp>a g = IX1 (p)?1 Ifp�a g + IX (p)?1 Ifp>a g ; r
r
r
r
r
where If�g is the set indicator function. Hr (p) is a continuous bounded function of p on [0,1], and thus is uniformly continuous. Also, for any p,
IN (p) = mIX1 (p) + nIX (p) � N [IX1 (p)Ifp�a g + IX (p)Ifp>a g]: r
r
r
r
This implies that
N IN (p)?1 � [IX1 (p)Ifp�a g + IX (p)Ifp>a g ]?1 : But this last term is equal to IX1 (p)?1 Ifp�a g + IX (p)?1 Ifp>a g = Hr (p) since set indicators are used. r
This proves the following lemma.
r
r
r
r
r
Lemma 7.1 N IN (^pml)?1 � Hr (^pml). 2 Theorem 7.2 Under su�cient regularity conditions giving the approximation of the posterior variance in terms of Fisher information,
i. lim inf N !1 N EN L � Hr (p) a.s. ii. lim inf N !1 N EL � EHr (p).
Proof. For (i), note that by the approximation and by Lemma 7.1,
N EN L = N IN (^pml)?1 f1 + O(1=N )g � Hr (^pml )f1 + O(1=N )g : 9
But p^ml converges to p a.s. and Hr is a uniformly continuous function, so thus the lower bound tends a.s. to Hr (p). For (ii), use the inequality above to get lim inf N EL � lim inf EHr (^pml). Then note that Hr is bounded and apply the bounded convergence theorem to deduce the limit to be EHr (p). 2 This theorem along with su�cient conditions to insure uniform integrability imply that the ar -cut rule used with the Bayes estimator will have limiting Bayes risk, EHr (p), and thus, be asymptotically Bayes.
8 Fixed Sample Size Behavior Up to this point, the development and evaluation of allocation rules and estimators has been based solely on asymptotic arguments. In this section, the estimators and allocation rules are examined for their behavior based on xed sample sizes. For moderate sample sizes, some of the estimators do not behave as expected, and there are several adjustments that need to be made when implementing the estimators and allocation rules. Despite these problems, it will be shown that the ar -cut allocation rule using the MLE estimator does very well.
8.1 Adjusting Cut-points The ar value was derived from asymptotic considerations. If the exact MSE for the estimator p^x is compared with the exact MSE for p^x1 using the same number of tests, the cut-point below which the p-experiment does better depends on N as well as r. Determining the cut-point is a straightforward computation, but it does not have a simple closed form. This cut-point di�ers from ar , and N may need to be quite large (say � 100) before it is approximately equal to its asymptotic value of ar . For example, Loyer (1983) showed that for r = 2 the value of a2 is 1=3, but for N = 20, the p-experiment is better when p < 0:445. For r = 5, the value of a5 is 0.536, but for N = 20, the p-experiment is better when p < 0:729. Thus, if the total sample size is moderate, then the ar -cut should be modi ed to account for the lack of asymptotic t. This adjustment is more pronounced the larger r is. r
8.2 Exact Mean Squared Errors of Estimators Using Fixed Allocations As noted earlier, the MSE's of most of the estimators under consideration don't have convenient analytic forms. However, given p and N , the MSE's can be calculated for each estimator. In this section, performance of the estimators based on xed allocations are reviewed. Representative behavior is illustrated in Figure 2 for N = 40 and N = 100, for r = 2. The labels and relative sample sizes used for the di�erent estimators are the same as in Figure 1. The values in Figure 2 have been scaled by a factor of N , so they can be compared across sample sizes as well as between estimators. It seems clear from both gures that the best estimators for small and large values of p, respectively, are p^x1 and p^x . As noted, as the total sample size increases, the point at which p^x begins to improve on p^x1 moves towards the value a2 = 1=3. Note that, even with predetermined allocations of N=2 observations from each experiment, the maximum likelihood estimator, p^ml , does very well across the entire range of parameter values regardless of the total sample size. Also, while it may seem odd that the MSE of p^� or p^s could be larger than the MSE's of r
r
10
N=40, r=2 0.5
0.5
N=100, r=2
1 r L W
0.4
r W W W r
r W
MLE w/all X1’s MLE w/all Xr’s MLE Combined Data Weighted alpha=1/2
1 r L W
r W 0.4
r
r W
MLE w/all X1’s MLE w/all Xr’s MLE Combined Data Weighted alpha=1/2
W
W
0.4
0.6
0.8
0.2
1.0
W
W W 1 1 1 r 1W 1 r 1 L L1 Lr L W L W 1 L 1 L W r L 1 L r 1 W r L L 1 r W 1 L W r W L 1 r L 1 L r W r W L 1 1 L r W L r 1 1 Lr W
0.1 r L1 W
0.2
r r
0.0
r W L1 0.0
0.3
N * MSE
0.3 0.2 0.0
W
W r 1 1 1 W 1 1 1 W L L1 Lr Lr L W L 1 1 L W r L W L 1 1 r L L 1 r W L 1 r W r r L L 1 1 L r W r W L 1 1 W L r W L r 1 1 Lr W
0.1
N * MSE
W r
r
r L1 W
r W L1 0.0
0.2
p
0.4
0.6
0.8
1.0
p
Allocations for L and W are 50/50 on p and pr . Figure 2: Exact N �MSE Values Using Fixed Allocations. either of the two components that comprise the estimators, the plots indicate that this is true. However, there is no contradiction here because the MSE's for p^x1 and p^x are each based on N observations while the p^x1 and p^x components of the averaged estimators are each based on fractions of N , and thus are not averages of the X1 and Xr values shown in the plots. Comparing Figure 2 to Figure 1, one sees a decrease in the MSE of p^x and the estimators that depend on it as N goes to in nity. Unfortunately, the MSE's of these estimators don't converge very rapidly to the AMSE's. We examined MSE's for N = 200 and they were not much closer to the AMSE's than are the MSE's for N = 100. On the positive side, the MSE of the maximum likelihood estimator rapidly converges to its AMSE. The MSE's and AMSE's for p^x1 are, of course, the same. r
r
r
8.3 MSE's of Adaptive Procedures The performance of the sequential ar -cut allocation rule is illustrated in Figure 3 for N = 100, r = 2, and a2 = 1=3. In this gure, C denotes the exact MSE of the adaptive ar -cut rule and E represents the normalized lower envelope from Equation (1) of Section 6, namely Hr (p). Note that the cut-point rule has essentially the same MSE as the lower envelope of the AMSE's, except for the region of approximately 0:3 < p < 0:4, as shown in the enlargement on the right. In this interval, the MSE of p^ml actually improves upon the best values gotten using the AMSE's. This behavior leads to questions about the comparison of the exact MSE of the cut-point adaptive rule with other lower envelopes derived for xed N . For xed N , the MSEp (^pml ) can be computed as a function of m and p, then minimized 11
1 r C F E
1
r
0.20
1 E F C
1
1
1 r 1 F E C
1 1
C Fr E
C 1 E F
C Fr E
MLE w/all X1’s MLE w/all Xr’s Cutpoint Adapt Omni. Fixed Asymp. Envelope Omni. Adapt
1 C Fr E
0.24
0.25
r
1
r 1 r 1 r
1
1 r
1 F
C Fr E
N * MSE
C 1 E F
1
0.6
0.05
Fr Fr E
0.8
0.21
C C
1 E F
C
C E
C
C Fr
C
E
C C
Fr E E
C
C
Fr Fr
E
E 0.35
0.40
C Fr
E
0.30
p
C Fr
0.20
1.0
C
Fr
C C
C
E
C
1
r 1 C E F
r 1 C E F
0.4
Fr
1 E F
C Fr E
0.2
r F
E
1 E F
1
C Fr E
C 1 E F
0.0
F
E C Fr E
C 1 E F
1
E
C Fr E
C Fr E
0.0
1 E F
0.22
0.15
1 C Fr E
0.10
N * MSE
C Fr E
MLE w/all X1’s MLE w/all Xr’s Cutpoint Adapt Omni. Fixed Asymp. Envelope Omni. Adapt
r 1
C Fr E C 1 E F
1 r C F E
1 r
0.23
r
0.45
C Fr
C 0.50
p
Figure 3: Adaptive Allocation using the MLE, N = 100, r = 2, cut-point = 1/3. as a function of m. Call the allocation thus obtained \omniscient xed". This minimizer is dependent on the unknown p, but gives a lower envelope for this MSE. It also is interesting to note that the minimizing m is not necessarily degenerate, i.e., equal to N or 0. For example, at N = 100, r = 2, and p = 0:35, the omniscient xed allocation to the p-experiment is m = 57. In Figure 3, for N = 100 and r = 2, the values of normalized MSE for the omniscient xed allocation are denoted by F. The plot on the left provides normalized MSE's over the entire range of p and the plot on the right is a blow-up of the parameter region in which the MSE of the omniscient xed rule is better than the asymptotic lower envelope. The region in which the omniscient xed rule improves on the asymptotic lower bound (E) is quite small and shrinks to zero width as N ! 1. Also note that the cut-point adaptive rule (C) performs better than the omniscient xed rule in the area of the cut-point. This is a region of negative regret, as discussed for example in Woodroofe (1977) and Martinsek (1983), where the ability to adapt is so bene cial that it overtakes allocation that has advanced knowledge of the parameter but which must be xed in advance of any experiments. For xed N , the true lower bound for the MSE of all rules using the maximum likelihood estimator as terminal estimator can be computed as a function of p and N . This fully sequential rule, which we call \omniscient adaptive", assumes knowledge of the parameter p. Its normalized MSE, denoted by �, is shown in Figure 3. Apparently the only way to obtain the omniscient adaptive rule is through dynamic programming calculations. Finally, computations similar to Figure 3 are shown in Figure 4 for r = 10 and N = 100. The cut-point used was 0.76, rather than a10 = 0:679, because this is the point at which the p10-experiment is superior to the p-experiment when N = 100. The basic behavior is similar to that seen for r = 2, but many of 12
0.30 1 E F
1 E F
C 1 E F
C 1 E F 1 E F C
C 1 E F
1 F 1 E C
1 F C
1
E
C 1 E F
0.10
C 1 E F
1 C Fr E
C 1 E F
0.05
C 1 E F
0.1
0.20
C 1 E F
C 1 E F
0.2
N * MSE
C 1 E F
N * MSE
r
r
0.15
C
MLE w/all X1’s MLE w/all Xr’s Omni. Fixed Cutpoint Adapt Asym. Envelope Omni. Adapt
0.25
0.3
C
1 r F C E
1
0.0
C Fr E r 1 C E F
0.0
0.2
0.4
0.6
0.8
C Fr E
C C 1 E E F 1 C F 1 E E F 1 F F 1 E C E 1 E F 1 E F 1 1 F C F 1 E F 1 1 C 1 F 1 1 C F E 1 1 r C F 1 C 1 C C E F C C F C E C F C E C r E F C E F C E r F E 1 MLE w/all X1’s E r MLE w/all Xr’s E F Omni. Fixed C Cutpoint Adapt E Asymp. Envelope Omni. Adapt
1
1
1
1
1
1
1
C Fr C E Fr C E Fr C E Fr C E Fr C E E Fr C Fr E
0.0
C Fr E
r
r 1 C F E
1.0
0.60
p
0.65
0.70
0.75
0.80
0.85
p
Figure 4: Adaptive Allocation using the MLE, N = 100, r = 10, cut-point = 0.76. the di�erences between asymptotic behavior and that for moderate N are more pronounced. For example, for small p, the extent to which the pr -experiment is worse than the p-experiment is far more extreme. For the same value of N , the region in which the omniscient xed allocation rule is a mixture of p- and pr -experiments is far larger than it was for r = 2, and the ability of the omniscient adaptive rule to improve upon the omniscient xed rule is greatly enhanced. The MSE of the omniscient adaptive rule is a more irregular function of p, and, though not evident in Figure 4, it is no longer unimodal.
9 Example: Estimating Prevalence To provide some insight as to how the adaptive group testing methods presented in Section 6 may be used, we apply them to the Gastwirth and Hammick (1989) reanalysis of a blood screening study of Nusbacher et al. (1986). The authors of the latter work examined whether one could e�ectively inhibit HIV carriers from donating to a transfusion blood pool. In their study, blood donors who participated in high risk activities were asked to designate their donation to a \research" blood pool rather than to the usual transfusion blood pool. Of the 627 donations to the research blood pool, 11 were found to carry HIV antibodies. The problem of estimating the prevalence of HIV antibodies motivated Gastwirth and Hammick (1989) to utilize group testing methods on the research blood pool data. However, since screening tests tend to cost considerably less than con rmatory tests, these authors incorporated the sensitivity and speci city of the screening test into their estimators. In this way, they were able to do realistic cost analyses of the group testing approach and the individual testing method. Further, while one of their aims was to provide an accurate prevalence estimator, they also sought a testing method that would preserve the anonymity of the donors. Note that this latter goal is in opposition to the one that motivated Dorfman (1943) to propose group testing methods in the rst place. Dorfman's objective was to reduce the cost of detecting 13
Batch Sizes No. Samples E(No. Individuals) Cost Advantage 1 1020 1020 11:4 Cs � Cd 10 110 1100 0:3 Cs � Cd � 11:4 Cs Adapt. 10, 20 63 1250 Cd � 0:3 Cs Figure 5: 3 Methods for Achieving MSE= 1:46 � 10?6 all positive cases (see also Hwang (1972)). Our goal here is to compare the accuracy of the adaptive cut-point estimator for prevalence with those obtained from individual testing and xed group size testing. To simplify comparisons, the strong assumption that the sensitivity and speci city of the screening test are one is made, although adaptive cut-point methods can be optimized for more general settings. It is also assumed that, for each method examined, the observations are sampled from a large population in which the underlying prevalence rate is 11=627 = 0:0175, the rate observed by Nusbacher et al. (1986). Gastwirth and Hammick (1989) used batches of size 10, but there seems to be no particular reason to believe that 10 is better than some other group size. We consider what would happen if the adaptive cut-point method is applied for group sizes of r = 10 and s = 20, assuming, as did Gastwirth and Hammick (1989), that there is no dilution e�ect. Note that this is equivalent to the r = 1 versus s = 2 problem considered earlier, in the sense that the r = 1 observations are sampled from a Bernoulli population with success rate q 10. Taking a sample size of N = 63, as in Gastwirth and Hammick (1989), we obtain a MSE of 1:46 � 10?6 . To achieve the same MSE using only batches of size 10, one would need a sample of size N = 110; and, using batches of size 1 would require a sample size of N = 1020. These results are summarized in Figure 5. As noted in Gastwirth and Hammick (1989), there are signi cant advantages to using groups larger than 1, and an adaptive grouped allocation provides yet further advantages. However, there is the consideration that the number of individual samples required increases slightly. Gastwirth and Hammick (1989) addressed this concern via cost analyses, and here cost analyses are carried out using a model consisting of two components. Let Cs be the cost of one screening test and let Cd be the cost of obtaining a single blood donation. Then the cost of achieving of an MSE of 1:46 � 10?6 using only batches of size 1 is 1020(Cs + Cd ); the cost using only batches of size 10 is 110 Cs +1100 Cd; and the expected cost using the adaptive method is 63 Cs + 1250 Cd. The nal column of Figure 5 shows the ranges of relative Cs and Cd values for which each method is the most cost-e�ective. Typically it happens that Cd � Cs , and in these situations, adaptive group testing appears to be signi cantly superior. If total cost is the appropriate consideration, it can be directly incorporated into the adaptive cut-point method. For example, one could compare the asymptotic cost per unit of information using the p-experiment, versus the cost using the pr -experiment, to decide which to perform. That is, one would determine the cut-point by solving IX1 (p) IX (p) Cs + Cd = Cs + rCd r
14
Finally, one may wonder why r = 10 and s = 20 were selected for the adaptive version of this example. The only reason for this is that it corresponds well to the main case, p versus p2, studied in this paper. The present problem was also solved when r and s were taken to be 10 and 100 respectively (which corresponds to the p versus p10 case). In this latter case, 63 samples result in a signi cantly smaller MSE of 3:2 � 10?7 for p^. The fact that the p10 versus p100 experiment provides an even greater reduction in MSE for this problem leads one to wonder what the optimal group sizes are for speci c problems. As mentioned earlier, Hughs-Oliver and Swallow (1994) consider this question using a two-stage approach. One can extend the present work to include the fully sequential case in which one seeks to estimate not only p, but also the value of r that will optimize a group testing scenario.
10 Extensions The problem considered in the previous sections was to choose from 2 experiments, the p-experiment and the pr -experiment, and was motivated by reliability applications. The results can be extended to J experiments and need not necessarily include the p-experiment. Let the available experiments be de ned by integers r(1); r(2); : : :; r(J ) such that 1 � r(1) < r(2) : : : < r(J ), where the ith experiment is a pr(i)experiment. As before, the Fisher information about p contained in a pr -experiment is
IX = r2pr?2=(1 ? pr ) : r
Now, de ne Gr;s (p) = IX (p) ? IX (p), and note that Gr;s (p) > 0 if and only if IX (p) > IX (p), i.e., if and only if the pr -experiment has more information about p than does the ps -experiment. r
s
r
s
2?r Gr;s(p) = [(s2 ? r2 )ps ? s2 ps?r + r2 ] (1 ? ppr )(1 ? ps) ;
so for p in (0,1), the sign of Gr;s(p) is determined by the rst factor. Using derivatives, one can show that Gr;s(p) = 0 has a unique root, ar;s, in (0,1), and, for r < s, IX (p) > IX (p) if and only p < ar;s. Cut the unit interval into J parts using cuts r
s
0 = ar(0);r(1) < ar(1);r(2) < : : : < ar(J ?1);r(J ) < ar(J );r(J +1) = 1 ; where for notational convenience we introduce r(0) = 0 and r(J + 1) = 1. Notice that these cuts are de ned using the r(i) in increasing order. Then it can be shown that the pr(i)-experiment has maximum information when p is in the ith interval (ar(i?1);r(i); ar(i);r(i+1)), for i = 1; 2; : : :; J . This motivates the very simple adaptive rule which allocates to the pr(i)-experiment at stage k + 1 if the estimator of p based on the data up to and including stage k is in the ith interval. As before, this can also be modi ed by noting that the ar;s values are based on an asymptotic analysis and can be adjusted for given sample sizes. There are other useful extensions of the problem examined in this paper. One is to allow the sample size to be a random variable which depends on some stopping criterion. Another is to incorporate unequal costs when sampling from the di�erent experiments. Yet another is to take the Bayesian perspective when sample sizes are xed. This latter problem requires a signi cantly di�erent approach than the one taken here. 15
Appendix: Proof of Theorem 6.1 The lack of consistency of p^� occurs when one of the sample sizes does not tend to in nity. That is, if, say, 1 � n < no < 1, then X�r 1=r does not converge in probability or a.s., and the weight 1 ? � does not tend to zero. On the other hand, the p^s estimator has weights m=N and n=N and if either sample size is bounded as N tends to in nity, the weight tends to zero, implying consistency. P P The consistency of p^ml requires more work. Let x1 = mi=1 X1 and xr = nj=1 Xr . Then the logarithm of the joint likelihood function is equal to j
i
hm;n (p) = fm(p) + gn (p), where fm (p) = x1 log(p) + (m ? x1) log(1 ? p) and gn(p) = xr log(pr ) + (n ? xr) log(1 ? pr ). The derivative with respect to p is
h0m;n (p) = fm0 (p) + gn0 (p), where fm0 (p) = xp1 ? m1??xp1 and gn0 (p) = r xp ? (n?1x?p)p ?1 . r
r
r
r
The maximum likelihood estimator is the unique root in [0,1] of h0m;n (p) = 0, and because fm0 and gn0 are both decreasing in p, it follows that the root of h0m;n is between the roots of fm0 and gn0 . Thus, minfp^x1 ; p^x g � p^ml � maxfp^x1 ; p^x g. Therefore, if both m and n tend to in nity, then both p^x1 and p^x tend to p a.s., and thus p^ml tends to p a.s. rn 0 0 Now, suppose that n � no < 1. Then ?1rn ?p � g n(p) � 1?p , which in turn bounds hm;n by r
r
r
o
o
A? (p) = xp1 ? m ? x1q + rno � h0m;n (p) � x1 +p rno ? m ?q x1 = A+ (p): rn . Then, p? � p^ml � p+ . But p? and p+ 1 and A+ (p) = 0 at p+ = xm1++rn But A? (p) = 0 at p? = m+xrn both tend to p a.s. as m tends to in nity, and thus p^ml tends to p a.s. as m tends to in nity even though n � no . A similar argument holds for m � mo < 1. 2 o
o
o
16
References [1] Chen, C. L. and Swallow, W. H. (1990), \Using Group Testing to Estimate a Proportion, and to Test the Binomial Model," Biometrics, 46, 1035{1046. [2] Dorfman, R. (1943) \The Detection of Defective Members of Large Populations," Annals of Mathematical Statistics,14: 436{440. [3] Easterling, R. G. and Prairie, R. R. (1971), \Combining Component and System Information," Technometrics, 13, 271{280. [4] Gastwirth, J. and Hammick, P. (1989), \Estimation of the Prevalence of a Rare Disease, Preserving the Anonymity of the Subjects by Group Testing: Application to Estimating the Prevalence of AIDS Antibodies in Blood Donors," Journal of Statistical Planning and Inference, 22, 15{27. [5] Hardwick, J., Page, C. and Stout, Q. F. (1996), \Sequentially Deciding Between Two Experiments for Estimating a Common Success Probability," Technical report, Michigan State University, Department of Statistics and Probability. [6] Hughs-Oliver, J. and Swallow, W. H. (1994), \A Two-Stage Adaptive Group-Testing Procedure for Estimating Small Proportions," Journal of the American Statistical Association, 89, 982{993. [7] Hwang, F. K. (1972), \A Method for Detecting all Defective Members in a Population by Group Testing", Journal of the American Statistical Association, 67, 605{608. [8] Kass, R., Tierney, L., and Kadane, J. (1990), \The Validity of Posterior Expansions Based on Laplace's Method," Bayesian and Likelihood Methods in Statistics and Econometrics, S. Geisser, J. S. Hodges, S. J. Press and A. Zellner (eds.), 473{478. Amsterdam: North-Holland. [9] Lancaster, V. A. and Keller-McNulty, S. (1996), \A Review of Composite Sampling Methods", Technical Report 96-01, Kansas State University, Dept. of Statistics. [10] Loyer, M. W. (1983), \Bad Probability, Good Statistics, and Group Testing for Binomial Estimation," The American Statistician, 37, 57{59. [11] Martinsek, A. (1983), \Second Order Approximation to the Risk of a Sequential Procedure," Annals of Statistics, 11, 827{836. [12] Noble, W. (1990), First Order Allocation, Ph. D. Thesis, Michigan State University. [13] Nusbacher, J., Chiavetta, J. et al. (1986) \Evaluation of a Con dential Method of Excluding Blood Donors Exposed to Human Immunode ciency Virus", Transfusion, 27, 539{541. [14] Sobel, M. and Elasho�, R. M. (1975), \Group Testing with a New Goal, Estimation," Biometrika, 62, 181{193. 17
[15] Tu, X. M., Litvak, E. and Pagano, M. (1995), \On the Informativeness and Accuracy of Pooled Testing in Estimating Prevalence of a Rare Disease: Application to HIV Screening", Biometrika, 82, 287{297. [16] Woodroofe, M. (1977), \Second Order Approximations for Sequential Point and Interval Estimation," Annals of Statistics, 5, 984{995.
18