Article
Serum Bilirubin Links UGT1A1*28 Polymorphism and Predicts Long-Term Cardiovascular Events and Mortality in Chronic Hemodialysis Patients Ying-Hwa Chen,*† Szu-Chun Hung,‡ and Der-Cherng Tarng§¶
Summary Background and objectives Bilirubin is a protective factor with antioxidant and anti-inflammatory properties, but its association with clinical outcomes of hemodialysis patients is unknown. Bilirubin degradation is mainly determined by the activity of hepatic bilirubin uridine diphosphate-glucuronosyltransferase (UGT1A1), which is significantly influenced by a TA-repeat polymorphism in the gene’s promoter, an allele designated UGT1A1*28. The study aimed to clarify the association between serum bilirubin and UGT1A1*28 polymorphism and their respective effect on outcomes of chronic hemodialysis patients. Design, setting, participants, & measurements The cohort study comprised 661 chronic hemodialysis patients who were prospectively followed for 12 years. The endpoints were cardiovascular events (CVEs) and allcause mortality. Results After adjustment for traditional and dialysis-related risk factors, individuals with bilirubin in the upper tertile had an adjusted hazard ratio of 0.32 for CVEs and 0.48 for all-cause mortality compared with those in the lower tertile. Individuals homozygous for UGT1A1*28 (genotype 7/7) had significantly higher bilirubin levels than those with 6/6 and 7/6 genotypes. In the same multivariable-adjusted model, individuals with 7/7 had approximately one tenth the risk for CVEs and one fourth the risk for all-cause mortality as compared with carriers of the 6 allele. Conclusions A graded, reverse association was noted between serum bilirubin and adverse outcomes among chronic hemodialysis patients. Moreover, the UGT1A1*28 polymorphism had strong effects on bilirubin levels and the 7/7 genotype might have an important effect on reducing CVEs and death. Clin J Am Soc Nephrol 6: 567–574, 2011. doi: 10.2215/CJN.06130710
Introduction The effect of ESRD on public health and health care economics has been a global focus for years. Agestandardized cardiovascular (CV) and non-CV mortality among dialysis patients were, respectively, 8.8and 8.1-fold higher than in the general population (1). The combined effect of high vascular morbidity and the presence of chronic inflammation and oxidative stress (2,3) may render ESRD patients more prone to develop excessive risks of CV events and death. Although ESRD patients demonstrate a high prevalence of traditional risk factors, the mechanisms underlying the development of complications still remain obscure. Therefore, it is pivotal to recognize a predictive biomarker for CV morbidity and mortality that could be conveniently measured, and allow better identification of high-risk groups. Bilirubin has both antioxidant (4,5) and anti-inflammatory (6,7) properties. The antioxidant and antiatherogenic effects of bilirubin are thought to result from its ability to inhibit the oxidation of LDL and www.cjasn.org Vol 6 March, 2011
other lipids (8,9), scavenge oxygen radicals (4), and counteract oxidative stress (10,11). In 1994, a possible role of bilirubin in atherosclerotic vascular disease was first suggested in studies showing an inverse relationship of serum total bilirubin concentrations and risk of coronary artery disease (CAD) (12). Similar inverse associations have now been shown between serum bilirubin concentrations and coronary heart disease, peripheral vascular disease, and stroke (13–15). Recent independent genome-wide linkage scans have identified a major locus in the chromosomal 2q telomere controlling serum bilirubin concentrations (16,17). The identified chromosomal region harbors the uridine diphosphate-glucuronosyltransferase (UGT1A1) gene. UGT1A1 is the only enzyme that contributes substantially to bilirubin glucuronidation, and consequently, it is the main determinant of bilirubin elimination in humans. A common cause of decreased UGT1A1 activity is the insertion of a TA in the TATAA box in the promoter region of the UGT1A1
*Department of Medicine and § Department and Institute of Physiology, National Yang-Ming University, Taipei, Taiwan; Divisions of † Cardiology and Nephrology, Department of Medicine, and ¶ Immunology Research Center, Taipei Veterans General Hospital, Taipei, Taiwan; and ‡ Division of Nephrology, Buddhist Tzu Chi Hospital Taipei Branch, Taipei, Taiwan Correspondence: Dr. Der-Cherng Tarng, Department and Institute of Physiology, National Yang-Ming University, 155, Section 2, Li-Nong Street, Taipei, Nil 11217, Taiwan. Phone: ⫹886-2-28267080; Fax: ⫹886-22826-4049; E-mail:
[email protected]
Copyright © 2011 by the American Society of Nephrology
567
568
Clinical Journal of the American Society of Nephrology
gene, designated UGT1A1*28 (18). Individuals homozygous for 7 repeats (7/7) have higher levels of serum bilirubin than heterozygotes (7/6) or those with the wild type of 6 repeats (6/6) (18 –20). It is noteworthy that ethnic differences do exist with regard to the UGT1A1*28 polymorphism (21). A few studies have investigated the association of the UGT1A1*28 allele with CV diseases (CVD) (22–26). Only the prospective Framingham Heart Study (22), which followed subjects for 24 years, found an association between the polymorphism and CV endpoints. However, little is known about whether serum bilirubin or UGT1A1*28 is associated with the risk of CV events and death in hemodialysis (HD) patients. In the study presented here, we attempted to clarify the association between serum bilirubin levels and UGT1A1*28 polymorphism, as well as their effect on CV events and all-cause mortality.
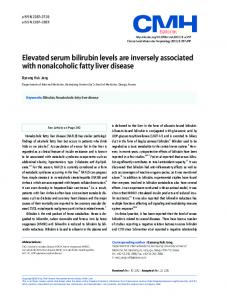
Materials and Methods Research Subjects This prospective cohort study was carried out at six dialysis centers in the Taipei metropolitan area. Study subjects were recruited between March 1997 and February 2003. Initially, all patients (n ⫽ 812) undergoing HD were screened in the six centers, and 750 clinically stable patients older than 20 years of age with a HD vintage of more than 6 months before the study were included. Exclusion criteria were weekly dialysis for less than 12 hours; inadequacy of dialysis with urea Kt/V ⬍ 1.2; conditions of malignancy, infectious disease, or sepsis; hyperbilirubinemia (total bilirubin ⬎ 2.0 mg/dl) caused by druginduced hepatitis and drugs interfering with bilirubin metabolism; and hepatobiliary disorders including acute or chronic hepatocellular disease, cirrhosis of liver, hepatic tumor, biliary tract stone or tumor, and pancreatic head tumor (Figure 1). Finally, our study population comprised 661 patients (335 men and 326 women; mean age: 58 years). The causes of ESRD were GN (n ⫽ 241), interstitial nephritis (n ⫽ 65), diabetic nephropathy (n ⫽ 195), nephrosclerosis (n ⫽ 31), polycystic kidney disease (n ⫽ 26), miscellaneous nephropathies (n ⫽ 36), and shrunken kidney resulting from unknown causes (n ⫽ 67). All of the patients were subjected to a standard bicarbonate dialysis session. HD was performed 3 times weekly using single-use dialyzers with a membrane surface area of 1.6 to 1.7 m2. The median duration of HD before study entry was 50 months (interquartile range [IQR]: 24 to 109). Controls were 152 individuals (82 men and 70 women; mean age: 59 years) with normal renal function, defined on the basis of an estimated GFR value ⬎100 ml/min per 1.73 m2 by a simplified Modifications of Diet in Renal Disease equation, who were enrolled for genotyping of the UGT1A1*28 promoter. These subjects were recruited from volunteers receiving health checkups. The Committee on Human Research of Taipei Veterans General Hospital approved the protocol. Informed consent was obtained from each study subject before study entry. Laboratory Measurements Venous blood samples were drawn from fasting healthy individuals or from HD patients who had fasted overnight
Figure 1. | Study flow and design for cohort and follow-up phases.
at the start of a midweek dialysis session before administering heparin. A 20-ml fasting venous blood sample was collected at study baseline. Total serum bilirubin was measured using the metavanadate oxidation method (Wako Pure Chemical Industries Ltd., Osaka, Japan). Intra-assay and interassay coefficients of variance for bilirubin measurement were ⬍5%. Albumin was measured using the bromocresol green method, and iron, total cholesterol, triglyceride, HDL-cholesterol, LDL-cholesterol, urea, and creatinine in serum were determined using commercial kits by a Hitachi 7600 autoanalyzer (Roche Modular; Hitachi Ltd., Tokyo, Japan). Total iron binding capacity (TIBC) was measured by using the TIBC Microtest (Daiichi, Tokyo, Japan), and serum ferritin was determined using a RIA (Incstar, Stillwater, MN). Transferrin saturation was calculated as serum iron concentration/TIBC ⫻ 100. Serum highsensitivity C-reactive protein (hsCRP) was measured by an immunoturbidimetric assay using rate nephrelometry (IMMAGE; Beckman Coulter, Galway, Ireland). Adequacy of dialysis was estimated by measuring midweek urea clearance (Kt/V) using the standard method (27). Genotyping Genotyping of the UGT1A1 promoter TA-repeat polymorphism in the TATA box at position ⫺53 was performed using the ABI 3130 ⫻ l sequencing system as recently described in detail (22). Briefly, PCR was performed with a 5-FAM (carboxyfluorescein)-labeled forward primer (5⬘CACGTGACACAGTCAAAC-3⬘) and an unlabeled reverse primer (5⬘-CAACAGTATCTTCCCAGC-3⬘). Amplification was performed for 34 cycles, and each cycle comprised de-
Clin J Am Soc Nephrol 6: 567–574, March, 2011
naturation at 94°C for 45 seconds, annealing at 62°C for 45 seconds, and extension at 72°C for 60 seconds between the initial denaturation at 94°C for 2 minutes and a final extension at 72°C for 1 minute. Finally, the PCR products were sequenced to determine the number of TA repeats over the promoter of the UGT1A1 gene. Clinical Data Collection Baseline demographic data were recorded at the time of recruitment. All patients were enrolled by one physician to minimize interobserver variations. Patient history, including smoking status and treatments for hypertension and diabetes mellitus at baseline, were recorded via an interview and confirmed by checking patient records. These data were complemented by clinical assessment of body weight, body mass index (BMI), blood pressure (BP), and fasting blood glucose. Diabetes was diagnosed on the basis of the World Health Organization criteria. Hypertension was defined as BP ⬎ 140/90 mmHg and/or the use of antihypertensive medication. Outcome Data Collection The cohort was followed up to March 2009. During the follow-up, 119 patients moved away from the dialysis facilities. Among 119 patients, 35 patients received a kidney transplant and 5 were transferred to peritoneal dialysis. The remaining 79 patients transferred to other dialysis units were reviewed using the questionnaire forms filled by the attending physicians at the units. A physician obtained information about the occurrence of interim CV events and cause of death by reviewing hospital record forms, and this information was then analyzed. The composite CV event category comprised fatal and nonfatal myocardial infarction, stroke, congestive heart failure and arrhythmia, as well as CAD, transient ischemic attack, PAD, and sudden death. The overall mortality category comprised death due to CV events, infection, sepsis, malignancy, gastrointestinal bleeding, chronic obstructive lung disease, and cachexia. At the end of the follow-up, 386 patients were confirmed to be alive on HD treatment and 235 patients had died while being treated (Figure 1). The median follow-up period was 54 months (IQR: 27 to 107). Statistical Analyses Descriptive statistics included mean values ⫾ SD for continuous data and percentages for categorical data. The values of serum hsCRP and ferritin were not normally distributed and were reported as median with IQR. Potential differences among the three patient groups of serum bilirubin tertiles at baselines were assessed by ANOVA for normally distributed data, the Kruskal–Wallis test for nonnormally distributed data, or the Pearson 2 test for categorical variables. Comparison of the genotypes and allelic frequencies of the UGT1A1*28 polymorphism in HD patients and healthy individuals were performed using the 2 test. Linear regression was used to test difference in mean levels of serum bilirubin among three genotypes. The full model included the genotype effect (coded as a recessive model for allele 7) and the covariates of age, sex, HD duration, systolic and diastolic BP, HDL- and LDL-cholesterol, serum albumin, and hsCRP. Differences in serum
Serum Bilirubin Predicts Outcomes of HD Patients, Chen et al. 569
bilirubin levels between patients with and without CV events and mortality were analyzed using the t test. Cumulative survival curves for first CV events and all-cause mortality were generated using the Kaplan–Meier method. In this analysis, patients who underwent a kidney transplant or transferred to peritoneal dialysis during the 12year follow-up were censored at the time of the transfer to alternative renal replacement therapy. Between-group survival among the tertiles of serum bilirubin and UGT1A1*28 genotypes was compared using the log-rank test. The multivariate Cox proportional hazards model was used to estimate the hazard ratios of composite CV events and all-cause mortality in relation to serum bilirubin and UGT1A1*28 polymorphism. The analysis was stepwise adjusted for traditional risk factors (age, male gender, smoking history, diabetes, hypertension, prior CVD, LDL-cholesterol, and HDL-cholesterol) and dialysis-related risk factors (HD duration, urea Kt/V, BMI, hemoglobin, serum albumin, hsCRP, ferritin, and transferrin saturation). Because of the significant association between serum bilirubin and the UGT1A1*28 polymorphism, these two variables were not offered simultaneously in a particular model to avoid multicollinearity. An additional model (genotype 7/7 versus 7/6 ⫹ 6/6 as the reference group) was used because CV event- and mortality-free survival showed no difference between genotypes 6/6 and 7/6. Statistical analyses were performed using the computer software SPSS version 16.0 (SPSS Inc., Chicago, IL). All P values were twotailed. P values ⬍0.05 were considered statistically significant.
Results
Serum bilirubin (0.78 ⫾ 0.15 mg/dl) in our cohort was normally distributed. When divided into tertiles, serum bilirubin was distributed as follows: 0.59 ⫾ 0.09 mg/dl (lower tertile), 0.76 ⫾ 0.04 mg/dl (middle tertile), and 0.99 ⫾ 0.25 mg/dl (upper tertile). The baseline demographic characteristics and traditional and dialysis-related risk factors of the study population are displayed in Table 1. There was an even distribution of characteristics among the three bilirubin tertiles including age, gender, smoking history, diabetes, hypertension, prior CVD, LDL- and HDL-cholesterol, urea Kt/V, BMI, dose of epoetin, and duration of HD. Serum bilirubin was negatively correlated with hsCRP and ferritin and positively correlated with serum albumin and hemoglobin. In Table 2, the UGT1A1*28 genotype frequencies were 65.9%, 32.8%, and 2.3% for 6/6, 7/6, and 7/7, respectively, for HD patients. The distribution of 7-allelic frequencies and genotypes was comparable with control subjects. The prevalence of the 7/7 genotype was 2.0% to 2.3%, which is much lower than that reported in Caucasian populations and occurs at a similar frequency in Southeast Asian populations (21). Mean serum bilirubin was highest in 7/7 carriers (1.34 ⫾ 0.64 mg/dl), intermediate in 7/6 carriers (0.75 ⫾ 0.15 mg/dl), and lowest in 6/6 (0.68 ⫾ 0.18 mg/dl) carriers (P ⬍ 0.001) (Figure 2). The bilirubin level of 7/7 carriers was 97% higher than that of 6/6 carriers. Table 3 displays the CV events and causes of mortality in HD patients at the end of the study. The all-cause mortality rate was 35.6% and 108 deaths (46%) were CV-related,
570
Clinical Journal of the American Society of Nephrology
Table 1. Baseline demographic and laboratory characteristics of HD patients stratified by serum bilirubin tertiles
Serum Bilirubin Tertiles Parameters
Age, years Male gender, n (%) Current smoker, n (%) Hypertension, n (%) Diabetes mellitus, n (%) Previous CV disease, n (%) HD duration, months Kt/V urea Cholesterol, mg/dl Triglyceride, mg/dl HDL-cholesterol, mg/dl LDL-cholesterol, mg/dl Systolic BP, mmHg Diastolic BP, mmHg BMI, kg/m2 hsCRP, mg/L Albumin, g/dl Hemoglobin, g/dl Dose of epoetin, U/kg per week Ferritin, g/L Transferrin saturation, % Serum bilirubin, mg/dl
Lower (n ⫽ 221)
Middle (n ⫽ 220)
Upper (n ⫽ 220)
58.8 ⫾ 13.9 114 (51.5) 76 (34.3) 131 (59.3) 72 (32.6) 65 (29.4) 75.3 ⫾ 57.6 1.81 ⫾ 0.44 173 ⫾ 38 175 ⫾ 111 40 ⫾ 12 113 ⫾ 28 144 ⫾ 22 79 ⫾ 12 21.5 ⫾ 2.8 3.89 (1.03, 8.02) 3.79 ⫾ 0.36 9.7 ⫾ 1.0 69 ⫾ 41 393 (246, 737) 32 ⫾ 14 0.59 ⫾ 0.09
58.8 ⫾ 12.8 107 (48.6) 61 (27.7) 127 (57.7) 71 (32.3) 58 (26.3) 72.1 ⫾ 60.7 1.85 ⫾ 0.66 172 ⫾ 35 172 ⫾ 112 38 ⫾ 10 112 ⫾ 29 145 ⫾ 29 78 ⫾ 10 22.0 ⫾ 3.6 3.46 (0.95, 7.07) 3.95 ⫾ 0.32 10.3 ⫾ 1.1 68 ⫾ 40 396 (224, 638) 33 ⫾ 16 0.76 ⫾ 0.04
57.5 ⫾ 13.4 114 (51.8) 74 (33.6) 120 (54.5) 63 (28.6) 73 (33.1) 73.4 ⫾ 62.8 1.83 ⫾ 0.48 172 ⫾ 37 179 ⫾ 124 38 ⫾ 12 110 ⫾ 29 145 ⫾ 22 77 ⫾ 11 22.2 ⫾ 2.9 2.92 (0.73, 6.15) 4.01 ⫾ 0.32 11.8 ⫾ 1.0 70 ⫾ 43 307 (148, 478) 33 ⫾ 15 0.99 ⫾ 0.25
P 0.469a 0.758b 0.260b 0.592b 0.632b 0.277b 0.254a 0.735a 0.993a 0.381a 0.877a 0.702a 0.851a 0.727a 0.065a 0.012c